

Download
Applications
Services
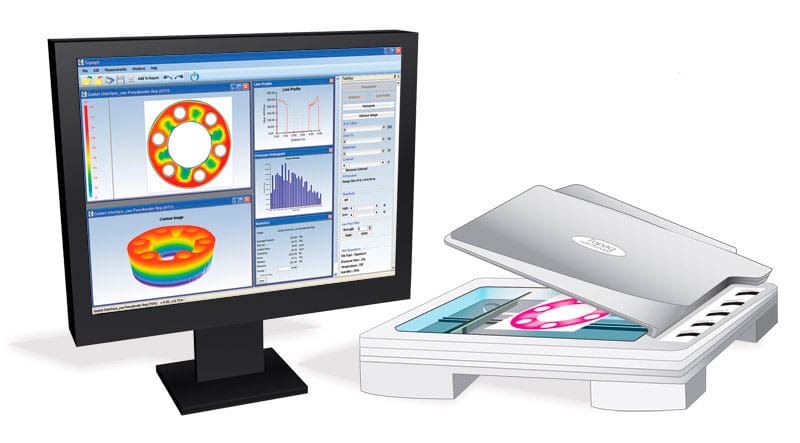
Topaq® is a revolutionary stress measurement instrument for analyzing force distribution and magnitude. Topaq®‘s user-friendly Windows based software enables the characterization of how force is disbursed in any process or assembly where two surfaces contact or impact. Sensor Products Inc. is a world leader in the design and manufacture of sensor systems exclusively for tactile pressure monitoring and analysis.
A World of Uses
Sensor Products Inc. draws on over ten years of experience to continuously extend the capabilities of tactile pressure management. With the introduction of Topaq®, engineers now have a truly affordable tool of unparalleled power and accuracy. Whether your function is R&D, design or quality assurance, Topaq® improves yield, ensures parallelism, registers the precise characteristics of an impact, validates press uniformity and aids in all types of machine calibration.
What is the Topaq® System?
Topaq® consists of a specially calibrated densitimetric scanner and Windows software. An essential component of the Topaq® system is the force indicating film commonly known as Fujifilm Prescale®. These sensor films change coloration permanently and instantaneously in response to pressure being applied to them. The Topaq® scanner and software is then used to image and interpret the stress marks on the film. From this, Topaq® renders high resolution, color calibrated images and a wealth of statistical information pertaining to the analyzed film.
Any situation in your manufacturing process or R&D center where there are two objects or surfaces coming into contact, is an opportunity for Topaq® to perform.
Unlike FEA, Topaq® is a post-process interpretive system that actually collects data from a proprietary tactile transducer.
Powerfully Simple to Use
While Topaq® is equipped with an extensive array of features, you can perform a simple analysis in a matter of minutes. The system makes it extremely easy for a new user to extract and utilize important information. Simply scan in your exposed pressure indicating film, key in a few input variables, and Topaq® instantly generates full-color pressure maps and accompanying statistical data. Even more, Topaq® is accurate to within ± 4% – unprecedented in the field of tactile pressure measurement.
A Better Way of Looking at Pressure
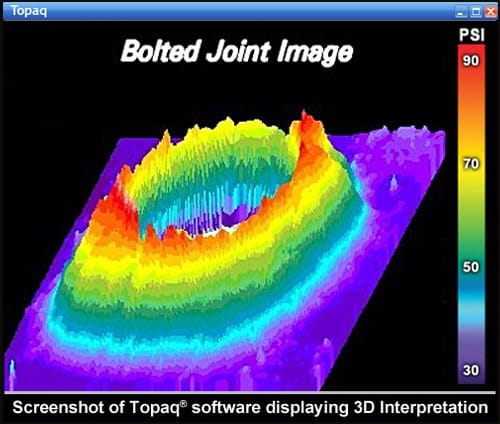
3D Interpretation: Topaq® enables you to view, rotate and flip your application image in two or three dimensional space while choosing among four different color palettes. Images can be further enhanced by varying the number of colors displayed or by utilizing Topaq’s powerful smoothing and threshholding functions. All in an effort to bring out otherwise unseen detail.
Take a Closer Look
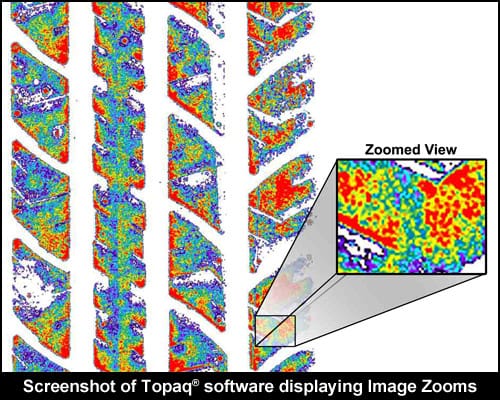
Image Zooms: This tire tread impression is magnified 300%, enabling a pixel by pixel analysis of its high pressure areas (shown in red). With Topaq®, images can be expanded or reduced from 25% to 400%. Topaq’s manual and auto-cropping features allow you to quickly slice off extraneous parts of an image, enabling detailed examination of a specific region of interest.
Topaq’s duplicate zoomed image function utilizes a proprietary algorithm that can enlarge an image without the typically accompanying increase in graininess.
Information at the Touch of a Button
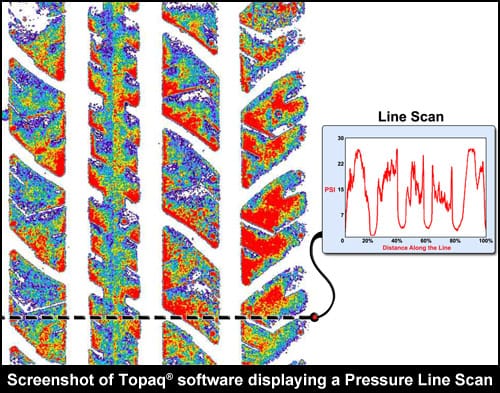
Pressure Line Scans: One example of Topaq’s powerful, single keystroke features is the ability to determine the pressure profile along a user-defined line. This line can be reduced to the width of a pixel, or expanded as wide as the image itself. This is a useful tool for assessing narrow bands of pressure over unusual or intricate shapes.
Pressure Statistics: The region statistics function yields total force, average PSI (or metric Kg/cm) and standard deviation for the entire image or a user-defined region.
Statistically Speaking Nothing Beats Topaq®
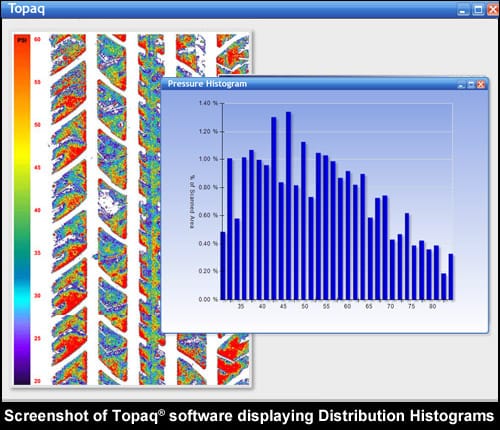
Pressure Distribution Histograms: Topaq® reads and interprets pressure variation by optically analyzing your pressure indicating sensor films and assimilating this data into a series of easy-to-read formats. A single keystroke generates the Histogram, a report that reveals the statistical distribution of pressure levels throughout your image. Of course, as with all Topaq® functions, you can perform a Histogram on a user-defined region of interest.
Topaq’s Grid-maker function can divide your image into any number of user-defined quadrants. The software then automatically calculates statistical information for each segment.
| System Specifications | |
| Optical Resolution | 100 – 1,000 DPI |
| Imaging Area | 12″ x 17″ (A3) |
| Scanning Mode | 36-bit color |
| Weight | 17 lbs. (7.7 Kg.) |
| Power Consumption | 49 Watts |
| Interface | USB |
| Scanning Time | 40 seconds |
| AC Line Voltage | 100-240 VAC |
| Light Source | Cold Cathode Lamp |
| Linearity | 0-2 O.D. |
| Light Source | Cold Cathode Lamp |
| Wavelength | 400-750 nm |
| Absorbance Range | 0-3.2 O.D. |
| Image Processing | Gamma Adjustment, Filtering |
| Networkable | Unlimited # of users |