

Article
Related Links
Department of Biomedical Engineering, Faculty of Engineering, Tel Aviv University, Tel Aviv, Israel
This study assessed the suitability of a new portable system that is based on Hertz’s contact theory for evaluating internal gluteal muscle stresses under the ischial tuberosities of wheelchair users in real-time as a risk indicator for a deep tissue injury. Sitting in a wheelchair was monitored and processed with the portable system for six control subjects and five individuals with paraplegia. We compared the resultant internal peak and average muscle stresses and stress integrals over time (stress doses) of the control subjects with those of the subjects with paraplegia and validated the results against previously published subject-specific finite element (FE) stress data for the same subjects. Individuals with paraplegia were characterized by peak muscle compression stresses (mean +/– standard deviation = 109 +/– 41 kPa) that were 2.4-fold higher than in control subjects (p < 0.03). A Bland-Altman comparison indicated that stresses recorded by the present system were in satisfactory agreement with previous subject-specific magnetic resonance imaging-FE analyses. We conclude that the present stress monitoring system has the potential to be a practical means for evaluating internal muscle stresses during everyday life of individuals with paraplegia.
Key words: contact analysis, decubitus, deep tissue injury, Hertz contact theory, muscle stress, paraplegia, pressure ulcer, rehabilitation, tissue biomechanics, wheelchair.
Introduction
Pressure ulcers are one of the most serious complications in paralyzed and immobilized patients and can have severe consequences, such as sepsis, osteomyelitis, renal failure, and myocardial infarction [1]. The European Pressure Ulcer Advisory Panel defines a pressure ulcer as “an area of localized damage to the skin and underlying tissue caused by pressure, shear, friction, or a combination of these” (https://www.epuap.org). This definition encompasses the entire range of severity of the problem, from mild skin irritation to deep tissue necrosis according to the four-stage classification system of Shea [2].
Although this classification system is widely used in clinical practice [3], it fails to indicate the nature of the development of the ulcers [4]. Depending on the form of the surface loading, pressure ulcers can develop at the skin and progress inward or initiate at the deep muscle layers and progress outward [5]. The first type is predominantly caused by shear stresses and is fairly easily detected and treated before it becomes dangerous. The latter type, caused by sustained compression of the tissue, arises at deep vulnerable muscle layers that overlay bony prominences and can rapidly expand unobserved into extensive ulceration. This latter type is considered especially harmful because layers of muscle, fascia, and subcutaneous tissue may suffer substantial necrosis, equivalent to Shea’s stage 3 or 4, when only minor signs of tissue breakdown that appear as no more than stage 1 are visible at the skin [2]. Recently, researchers have proposed redefining this type of injury as a deep tissue injury (DTI) and separating it from the common scale [6–8]. This article is mainly concerned with DTI, but the terms pressure ulcer and DTI have been used interchangeably.
All patients who have severe mobility impairment are susceptible to developing DTI. Amongst the most vulnerable populations and the primary concern of this study are people confined to a wheelchair following spinal cord injury (SCI), disease of the central nervous system, or congenital neurological disorder, since their buttocks support a large portion of their weight during the majority of the day [9–10]. Such patients, who lack natural sensations of discomfort and pain, may experience prolonged compression of soft tissues under their ischial tuberosities (IT) [11]. Hence, DTI owing to excessive tissue deformation, ischemia, and hypoxia may develop unnoticed under the IT until advanced stages. Indeed, between one-third and slightly less than half of all people with SCI will develop pressure ulcers during the years immediately following their trauma [12–14]. About 5 to 7 percent of these will eventually require hospitalization, and 7 to 8 percent of those who require hospitalization will die of consequent complications [1,15].
Studies continue to draw attention to the unacceptably high prevalence of pressure ulcers in hospitals and nursing homes. Conclusive figures are difficult to determine because of the differences in data collection, but most studies agree on a prevalence of around 9 to 21 percent in acute care and 9 to 27 percent in long-term care [1,8,16–17]. Annual treatment costs of pressure ulcers in the United States exceed U.S. $1 billion [8,18–19], and in the United Kingdom, they are around 300 million pounds [20]. Avoiding a single pressure ulcer may save as much as U.S. $151,700 in treatment of complications and advanced injuries [8].
Most investigators agree that intensity and duration of the compression forces involved are crucial factors in the onset and extent of tissue damage. Evidence for susceptibility of muscle to compression injury was found in several studies [21–27], while in comparison, skin and subcutaneous tissues appear more resistant to pressure [21–23]. However, because of obvious limitations, experiments in this line have only been carried out on animal models or tissue-engineered constructs [5]. Recently, data from various experiments have been integrated to define a mathematical sigmoid pressure-time cell death threshold curve for albino rats, which are the most common animal models in use [28].
Other theories for the onset of tissue damage include collapse of capillaries and lymph nodes [29–31], reperfusion injury [32–34], and cell deformation under pressure [5,33,35]. The last has been studied using finite element (FE) models with a damage threshold law derived from previous experiments [4,36]. Cell death accumulation and the subsequent microstructural heterogeneity were found to cause irregular cell deformations that highly exceeded macrostructural deformations and led to the spread of tissue damage.
In FE models that simulate the buttocks under pressure, stiffened tissues have been shown to increase maximum pressures under the IT and coccyx [37]. A positive feedback mechanism was observed, in which the damaged area continues to expand under prolonged compression [14,38]. It is hypothesized that damage first occurs under the IT, where compression stress concentrations can be as high as 32 ± 9 kPa (mean ± standard deviation [SD]) according to a recent integrated magnetic resonance imaging (MRI) and FE study of sitting (nondisabled) subjects [39]. The wound then spreads with a snowball effect, as tissue undergoes structural and mechanical changes, and draws more st
ress to the injured area. This finding indicates that constant, immediate estimation of mechanical stresses under the IT is critical for assessment of injury initiation—once initiation occurs, damage is not only irreversible but also very difficult to arrest.
Previous studies have monitored interface pressures in real-time under the buttocks [18,40–48], but these values have been proven to be much smaller than those from the loading situation in the muscle itself, especially near the IT [49]. Other studies have adopted a much more accurate approach, estimating stresses in the muscles under the IT using FE and complex calculations, at the cost of immediacy and portability [4,36,39]. In particular, a new method for evaluating the individual’s internal stress state in muscle and fat tissues of the buttocks that employs MRI measurements of internal tissue deformation coupled with FE analyses of resulting tissue stresses was recently introduced by our group [39]. Never before have the two approaches been fused together to monitor patient-specific internal muscle stresses in real-time while allowing patient mobility. To achieve real-time tissue stress evaluations, we need to select the most important mechanical interactions in the load-bearing buttocks as related to DTI. The literature reviewed previously clearly indicates that (1) DTI involves skeletal muscle tissue injury and is likely to initiate in muscle tissue, (2) compressive mechanical loading (such as compressive stress, deformation, or strain) is the most important cause of DTI, and (3) DTI cannot develop without such mechanical loading [5, 22,26,33]. Accordingly, the method and system developed in this study focus on the mechanical interactions between the IT and underlying gluteus muscles during sitting.
The goals of this study were therefore (1) to develop a patient-specific system for real-time evaluation of internal mechanical stresses in the gluteus muscle under the IT of wheelchair users, (2) to employ the system and determine differences between gluteal muscle stresses in individuals with paraplegia versus control subjects during sitting as well as explore whether these differences provide additional information to that provided by the commonly accepted interface pressure measurements, and (3) to compare stress data from this new system with conservative (non-real-time) subject-specific MRI-FE analyses for the same subject group [39] in order to validate the muscle stress evaluations.
Methods
Patient-Specific Bone-Muscle Contact Stress Evaluations
When simplified, the bone-muscle contact region in the human buttocks may be represented as a rigid indenter, i.e., the IT, and a half-space of elastic material, the gluteus muscle (Figure 1). In order to calculate timedependent compression stresses in muscle tissue under the IT during sitting, we developed a software program that simulated the IT-muscle contact problem (Visual C++, version 6, Microsoft Corp; Redmond, Washington) and employed the classical Hertz sphere/half-space (indenter-specimen) contact model (Appendix, available online only at https://www.rehab.research.va.gov/; all mention of the Appendix in this article refers to the same document). Real-time calculation and depiction of gluteal muscle stress distributions in both top and side cross-sections are available (Figure 2), as well as graphs of peak stresses, the scale of which are constantly updated as stresses progress. An interface allows the user to input individual parameters, including the subject’s bone radius of curvature and muscle tissue thickness based on ultrasound and/or MRI scans as well as the bone and muscle’s elastic moduli and Poisson’s ratios (Figure 2). A region of interest (ROI) around the IT and the frequency of sampling may be modified. The color scale is automatically adjusted to the patient’s range of muscle stresses during the session.
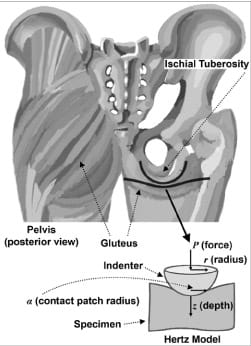
Figure 1. Classical Hertz sphere/half-space contact model as simplified representation of ischial tuberosity and gluteus.
Data may be saved in a log file for further analysis at a later stage. The more complex analysis allows, in addition to documentation of peak stresses, calculations of averages of stresses over the ROI, and integration of average stresses on the depth and radial axes over time in order to evaluate “stress doses.” The data that the user chooses to examine are recorded in a separate text file, which is easily converted into tables and graphs with Microsoft Excel or a similar program.
Model Validation Studies
First, validation of the software implementing the muscle stress calculations described in the Appendix was carried out with a physical model of a rigid plastic half-sphere pressed against a soft silicon cube to simulate the half-sphere and elastic layer of the Hertz contact problem (Figure 1). The silicon was characterized by an elastic modulus of 2.12 MPa and a Poisson’s ratio of 0.5, and the plastic indenter by an elastic modulus of 10 GPa and a Poisson’s ratio of 0.3.
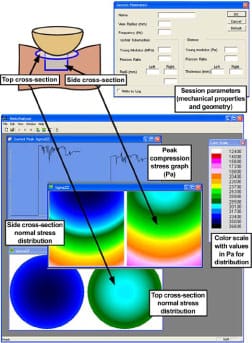
Figure 2. Hertz model software: parameters dialog, cross-sections of left and right gluteus, peak maximal compression stress graph, and color scale.
The model was compressed quasi-statically at a speed of 10 mm/min by means of an Instron 5544 material testing machine (Instron; Norwood, Massachusetts). A paper-thin, flexible contact stress sensor (FlexiForce, Tekscan Inc; South Boston, Massachusetts) was placed between the silicon and the half-sphere. Compression was halted at three discrete points where the load cell indicated forces of 40, 80, and 120 N, respectively, which cover the load capacity of the sensor. The maximal calibration force of 120 N is a plausible estimate for the force a moderate-weight person might impose on one IT [50]. Force and displacement were recorded with the Instron 5544. Stresses were recorded at a sampling frequency of 100 Hz and analyzed with LabView 8.1 (National Instruments Corp; Austin, Texas). Ten contact stress measurements were averaged at the three loading points. The operation was repeated with two different sensors.
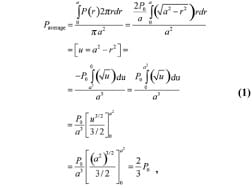
Peak compression stresses (P0) were calculated with the Hertz model program (Appendix) at three respective loading simulations using the mechanical properties of a silicon cube and plastic half-sphere. Since measurements reflect average stresses over the sensor area, these data were compared with average stresses of the software (Paverage) for the contact patch by where P(r) is the contact stress at a radius r from the origin (center of IT contact with muscle tissue), P0 is the peak contact (compression) stress, a is the contact patch radius, and u is a geometric parameter based on r and a (Appendix). The absolute relative error between experiments and predictions of the model was found to be 7 percent.
Next, a three-dimensional FE computational model of a silicon cube and half-sphere was created (MSC Software Corp; Santa Ana, California). The geometry and mechanical properties of the model were identical to those of the experimental apparatus described previously. The automatic meshing feature of the MSC Patran preprocessor was employed to create a fine mesh of 2,744 solid Hex8 elements and 234 solid Tet4 elements for the silicon cube and the half-sphere, respectively. The rigid half-sphere was allowed vertical movement only. Displacements of the cube base were completely constrained; at all other points, the cube was allowed to displace without restraint. At each discrete loading point, the total load carried by the model was identical to the forc
e measured by the Instron 5544 testing machine. The nonlinear largedeformation static analysis that was carried out resulted in Cauchy component stresses as well as the deformations of the two bodies. Peak and average stresses were calculated and compared with the Hertz model program stresses. The absolute relative error between the Hertz model used for the bone-muscle contact stress studies in sitting (as described in the next section “Human Studies”) and the FE validation analysis was 8 percent, similar to that between the Hertz model and validation experiments.
As a last step of validation, we compared the peak internal muscle stress data obtained from each participating subject using the present method with their peak stress data obtained using our previously reported MRIFE method [39]. Briefly, the MRI-FE is not a conventional FE theoretical analysis but rather a stress evaluation that approaches a direct measurement of the stress distributions in tissues in a noninvasive manner [39]. Specifically, in the MRI-FE method, models of the undeformed buttocks are built for each individual subject using an MRI scan taken at the coronal plane in a nonweight- bearing sitting posture. Using a second MRI scan taken from each subject during weight-bearing sitting, we characterized the IT sag toward the sitting surface in weight-bearing and used these data as displacement boundary conditions for the FE models [39]. Hence, we were able to analyze differences between data from the two methods, Hertz and MRI-FE, for each subject (detailed in “Results” section).
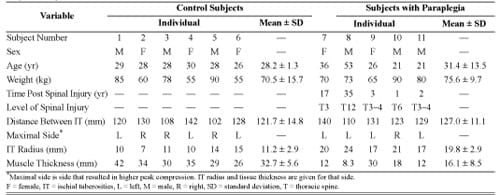
Table. Subject anthropometric and medical data. Variable
Human Studies
All subjects recruited for this study were chosen for their previous participation in patient-specific MRI-FE modeling experiments at our laboratory [39]. A convenience sample group of six control subjects took part in the trials as well as five individuals with paraplegia, provided they did not have an active pressure ulcer, they were not pregnant, and their upper body was functional, i.e., they could lift themselves off their wheelchair using their arms. Their anthropometric data, measured with coronal MRI scans of the buttocks, are given in the Table. Body weights of subjects with paraplegia (mean ± SD = 75.6 ± 9.7 kg) were statistically indistinguishable from those of the control subjects (70.5 ± 15.7 kg) in a two-tail unpaired t-test.
The study was approved by the Helsinki committee of Sheba Medical Center (Ramat-Gan, Israel), where patients were studied, and informed consent was obtained from each participant.
Experiments were conducted with a wheelchair and an air cell cushion that was adjusted for each individual (Figure 3). Control subjects were requested to sit comfortably, with feet on footrests and arms on armrests, while watching a movie of their choice for over an hour. The first 3 minutes of each trial were processed separately to test whether internal muscle stress data differ between a shorter and a longer sitting time.
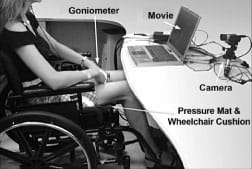
Figure 3. Experimental setup.
At the end of the experiment, an extra weight of 5 kg was added to the front of the torso of each control subject for a period of 3 minutes. The extra weight was applied by means of a specially designed water bag that was able to distribute the load over the torso so we could determine potential effects of additional weight on bone-muscle contact stresses [39].
Subjects with paraplegia were instructed to sit in a similar manner, and experiments were carried out for 3 minutes (longer sitting trials were not performed for this group because data from controls showed mild differences between muscle stresses at short and long sitting durations, “Results” section).
We measured interface pressures at a rate of 1 Hz using a commercial pressure mat that was placed in between the sitter and the cushion (256 2.5 × 2.5 cm2 sensors, Tactilus®, Sensor Products Inc; Madison, New Jersey). The sensors used in the mat are piezoresistive, and each has capacity of 141 kg/cm2, accuracy of ±10 percent, repeatability of ±2 percent, hysteresis of ±5 percent, and nonlinearity of ±1.5 percent. The creep and hysteresis effects natural to the sensors were automatically corrected by the software.
Finally, we evaluated differences between peak pressure data during sitting from the two groups in order to determine whether the previous deep tissue stress analyses provided additional information to that available from the commonly used interface pressure measurements. Hence, we acquired interface pressure data from each participant while he or she sat on a flat rigid surface for 3 minutes, with the consideration that sitting on a rigid surface would cause potential differences in peak pressures between the two groups to be more profound.
In order to allow for the assumption of long-term elastic moduli of muscle tissue after viscoelastic stress relaxation, we discarded the first full minute of all experimental data, consistent with the finding that most stress relaxation in muscle tissue loaded perpendicularly to the direction of muscle fibers occurs within approximately 20 s [51].
For every sampled interface pressure frame, the force running through the IT was calculated in the following manner: two peak pressure measurements were marked in the area excluding the thighs, such that the lateral distance between them matched the distance between the IT as measured from the subject’s MRI scan (Table) and the sagittal distance was no more than one row of sensors. Around these points, pressures in a radius of at most three sensors were summed and then multiplied by the sensor area to yield a time-dependent estimated force.
Individual parameters of IT bone radius of curvature, thickness of the muscle tissue under the IT, and the distance between the two IT were also provided by MRI scans (Table) and input into the software. Specifically, the IT radius of curvature was determined from MRI scans of the buttocks in the sitting posture conducted while subjects sat erect on a specially designed acrylic chair within an open MRI, as described in an earlier publication [39]. The IT radius of each subject was determined from the coronal MRI scan showing the thinnest underlying muscle layer by fitting a circle to the inferior surface of the IT bone contour on that image [39].
The mechanical properties of muscle tissue (elastic modulus 8.5 kPa, Poisson’s ratio 0.5) and bone (elastic modulus 7.3 GPa, Poisson’s ratio 0.3) were based on previously obtained experimental data [39,51]. The elastic modulus of muscle tissue was multiplied by a correction factor a, which was assigned a subject-specific value (Appendix) to account for the finite thickness of the muscle layers and the large deformations into them, according to the analysis of Zhang et al. [52].
Analysis of muscle stresses was limited to an ROI defined as a cylinder with radius of 4 mm around the central point of contact between bone and muscle (see the model in Figure 1). The peak compression stress in muscle (P0) is the stress calculated directly beneath the bone, at the center of the contact area. Stress doses on the z-axis (Dz) and r-axis (Dr) were calculated as measures of the time exposure to stress [28] by integrating the average muscle compression stresses S(z,r) over the sitting time t along the respective axes for 120 s by
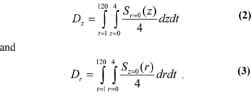
These values were translated into discrete calculations by dividing the ROI radius of 4 mm into 150 discrete points at which stresses were calculated an
d then averaged, and each average was multiplied by the time frame between samples (1 s) by
where s is a discrete time step and n is a discrete point between the origin (the center of bone-muscle contact area) and the ROI boundary.
Results
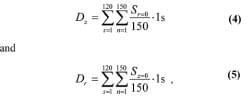
An example of peak compression stresses (P0) and doses in left and right sides of two control subjects during 2 minutes of sitting is shown in Figure 4. In all results reported subsequently, the side of the buttocks that produced higher peak stress values was analyzed and depicted (Table). A drop in time-dependent stresses can be seen toward the end of the data of one of the subjects in Figure 4(a) (subject 4, right body side). This drop is due to a short spontaneous inclination to the front, as captured by our stress monitoring system.
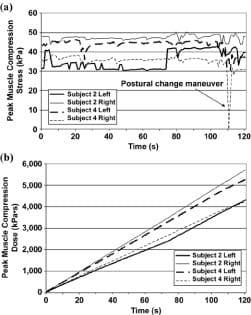
Figure 4. (a) Peak compression stresses in gluteus muscles at left and right body sides of two control subjects during 2 minutes of sitting and (b) peak muscle stress doses of same two subjects during same 2 minutes.
The mean of peak compression stresses in muscles of control subjects during 2 minutes was 46 ± 6 kPa (all data given as mean ± SD unless otherwise noted), and the mean of average compression stresses during the same 2 minutes was 43 ± 6 kPa (Figure 5(a)). In the group of subjects with paraplegia, the corresponding mean of muscle stress peaks was 109 ± 41 kPa and their mean of average muscle stresses was 98 ± 44 kPa (Figure 5(a)). Hence, the group of subjects with paraplegia was characterized by peak gluteal muscle stresses that were 2.4- fold that of the control group (p = 0.026, Figure 5(a)).
Mean dose of average compression stresses over 2 minutes across the control subjects was 5,146 ± 718 kPa·s on the z-axis and 10,053 ± 1,446 kPa·s on the r-axis (Figure 5(b)). Subjects with paraplegia were characterized by a mean dose of 11,727 ± 5,255 kPa·s on the z-axis and 22,558 ± 9,892 kPa·s on the r-axis (Figure 5(b)). Hence, stress doses of the individuals with paraplegia were similarly 2.3-fold higher than those of control subjects on the z-axis (p = 0.048) and 2.2-fold higher on the r-axis (p = 0.047, Figure 5(b)).
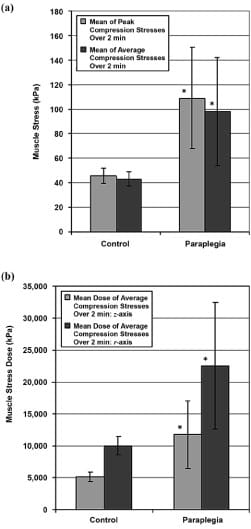
Figure 5. (a) Peak and average gluteal muscle compression stresses in control subjects and subjects with paraplegia and (b) doses of average muscle stress in same subjects. Sitting data were acquired during 3 minutes for both groups, and data from terminal 2 minutes were analyzed to allow assumption of long-term elastic moduli of muscle tissue. Error bars indicate standard deviation from mean. *p < 0.05 with respect to data from control group.
The mean of peak pressures while sitting on a rigid surface was 19 ± 4 kPa for the controls and 29 ± 10 kPa for the subjects with paraplegia. Though the peak pressure data of individuals with paraplegia were on average 1.5- fold higher than that of controls, the difference was not statistically significant (p = 0.08), which indicates that deep tissue stress parameters distinguish much better between the groups and thus provide important additional information on top of the commonly measured peak interface pressure data.
The mean of peak muscle compression stresses across control subjects with an extra weight of 5 kg distributed over their trunk for 3 minutes was found to be 51 ± 6 kPa, i.e., 5.8 kPa higher than without the extra weight (p = 0.002 in a paired two-tail t-test, Figure 6).
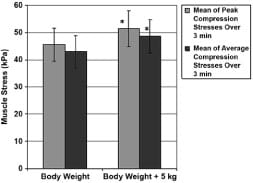
Figure 6. Peak and average gluteal muscle compression stresses in control subjects with and without 5 kg extra weight that was distributed over trunk. Error bars indicate standard deviation from mean. *p < 0.01 with respect to no extra weight condition.
The mean of peak muscle compression stresses of all control subjects during the long-term sitting session of 60 minutes was 49 ± 7 kPa, which is mildly but significantly higher than that recorded during the short-term (2 minute) sitting session, 43 ± 6 kPa (p = 0.015 in a paired two-tail t-test, Figure 7). The mean of average muscle compression stresses was the same in long- and short-term sitting, i.e., 43 ± 6 kPa (Figure 7).
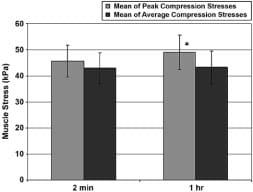
Figure 7. Peak and average peak gluteal muscle compression stresses in control subjects during short-term (2 minute) and long-term (1 hour) sitting sessions. Error bars indicate standard deviation from mean. *p < 0.02 with respect to short-term sitting trial.
Peak muscle compression stresses determined during sitting sessions of the six control subjects and four of the individuals with paraplegia by a subject-specific MRI-FE method as reported in a previous publication [39] were compared with results from the current Hertz model. The resolution of the MRI scans for subject 8 was insufficient to allow analysis of internal muscle stresses using our previously developed MRI-FE method [39]; hence, for that subject, we did not have previous data available to compare with the present method. The comparison, by means of a Bland-Altman difference plot [53], is provided in Figure 8. This plot shows that the Hertz model is slightly, but not significantly, more severe (by a factor of 1.13) in estimating muscle compression stresses. Separation of the two groups revealed that the control group produced a Hertz average that was 1.43-fold that of the FE average (p = 0.01 in a paired two-tail t-test), but in the group of subjects with paraplegia, no significant difference could be established. Importantly, the Bland-Altman plot indicated that 9 out of 10 maximal peak stress data points were well within the ±2 SD lines of agreement (Figure 8).
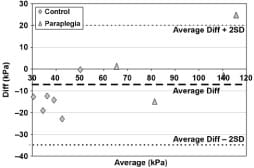
Figure 8. Average-difference (Diff) comparison (Bland-Altman plot) of maximal peak compression stresses in 6 control subjects and 4 subjects with paraplegia as recorded by present Hertz model and previously reported patient-specific finite element (FE) method (see Linder-Ganz E, Shabshin N, Itzchak Y, Gefen A. Assessment of mechanical conditions in sub-dermal tissues during sitting: A combined experimental-MRI and finite element approach. J Biomech. 2007; 40(7):1443–54. [PMID: 16920122] for details of FE method). SD = standard deviation.
Discussion
At a time when the major developments in evaluating stresses inside soft tissue rely on advanced technology, complex software, and a constantly rising quantity of calculations, our model pauses to take a more straightforward, practically oriented view of the DTI problem. The device ultimately envisioned requires a one-time simple ultrasound or possibly an MRI scan (if available) and a few moments to enter fundamental characteristics of an individual. The apparatus is then ready to accompany a patient all day, every day, constantly checking his or her intramuscular mechanical stresses and possibly warning him or her in due time to change posture. As opposed to other studies [37,39,54], the presently developed device is independent of resource-consuming commercial software; the computer resources required for monitoring compression stresses are minimal, and the model can run on a laptop or even a personal digital assistant if the graphic display is cut down or removed completely.
The new method examined in this study indicates a great potential for predicting compression stresses within the
soft tissues under the IT, but the road to utilize it in the clinical setting is still long. It is not as accurate as using subject-specific MRI-FE [39]; for although no significant difference was established in the group of subjects with paraplegia [55], the new method does give an overestimation that is about 1.4-fold higher than that of the MRI-FE model for control subjects [39]. With further trials, the model may be fine-tuned to give a more accurate estimate for the controls as well. Clinical utility will also require further adjustments/improvements of the model and system, e.g., extracting the IT radius data from ultrasound rather than MRI, and large scale clinical studies, including prospective randomized clinical trials to test the predictive power of the present system in preventing or reducing the prevalence of DTI. Furthermore, in order to make concrete clinical use of this model, we must perform additional basic research to determine the stress and stress dose thresholds that may endanger the viability and integrity of muscle and other subdermal tissues [28,33,36].
Maximal compression stresses were found to be 2.4- fold higher in the group of subjects with paraplegia than in the control group (Figure 5). Previous researchers attributed this finding to the atrophy of tissue in wheelchair users [47,56]. In this small-scale study, the average tissue thickness of the control subjects was twice that of the subjects with paraplegia (p = 0.008 in an unpaired two-tail t-test, Table), which may confirm the hypothesis for abnormally high stresses within the tissue of the latter. A reverse relationship exists concerning the bone curvature radius: subjects with paraplegia had 1.8-fold the radius of control subjects (p = 0.001 in an unpaired twotail t-test, Table). These personal parameters are minute and concealed from view, yet highly influence the stresses within the soft tissues [57]; indeed, from our observations during the present study and related published studies [39,57], we would cautiously venture to say they are much more critical than contact pressures measured at the interface.
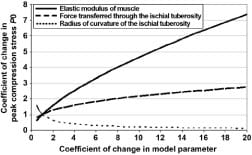
The loss of cortical bone in paraplegia, as well as some shape adaptation of the IT to the sustained sitting loads, may explain the higher radii of curvature of the IT in subjects with paraplegia [58]. Since the model predicts that an increase in the radius of the bone indenter should reduce the peak compression stress in underlying muscle (Appendix), the pathoanatomy of the IT in subjects with paraplegia may theoretically have some protective effect as related to DTI, but it is counteracted by the loss of muscle thickness that increases muscle stresses. To investigate this interaction further, we analyzed the relative sensitivity of peak muscle compression stress calculations to changes in the model parameters, namely, the elastic modulus of muscle tissue, the force transferred through the IT (which depends on the body posture and is measured in real-time), and the radius of curvature of the IT (Figure 9). The results of this sensitivity analysis, detailed in the Appendix, indicate that the peak stress and stress distribution in muscle tissue are sensitive to both the individual’s IT radius and muscle mechanical properties, which further indicates that interface pressure measurements may not be sufficient to predict the risk for DTI because these parameters are not taken directly into account when interface pressures alone are monitored.
The effect of extra weight on compression stresses (Figure 6) was not as severe as the results in our previous patient-specific MRI-FE study—only 1.13-fold that of the normal weight compared with 2.5-fold in the MRI-FE [39]. Sensitivity tests indicate that weight, or force, is not as significant a factor in this model as other factors, such as the IT radius and tissue elastic modulus, the latter of which was modified according to each subject’s anatomy (Appendix, Figure 9). This result was especially notable in subject 7, whose peak force calculated for the right buttock was almost twice that of the left buttock but whose peak compression stress was nearly the same on both sides. An interesting observation is that although 5 kg is an addition of about 7 percent to the average weight of the control subjects in this study, the increment in the peak stress—5.8 kPa—was equivalent to 13 percent of the peak muscle stress without the extra weight. Implications to obesity cannot be made directly, though, since obesity involves thickening of the subdermal fat layer in the buttocks, which probably has some cushioning effect on internal muscle stresses that was not accounted for in our extra weight simulations.
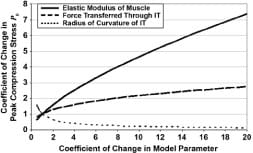
Figure 9. Analysis of sensitivity of peak muscle compression stress calculations to changes in model parameters, namely, elastic modulus of muscle tissue, force transferred through ischial tuberosities (IT) (which depends on body posture and is measured in real-time), and radius of curvature of IT.
In both short-term (2 minutes) and long-term (1 hour) sitting sessions of the control group (Figure 7), the mean of average muscle compression stresses was 43 ± 6 kPa. However, the mean of peak compression stresses was 3.4 kPa higher for the long-term session. Perhaps this increase is due to the natural restlessness that builds up during prolonged sitting in a control subject: a person leans to one side and then to the other, inclines forward or backward. As a result, the balance is shifted temporarily and stresses rise on one side, only to be countered with a subsequent shift to the other side: the average does not change much but the maximal stresses escalate. When treating a population with neural dysfunction, one has to consider their lack of natural restlessness, as demonstrated in this study and others [59], and compensate for it.
Validation of the model was carried out with a soft silicon cube and plastic half-sphere, silicon and plastic being common materials for simulating human soft tissue and bones, respectively [60–61]. Characteristics of silicon should be taken into account when considering the results of the validation tests: the Hertz model was indeed designed for an isotropic, homogenous, elastic material but not one that would allow substantial deformations. Still, the error found in the present validation trials is relatively small, and so the model is a practical means for providing quick, real-time evaluation of internal muscle stresses in wheelchair users in a way that can facilitate future clinical utilization. Comparison of the current data with those from a study of a previously developed physical- biological phantom of the buttocks that included real (bovine) muscle tissue and a geometrical replica of the human IT provides further validation for the present results [62]. Specifically, for the large deformations of muscle tissue that occur in the gluteus of sitting subjects with paraplegia, the physical-biological phantom study yielded peak bone-muscle compression stresses that were 5.5 ± 2.5-fold the peak interface pressure [62]; a finding that is in excellent agreement with the present study, where this ratio was found to be 4.9 ± 3.3 for the group of subjects with paraplegia.
The simplicity of the Hertz contact model and its relatively low demand for computer resources facilitates real-time operation and portability even on a handheld device. Reliance on a pure theory taken from mechanical engineering has its drawbacks, though, especially when applied in such an intricate environment as the human body (this limitation is further discussed in the Appendix). Some of the basic assumptions of the Hertz model, e.g., the elasticity of the two contacting bodies, the relatively small area of contact in comparison to the size of the bodies themselves, the elasticity of the deformations, and the absolute smoothness of the contacting surfaces, are, to put it mildly, inaccurate when describing the body [57]. It
is therefore almost surprising that the overall results of the model are very plausible in comparison to other state-of-the-art investigations [37,39,54,62–64]. The explanation may lie in the fundamental nature of the model and the ease with which it accepts corrections (Appendix).
One major limitation of this study concerning the model is the generalization of the physical anatomy and mechanical properties of the buttocks (further discussed in the Appendix). Needless to say, the IT is not a perfect half-sphere and does not have the same mechanical properties in all subjects; it is a unique living structure that has a distinctive elastic modulus depending on its location and physical history and should be evaluated on an individual basis [65]. Similarly, the tissue underneath is not a flat infinite half-space, and characteristics such as viscoelasticity and stiffening over time according to physical circumstances [14] should be considered.
Another limitation can be attributed to the inaccuracy of force measurement under each IT. The distribution of load transfer via the skeleton and soft tissue to the buttock- cushion interface is a debatable question [66]. This study employed a simple algorithm that considered the pressures in a ~7.5 cm radius around the two IT peaks, took up few computer resources, and could easily run in real-time. At present, no means are available of determining if indeed the radius includes all the force running through the IT and only the IT. In some individuals, the radius may not encompass all of the force; in others, it may cover the whole IT and also some of the force running through the thighs or coccyx. In fact, both options may occur in the same individual as posture changes. The air cushion used for the studies, which is the normative for wheelchair users, increases the difficulty of making a clear-cut separation between the various buttock areas because it works to disperse contact pressures into a wider, vaguer perimeter. In order to overcome this limitation, a more complex algorithm must be employed without compromising the program’s ability to run in real-time. A pressure mat with a denser layout of sensors may assist in a more accurate definition of areas.
Conclusions
In closure, we conclude that the model shown in this study could not give an exact analysis of the stress situation within the soft tissues of a wheelchair user; instead, it is a practical, functional, feasible method that provides an acceptable evaluation. Importantly, the portability of this system should be taken advantage of to study the muscle stresses in daily life of wheelchair users and associate them with the development of pressure ulcers and DTI. However, we must note that this study is a pilot to verify feasibility of the new method. A larger-scale study should now be conducted in order to fine-tune the present model and to find correlation to the previously developed MRI-FE method [39]. Finally, given the practical employment possibilities of the model, such as a personal alarm system or an automatic feedback system, we believe that in the future, with further development, it may help individuals with paraplegia to lessen or even completely avoid DTI.
Acknowledgements
We would like to thank Mr. Eran Linder-Ganz, MSc, from the Musculoskeletal Biomechanics Laboratory of the Department of Biomedical Engineering at Tel Aviv University for his help with the human studies. This material was based on work supported in part by the Slezak Super Center for Cardiac Research and Biomedical Engineering at Tel Aviv University (grant 0605533181) and by the Internal Research Fund of Tel Aviv University (grant 3161) (both grants to Dr. Gefen). The authors have declared that no competing interests exist.
References
- Thomas DR. Prevention and treatment of pressure ulcers: What works? What doesn’t? Cleve Clin J Med. 2001;68(8): 704–7, 710–14, 717–22. [PMID: 11510528]
- Shea JD. Pressure sores: Classification and management. Clin Orthop Relat Res. 1975;(112):89–100. [PMID: 1192654]
- Ankrom MA, Bennett RG, Sprigle S, Langemo D, Black JM, Berlowitz DR, Lyder CH; National Pressure Ulcer Advisory Panel. Pressure-related deep tissue injury under intact skin and the current pressure ulcer staging systems. Adv Skin Wound Care. 2005;18(1):35–42. [PMID: 15714036]
- Breuls RG, Bouten CV, Oomens CW, Bader DL, Baaijens FP. A theoretical analysis of damage evolution in skeletal muscle tissue with reference to pressure ulcer development. J Biomech Eng. 2003;125(6):902–9. [PMID: 14986417]
- Bouten CV, Oomens CW, Baaijens FP, Bader DL. The etiology of pressure ulcers: Skin deep or muscle bound? Arch Phys Med Rehabil. 2003;84(4):616–19. [PMID: 12690603]
- Donnelly J; National Pressure Ulcer Advisory Panel. Should we include deep tissue injury in pressure ulcer staging systems? The NPUAP debate. J Wound Care. 2005; 14(5):207–10. [PMID: 15909435]
- Black JM; National Pressure Ulcer Advisory Panel. Moving toward consensus on deep tissue injury and pressure ulcer staging. Adv Skin Wound Care. 2005;18(8):415–16, 418, 420–21. [PMID: 16217153]
- Zulkowski K, Langemo D, Posthauer ME; National Pressure Ulcer Advisory Panel. Coming to consensus on deep tissue injury. Adv Skin Wound Care. 2005;18(1):28–29. [PMID: 15714033]
- Ash D. An exploration of the occurrence of pressure ulcers in a British spinal injuries unit. J Clin Nurs. 2002;11(4): 470–78. [PMID: 12100643]
- Garber SL, Rintala DH. Pressure ulcers in veterans with spinal cord injury: A retrospective study. J Rehabil Res Dev. 2003;40(5):433–41. [PMID: 15080228]
- Kosiak M. Etiology and pathology of ischemic ulcers. Arch Phys Med Rehabil. 1959;40(2):62–69. [PMID: 13618101]
- Krause JS. Skin sores after spinal cord injury: Relationship to life adjustment. Spinal Cord. 1998;36(1):51–56. [PMID: 9471139]
- Staas WE Jr, Cioschi HM. Pressure sores—A multifaceted approach to prevention and treatment. West J Med. 1991; 154(5):539–44. [PMID: 1830985]
- Gefen A, Gefen N, Linder-Ganz E, Margulies SS. In vivo muscle stiffening under bone compression promotes deep pressure sores. J Biomech Eng. 2005;127(3):512–24. [PMID: 16060358]
- Reuler JB, Cooney TG. The pressure sore: Pathophysiology and principles of management. Ann Intern Med. 1981; 94(5):661–66. [PMID: 7235399]
- Thoroddsen A. Pressure sore prevalence: A national survey. J Clin Nurs. 1999;8(2):170–79. [PMID: 10401350]
- Lahmann NA, Halfens RJ, Dassen T. Pressure ulcers in German nursing homes and acute care hospitals: Prevalence, frequency, and ulcer characteristics. Ostomy Wound Manage. 2006;52(2):20–33. [PMID: 16464992]
- Brienza DM, Karg PE, Geyer MJ, Kelsey S, Trefler E. The relationship between pressure ulcer incidence and buttockseat cushion interface pressure in at-risk elderly wheelchair users. Arch Phys Med Rehabil. 2001;82(4):529–33. [PMID: 11295017]
- The injury fact book 2001–2002. Atlanta (GA): National Center for Injury Prevention and Control, Centers for Disease Control and Prevention; 2001. 20. Stockton L, Parker D. Pressure relief behaviour and the prevention of pressure ulcers in wheelchair users in the community. J Tissue Viability. 2002;12(3):84, 88–90, 92. [PMID: 12168491]
- Stockton L, Parker D. Pressure relief behaviour and the prevention of pressure ulcers in wheelchair users in the community. J Tissue Viability. 2002;12(3):84, 88–90, 92. [PMID: 12168491]
- Husain T. An experimental study of some pressure effects on tissues, with reference to the bed-sore problem. J Pathol Bacteriol. 1953;66(2):347–58. [PMID: 13118439]
- Nola GT, Vistnes LM. Differential response of skin and muscle in the experimental production of pressure sores. Plast Reconstr Surg. 1980;66(5):728–33. [PMID: 7001518]
- Daniel RK, Priest DL, Wheatley DC. Etiologic factors in pressure sores: An experi
mental model. Arch Phys Med Rehabil. 1981;62(10):492–98. [PMID: 7305643] - Bosboom EM, Bouten CV, Oomens CW, Van Straaten HW, Baaijens FP, Kuipers H. Quantification and localisation of damage in rat muscles after controlled loading; a new approach to study the aetiology of pressure sores. Med Eng Phys. 2001;23(3):195–200. [PMID: 11410384]
- Linder-Ganz E, Gefen A. Mechanical compression-induced pressure sores in rat hindlimb: Muscle stiffness, histology, and computational models. J Appl Physiol. 2004;96(6): 2034–49. [PMID: 14766784]
- Stekelenburg A, Oomens CW, Strijkers GJ, Nicolay K, Bader DL. Compression-induced deep tissue injury examined with magnetic resonance imaging and histology. J Appl Physiol. 2006;100(6):1946–54. [PMID: 16484364]
- Bosboom EM, Oomens CW, Bouten CV, Janssen JD, Kuipers H. The aetiology of pressure sores: Combining animal experiments and finite element modeling. In: American Society of Mechanical Engineers (ASME) Proceedings of the Bioengineering Conference; 1999 Jun 6–20; Big Sky, MT. New York: ASME International; 1999.
- Linder-Ganz E, Engelberg S, Scheinowitz M, Gefen A. Pressure-time cell death threshold for albino rat skeletal muscles as related to pressure sore biomechanics. J Biomech. 2006;39(14):2725–32. [PMID: 16199045]
- Defloor T. The risk of pressure sores: A conceptual scheme. J Clin Nurs. 1999;8(2):206–16. [PMID: 10401354]
- Reddy NP, Patel H, Cochran GV, Brunski JB. Model experiments to study the stress distributions in a seated buttock. J Biomech. 1982;15(7):493–504. [PMID: 7130205]
- Krouskop TA, Reddy NP, Spencer WA, Secor JW. Mechanisms of decubitus ulcer formation—An hypothesis. Med Hypotheses. 1978;4(1):37–39. [PMID: 634177]
- Houwing R, Overgoor M, Kon M, Jansen G, Van Asbeck BS, Haalboom JR. Pressure-induced skin lesions in pigs: Reperfusion injury and the effects of vitamin E. J Wound Care. 2000;9(1):36–40. [PMID: 10827667]
- Breuls RG, Bouten CV, Oomens CW, Bader DL, Baaijens FP. Compression induced cell damage in engineered muscle tissue: An in vitro model to study pressure ulcer aetiology. Ann Biomed Eng. 2003;31(11):1357–64. [PMID: 14758926]
- Peirce SM, Skalak TC, Rodeheaver GT. Ischemia-reperfusion injury in chronic pressure ulcer formation: A skin model in the rat. Wound Repair Regen. 2000;8(1):68–76. [PMID: 10760216]
- Bouten CV, Breuls RG, Peeters EA, Oomens CW, Baaijens FP. In vitro models to study compressive strain-induced muscle cell damage. Biorheology. 2003;40(1–3):383–88. [PMID: 12454430]
- Breuls RG, Sengers BG, Oomens CW, Bouten CV, Baaijens FP. Predicting local cell deformations in engineered tissue constructs: A multilevel finite element approach. J Biomech Eng. 2002;124(2):198–207. [PMID: 12002129]
- Verver MM, Van Hoof J, Oomens CW, Wismans JS, Baaijens FP. A finite element model of the human buttocks for prediction of seat pressure distributions. Comput Methods Biomech Biomed Engin. 2004;7(4):193–203. [PMID: 15512763]
- Kuroda S, Akimoto M. Finite element analysis of undermining of pressure ulcer with a simple cylinder model. J Nippon Med Sch. 2005;72(3):174–78. [PMID: 16046834]
- Linder-Ganz E, Shabshin N, Itzchak Y, Gefen A. Assessment of mechanical conditions in sub-dermal tissues during sitting: A combined experimental-MRI and finite element approach. J Biomech. 2007;40(7):1443–54. [PMID: 16920122]
- Kosiak M, Kubicek WG, Olson M, Danz JN, Kottke FJ. Evaluation of pressure as a factor in the production of ischial ulcers. Arch Phys Med Rehabil. 1958;39(10):623–29. [PMID: 13584092]
- Garber SL, Krouskop TA. Wheelchair cushion modification and its effect on pressure. Arch Phys Med Rehabil. 1984;65(10):579–83. [PMID: 6487060]
- Garber SL, Krouskop TA, Carter RE. A system for clinically evaluating wheelchair pressure-relief cushions. Am J Occup Ther. 1978;32(9):565–70. [PMID: 556427]
- Conine TA, Hershler C, Daechsel D, Peel C, Pearson A. Pressure ulcer prophylaxis in elderly patients using polyurethane foam or Jay wheelchair cushions. Int J Rehabil Res. 1994;17(2):123–37. [PMID: 7960335]
- Conine TA, Daechsel D, Hershler C. Pressure sore prophylaxis in elderly patients using slab foam or customized contoured foam wheelchair cushions. Occup Ther J Res. 1993; 13(2):101–16.
- Takechi H, Tokuhiro A. Evaluation of wheelchair cushions by means of pressure distribution mapping. Acta Med Okayama. 1998;52(5):245–54. [PMID: 9810434]
- Defloor T, Grypdonck MH. Do pressure relief cushions really relieve pressure? West J Nurs Res. 2000;22(3):335–50. [PMID: 10804896]
- Ferrarin M, Andreoni G, Pedotti A. Comparative biomechanical evaluation of different wheelchair seat cushions. J Rehabil Res Dev. 2000;37(3):315–24. [PMID: 10917263]
- Guimaraes E, Mann WC. Evaluation of pressure and durability of a low-cost wheelchair cushion designed for developing countries. Int J Rehabil Res. 2003;26(2):141–43. [PMID: 12799609]
- Le KM, Madsen BL, Barth PW, Ksander GA, Angell JB, Vistnes LM. An in-depth look at pressure sores using monolithic silicon pressure sensors. Plast Reconstr Surg. 1984;74(6):745–56. [PMID: 6505095]
- Gilsdorf P, Patterson R, Fisher S. Thirty-minute continuous sitting force measurements with different support surfaces in the spinal cord injured and able-bodied. J Rehabil Res Dev. 1991;28(4):33–38. [PMID: 1941647]
- Palevski A, Glaich I, Portnoy S, Linder-Ganz E, Gefen A. Stress relaxation of porcine gluteus muscle subjected to sudden transverse deformation as related to pressure sore modeling. J Biomech Eng. 2006;128(5):782–87. [PMID: 16995767]
- Zhang M, Zheng YP, Mak AF. Estimating the effective Young’s modulus of soft tissues from indentation tests— Nonlinear finite element analysis of effects of friction and large deformation. Med Eng Phys. 1997;19(6):512–17. [PMID: 9394898]
- Bland JM, Altman DG. Statistical methods for assessing agreement between two methods of clinical measurement. Lancet. 1986;1(8476):307–10. [PMID: 2868172]
- Oomens CW, Bressers OF, Bosboom EM, Bouten CV, Blader DL. Can loaded interface characteristics influence strain distributions in muscle adjacent to bony prominences? Comput Methods Biomech Biomed Engin. 2003; 6(3):171–80. [PMID: 12888429]
- Linder-Ganz E, Shabshin N, Itzchak Y, Siev-Ner I, Gefen A. Peak gluteal muscle strain and stress values during sitting are greater in paraplegics than in normals. In: 2007 Proceedings of American Society of Mechanical Engineers (ASME) Summer Bioengineering Conference; 2007 Jun 20–24; Keystone, CO. New York: ASME International; 2007.
- Eitzen I. Pressure mapping in seating: A frequency analysis approach. Arch Phys Med Rehabil. 2004;85(7):1136–40. [PMID: 15241764]
- Gefen A. Risk factors for a pressure-related deep tissue injury: A theoretical model. Med Biol Eng Comput. 2007; 45(6):563–73. [PMID: 17486382]
- Jiang SD, Dai LY, Jiang LS. Osteoporosis after spinal cord injury. Osteoporos Int. 2006;17(2):180–92. [PMID: 16217589] Erratum in: Osteoporos Int. 2006;17(8):1278–81.
- Linder-Ganz E, Scheinowitz M, Yizhar Z, Margulies SS, Gefen A. How do normals move during prolonged wheelchair- sitting? Technol Health Care. 2007;15(3):195–202. [PMID: 17473399]
- Linder-Ganz E, Yarnitzky G, Portnoy S, Yizhar Z, Gefen A. Real-time finite element monitoring of internal stresses in the buttock during wheelchair sitting to prevent pressure sores: Verification and phantom results. In: Rodrigues H, editor. Proceedings of the II International Conference on Computational Bioengineering; 2005 Sep 14–16; Lisbon, Portugal. Lisbon (Portugal): IST Press; 2005.
- Portnoy S, Yarnitzky G, Yizhar Z, Kristal A, Oppenheim U, Siev-Ner I, Gefen A. Real-time patient-specific finite element analysis of internal stresses in the soft tissues of a residual limb: A new tool for prosthetic fitting. Ann Biomed Eng. 2007;35(1):120–35. [PMID: 17120139]
- Gefen A, Levine J. The false premise
in measuring bodysupport interface pressures for preventing serious pressure ulcers. J Med Eng Technol. 2007;31(5):375–80. [PMID: 17701783] - Ragan R, Kernozek TW, Bidar M, Matheson JW. Seatinterface pressures on various thicknesses of foam wheelchair cushions: A finite modeling approach. Arch Phys Med Rehabil. 2002;83(6):872–75. [PMID: 12048671]
- Sun Q, Lin F, Al-Saeede S, Ruberte L, Nam E, Hendrix R, Makhsous M. Finite element modeling of human buttockthigh tissue in a seated posture. In: 2005 Proceedings of American Society of Mechanical Engineers (ASME) Summer Bioengineering Conference; 2005 Jun 22–26; Vail, CO. New York: ASME International; 2005.
- Diamant I, Shahar R, Masharawi Y, Gefen A. A method for patient-specific evaluation of vertebral cancellous bone strength: In vitro validation. Clin Biomech (Bristol, Avon). 2007;22(3):282–91. [PMID: 17134802]
- Todd BA, Thacker JG. Three-dimensional computer model of the human buttocks, in vivo. J Rehabil Res Dev. 1994; 31(2):111–19. [PMID: 7965867]
Submitted for publication July 30, 2007. Accepted in revised form October 23, 2007.
Appendix: The Hertz contact theory
The Hertz contact theory consists of a series of mathematical equations to calculate normal, hoop, radial, and shear stress components on and within a soft flat surface or half-space, known as the specimen, when pressed by a rigid hemisphere called the indentor (Appendix Figure 1) [1]. We have employed this theory in order to calculate stresses within muscle tissue when pressed by the ischial tuberosities (IT). The Hertz theory is based on a number of assumptions that are not necessarily in line with the physical reality of the buttocks geometry and must be accounted for when considering the results of the present application of the Hertz model [2–3]. The foremost of these assumptions are that the half-space is infinite and the deformations into it are relatively small, that both surfaces are ideally smooth (no friction between them), and that the materials are homogeneous, isotropic. and elastic. The first assumption stands in contrast to the anatomy of the IT and gluteus—the muscle is not an infinite half-space tolerating small indentations but a finitethickness tissue enduring large deformations. In order to compensate for this assumption and take the large deformation mechanics into account, we employed a correction factor a (Appendix Figure 2), projecting the Zhang et al. study [4] to a 25% indentation of the tissue [5]. The second assumption disagrees with the fact that the IT and the gluteus are physically connected and therefore not only is friction a fundamental part of their interaction but practically there is no such thing as a “contact patch”—a radius outside of which there is no contact between the bodies according to the Hertz model. The third assumption implies that the muscle will probably behave, mechanically, in a more complex manner than we presume in the model. Still, the contradiction between assumptions and physical reality influences mostly the stress components of tension and shear, which, on initial examination, were found to be too remote from the well-established values of finite element (FE) models and were therefore excluded from the scope of this study. Nevertheless, keeping a comprehensive and futuristic view in mind, the model and system were developed for the whole range of stress components.
The following parameters serve the equations
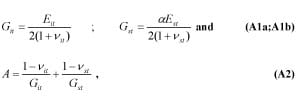
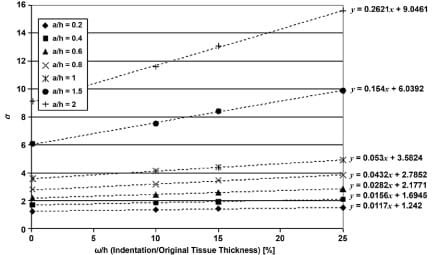
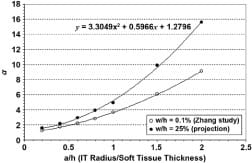
where Git, Gst are the shear modulus of IT and muscle tissue, respectively, ?it, ?st are their Poisson’s ratios, Eit, Est are the elastic moduli, and a is the correction factor for large deformations in the tissue. Zhang et al. [4] carried out studies on a FE model to determine a (termed ? in their paper) by indenting a tissue layer at 0.1, 10, and 15% of its original finite thickness (h). This was performed for a series of ratios between the indenter radii (a) to the original thickness (h). We projected these values linearly to determine a series of a-s at the indentation of 25% (Appendix Figure 2). A second degree polynomial was fitted to this series in order to calculate a for a subject’s IT radius over soft tissue thickness ratio (Appendix Figure 3). k, the curvature is defined as
where Rit, Rst are the radii of IT and muscle soft tissue, respectively. Rst is considered infinite for a half-space. A time-dependent contact patch radius, a(t), is calculated by
where F(t) is the time-dependent compressive force transferred through the IT due to body weight (measured herein in real-time by integration of interface pressures over the buttockssupport contact area under the IT).
A geometric parameter u(t), for a specific point in the tissue, is given by
where r is the radius from the origin, that is, the center of bone-muscle contact, and z is the depth into the tissue.
The time-dependent peak bone-muscle contact (compression) stress P0(t, is
and the time-dependent internal compression stress distribution in the muscle is
The axes where r=0 and z=0 are special cases where the equations are simplified. Specifically, when r=0

In order to depict the individual influences of the model parameters on the measure outcome of peak muscle compression stress P0(t), we conducted a sensitivity analysis. Specifically, we determined the relative sensitivity of peak muscle compression stress calculations to changes in the model parameters, namely, the elastic modulus of muscle tissue, the force transferred through the ischial tuberosity (IT) which depends on the body posture and is measured in real-time, and the radius of curvature of the IT (Appendix Figure 4). The results of this analysis revealed that in the physiologically-reasonable range of parameter variation, i.e. coefficient of change in model parameters in the order of up to 2-3 [6–7] variations in muscle stiffness and IT radius of curvature appear to affect peak compression stresses in muscle to a similar extent (though in opposite trends). For (theoretical) greater parameter variations, the reduction in peak muscle stress with the increasing IT radius becomes asymptotic, whereas further increase in muscle tissue stiffness has a more monotonic effect on increasing peak muscle stress (Appendix Figure 4). A more comprehensive sensitivity analysis of this model that also considers the presence and time-course of development of deep tissue injury, and its potential effects on the stress state in muscle tissue under the IT, is provided elsewhere [2].
Appendix Figure 1. Classical Hertz sphere-half space contact model as simplified representation of ischial tuberosities and gluteus.

Appendix Figure 2. Linear projections of Zhang et al. st
udy [4]. Each series of a values for a/h ratio (a = ischial tuberosity radius, h = muscle tissue thickness) was projected linearly to indentation/original tissue thickness ratio of 25 percent. Linear equations used are shown by each trend line.
Appendix Figure 3. Polynomial for calculation of correction factor a, given subject’s muscle tissue thickness and ischial tuberosity radius. Our projection for indentation of 25 percent is shown, along with original data adopted from Zhang [4].
Appendix Figure 4. Analysis of sensitivity of peak muscle compression stress calculations to changes in model parameters, namely, elastic modulus of muscle tissue, force transferred through ischial tuberosity (IT) (which depends on body posture and is measured in real-time), and radius of curvature of IT.
References
- Huber MT. Zur theorie der ber?hrung fester elastischer körper. Annalen der Physik. 1904;14:153–63.
- Gefen A. Risk factors for a pressure-related deep tissue injury: A theoretical model. Med Biol Eng Comput. 2007;45(6):563–73. [PMID: 17486382]
- Deeg EW. New algorithms for calculating Hertzian stresses, deformations, and contact zone parameters. AMP J Technol. 1992;2:14–24.
- Zhang M, Zheng YP, Mak AF. Estimating the effective Young’s modulus of soft tissues from indentation tests—Nonlinear finite element analysis of effects of friction and large deformation. Med Eng Phys. 1997;19(6):512–17. [PMID: 9394898]
- Oomens CW, Bressers OF, Bosboom EM, Bouten CV, Blader DL. Can loaded interface characteristics influence strain distributions in muscle adjacent to bony prominences? Comput Methods Biomech Biomed Engin. 2003;6(3):171–80. [PMID: 12888429]
- Linder-Ganz E, Shabshin N, Itzchak Y, Gefen A. Assessment of mechanical conditions in subdermal tissues during sitting: A combined experimental-MRI and finite element approach. J Biomech. 2007;40(7):1443–54. [PMID: 16920122]
- Palevski A, Glaich I, Portnoy S, Linder-Ganz E, Gefen A. Stress relaxation of porcine gluteus muscle subjected to sudden transverse deformation as related to pressure sore modeling. J Biomech Eng. 2006;128(5):782–87. [PMID: 16995767]
![]()