

Article
Related Links
Vincent Caccese a,*, Keith A. Berube a, Mauricio Fernandez a, J. Daniel Melo b, Jean Paul Kabche a
a University of Maine, Department of Mechanical Engineering, 5711 Boardman Hall, Orono, ME 04469, USA
b Universidade Federal do Rio Grande do Norte, Department of Materials Engineering, Natal, RN 59072-970, Brazil
Abstract
This paper presents an experimental investigation of the influence of stress relaxation on clamp-up load in hybrid composite-to-metal bolted connections. Loss of bolt clamp-up load may influence the strength and fatigue life of the connection. This study focuses on the effects of bolt retightening, use of taperedhead bolts versus protruding-head bolts, and briefly addresses environmental effects including temperature. All tests were conducted for a time period of at least three months in order to estimate primary and secondary stress relaxation effects. Bolt clamp-up load curves were fit to three different but similar equations for stress relaxation using a least squares method. The bolt retightening tests show that some of the preload in the connections can be maintained with periodic retightening of the bolts. Little difference in relaxation was observed when comparing tapered-head bolts with protruding-head bolts, given that roughly equal stress relaxation rates were observed. In a limited amount of testing, it was observed that temperature shifts caused more rapid stress relaxation rates and that post cure of the composite is essential to achieve a stable thermal response.
Keywords:
1. Introduction
The present experimental study of stress relaxation in hybrid composite/metal bolted connections is part of an ongoing effort to investigate the response of hybrid composite/metal connections used in US Navy vessels. Bolted connections are used in structures where the ability to easily remove structural components is required. Concern over the effect of stress relaxation due to the viscoelastic nature of the composite material was the impetus for this study. Stress relaxation due to creep in the through-the-thickness direction of the composite material typically occurs in bolted composite connections. Accordingly, a composite panel bolted in the thickness direction is susceptible to loss of clamp-up load, due to the viscoelastic nature of the resin, which dominates the through-the-thickness direction response. Loss of clamp-up load may have a deleterious effect on the strength and the fatigue life of the connection.
The US Navy currently has interest in developing hull-forms using advanced materials such as composites and corrosion resistant metals in order to enhance its future naval capabilities. Meeting stiffness requirements in some applications may be difficult with E-glass/vinyl ester (EG/VE) composites due to their low material stiffness when compared to a metal such as steel. Hybrid construction has merged the use of metals and composites as a way of implementing EG/VE systems into the bulk of the structure, while maintaining adequate stiffness. Barsoum [1] describes the development of hybrid hulls where non-magnetic stainless steel is used in combination with EG/VE composites to create advanced hull-forms with low electromagnetic signatures. He stated that EG/ VE composites alone lack the stiffness and in-plane strength required for the larger ship hull structures. Alm [2] estimated that a 50-m composite naval ship would be 2.4 times less stiff than its steel counterpart indicating the potential benefit of hybrid systems. Kabche et al. [3] described a hybrid system where composite panels are attached to a metallic sub-structure; which provided the impetus for this research effort.
1.1. Use of bolted hybrid connections
Oftentimes it is feasible to attach dissimilar materials using bonded connections to reduce the effects of stress concentrations. In some instances, however the use of bolted hybrid connections is necessary, especially in cases where removable panels are required. The hybrid joint presents a greater challenge than that found in joining similar materials, mainly due to the differences in the constituent material properties. While bolted connections offer easily removable parts, the bolt clamp-up load may be compromised by bolt stress relaxation. Composites tend to creep over time due to the viscoelastic nature of the matrix material, which leads to potential loss of bolt clamp-up load. In marine structures, this can adversely affect the watertight integrity of the joint. In order to maintain a watertight connection, stress relaxation in the bolts must be adequately understood. Relaxation effects need be quantified so that they are properly accounted for in design. The goal of this study is to perform a preliminary assessment of the important parameters that govern stress relaxation in hybrid composite- to-metal bolted connections. In this way, watertight, cost effective and reliable connections may be developed.
Maintaining adequate bolt clamp-up load can significantly affect the strength of the connection. One example is shown by Sun et al. [4] who demonstrated the importance of clamp-up force on bolt strength through finite element analysis and experimental validation. The strength of double lap shear pin joints made of T800H/3900-2 graphite epoxy was highly dependent on clampup stress. Their work also showed that increasing the clamping area resulted in stronger joints. Another example is the work by Starikov and Schon [5] on fatigue of carbon fiber/epoxy bolted joints loaded in-plane. Their research demonstrated that the clamp-up load can influence the fatigue life and also that the applied load influences the clamp-up stress distribution as the connection deforms.
1.2. Creep response of composites
Several methods have been used over the years to model the creep behavior of materials. These methods are formally described by Findley et al. [6]. In composite materials, the creep effects are due primarily to the viscoelastic properties of the resin. Creep of polymer composites is a non-linear, time-dependent phenomenon and is affected primarily by stress history, temperature, environment and time [7]. A study by Shen et al. [8] found that creep was extremely sensitive to water; the immersion of composites in water accelerated the recovery of the surface due to creep. Other factors affecting the creep response of a composite system are the type and architecture of the reinforcing fibers, temperature, and humidity. For a given strain rate, the relaxation behavior of the composite is very similar for both loading and unloading, according to Kim and Sun [9].
Much past research has been done on creep response in the fiber direction, where creep is dependent upon the properties of the matrix material, the fiber material and the fiber volume fraction. Kim and McMeeking [10] performed tests on
creep in composite materials in the fiber direction and showed that fiber slipping and/or mass transfer can greatly reduce the creep strength of a composite system. Raghavan and Meshii [7] performed studies on the long-term deformation and strength of composites using short-term test data obtained for accelerated testing conditions such as higher temperature, stress, and humidity. Maksimov and Plume [11] researched the effects of different fiber materials on the creep of the composite. Scott and Zureick [12] performed long-term testing on pultruded E-glass/vinyl ester composites under longitudinal compressive loading and modeled their experimental results using the power law developed by Findley et al. [6].
1.3. Stress relaxation in bolted connections
The creep response in the direction perpendicular to the fibers (through-thickness direction) is almost entirely dictated by the matrix material in a bi-axially reinforced laminate. In bolted connections, this gives rise to the stress relaxation phenomenon, where creep effects are typically observed in the through-thickness direction. Hence, in time, a composite bolted in the thickness direction is highly susceptible to preload loss, as demonstrated by Weerth and Ortloff [13]. According to Pang and Wang [14], adding stitching in the through the thickness direction of a composite can improve the overall creep resistance of bolted joints since the bolt load causes stress in that direction. Experiments and numerical modeling performed by Chen and Kung [15] have shown that the preload in bolted joints is highly sensitive to changes in temperature and humidity. As observed by Guedes et al. [16], the timedependent properties of the composite are most largely influenced by the resin and the interface between the fiber and the resin. Environmental factors, such as humidity, are typically coupled with the mechanical loading of the composite joint and the mechanical response of the composite is dependent upon exposure time.
1.4. Models of bolt stress relaxation
Shivakumar and Crews [17] presented their work on bolt clamp-up relaxation in simple T300/5208 graphite/epoxy connections. They concluded that clamp-up force undergoes significant relaxation even at room temperature dry conditions. Relaxation of 30% was predicted for exposure duration of 20 years. Increased rates of relaxation were shown at elevated temperature and moisture content. They performed viscoelastic finite element analysis with some experimental verification. This work included the effects of temperature and humidity and they developed the expression relating the non-dimensional clamp-up load loss versus time as follows:
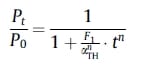
where Pt is the load at time t, P0 is the initial clamp-up load, F1 is a material dependent constant, n is the viscoelastic power law constant for the material and αTH is a hygrothermal shift factor which accounts for variations in temperature and humidity. When no hygrothermal shift is considered this expression can be reduced to the following:
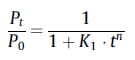
Fox [18] presented a study of bolted E-glass/vinylester joints using 15.9 mm (5/8 in.) diameter load sensing bolts with a tapered-head adapter to quantify the effect of tapered-head bolts on the connection response. The study used a lap shear connection geometry and quasi-isotropic layup for the composite bolted to a 9.5 mm (3/8 in.) thick steel plate with washers below the plate. Both relaxation and lap shear tests were performed. Relaxation tests were carried out for approximately 120 h. The data reduction and least squares fit was performed using Eq. (2). For highly torqued tapered-head bolts, the constants were found to be K1 = 0.0861 and n = 0.2519. It was also found that if the initial clamping force is low, load loss can decay to near zero in a very short period of time. The data on bearing strength tests suggested that there may be a moderate increase in strength with clamp-up load.
Weerth and Ortloff [13] studied composites in a bolted connection using a test set up that consisted of an E-glass/vinyl-ester cylindrical coupon sandwiched between 2 washers held together by a bolt. The load history was read through the use of washer load cells and a computerized data acquisition system. A 15.9 mm (0.625 in.) diameter bolt was used in conjunction with a composite having a bearing area of 298 mm2(0.462 in.2). Specimens were preloaded at an ambient temperature of 21 °C (70 °F) which was increased to 49 °C (120 °F) during the relaxation phase. Tests were run for periods of 1 day, 1 month, 1 year, 5 years and 10 years. The loss of preload was found to be 15%, 28%, 36%, 41% and 43%, respectively. The load loss data was found to fit the power law form, and the preload loss was predicted using the following power law equation:
where Pt is the load in pounds in the connection at any time, t, and P0 is the initial preload. The constants in the exponent of this expression were computed by curve fit in US customary units to the data collected from six test samples tested using a preload ranging from 56 kN (12,621 lbs) to 1.4 kN (314 lbs) resulting in an average composite material stress range of 188–4.7 MPa.
A simple power law expression can be used be to account for a shift in time required to compute the load at t = 0 as follows:
This expression results in the initial preload at t = 0 and includes a single parameter, α, in the curve fit. The value of α may depend upon such variables as temperature, humidity, moisture content, stress and thickness. Use of the single parameter allows for a simple numerical case by case comparison when compared to the 2- parameter model in Eq. (2). A 2-parameter power law expression for computation of the bolt load loss with respect to time was employed prior by Pelletier et al. [19] for bolted hybrid connections. This power law expression is given by Eq. (5) as follows:
In this expression α and β are constants that depend on constituent materials, geometry and test conditions. This expression normally results in a closer curve fit than Eq. (4) but does not result in the initial preload at t = 0 unless β is equal to unity. A value of β other than one may be due to the continually changing load value at the start of the tests which is affected by the primary creep response.
2. Test objectives
The objective of the experimental effort described herein is to characterize the stress relaxation of hybrid bolted connections under normal use conditions. Hybrid connections were studied at a sub-component level in order to isolate the effects of the viscoelastic creep on the relaxation of the bolt. Several parameters were studied in this investigation as follows: (1) bolt stress distribution; (2) bolt retightening; (3) varying thickness of the constituents; (4) varying bolt size; (5) type of bolt used (protruding-head versus tapered-head) and (6) thermal cycling.
2.1. Test article configuration
Two primary types of tests were conducted, namely compression block tests and single bolt tests. The test fixture schematic diagrams are shown in Figs. 1 and 2. For the compression block tests, the fixture consists of two large steel blocks, with a composite sample being compressed be
tween the two, as shown in Fig. 1. The objective is to impose a relatively uniform stress state on the composite material as compared to the stress state in a tightened bolt passing through a hole. The fixture has a square cross-sectional area of 152 mm x 152 mm. The bottom block is 74.61 mm high, while the top block is 46 mm high. The composite sample consists of a square specimen, 50.8 mm x 50.8 mm, with a constant thickness of 12.7 mm. Four grade 8 bolts, with a diameter of 12.7 mm, were placed at the four sides of the blocks to apply the compressive load.
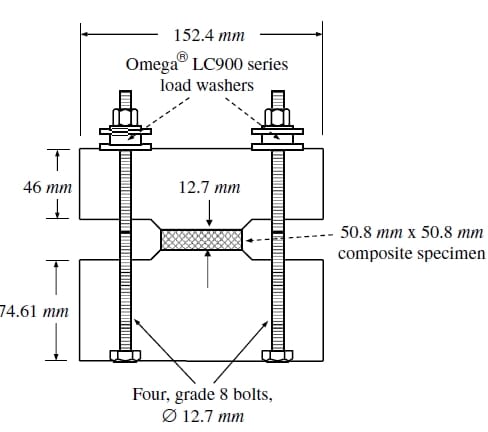
Fig. 1. Compression block test fixture
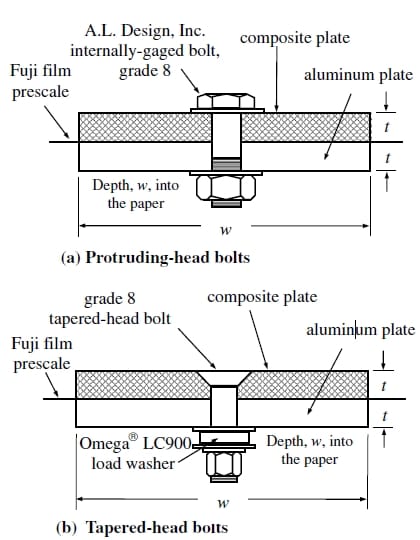
Fig. 2. Bolt stress relaxation test articles.
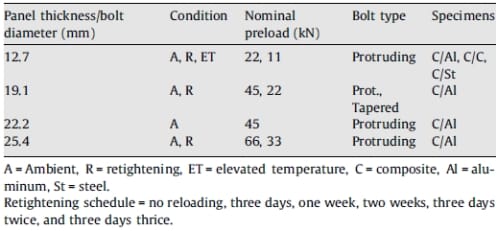
Table 1 – Relaxation test schedule
2.2. Materials and test article fabrication
The materials used for the composite test article fabrication were DOW Derakane 8084 vinyl ester resin and E-glass fibers. The reinforcing fibers were 680 g of 0–90° and 680 g of ±45° knit fabric, manufactured by Brunswick Technologies, Inc. (BTI) The 0° and 90° fibers are stitched together, as are the +45 and -45° fibers. The composite material specimens were fabricated at the Hybrid Structures Laboratory (HSL), University of Maine, using a vacuum- assisted resin transfer molding process (VARTM). A quasi-isotropic lay-up configuration was used, [(±45, 0/90)n]s, where n varied according to the panel thickness. The process resulted in a fiber volume content of 51%. Cure of the specimens was done at room temperature for a minimum of 6 months prior to testing. Compression block test articles were cut from the same panel. For the retightening, bolt type, and environmental tests, the metallic plates were made of grade 6061-T6 aluminum or A36 steel plate and the bolts were instrumented steel bolts. The plates of the compression block tests were made of A36 grade steel.
2.3. Coefficient of thermal expansion measurement
The coefficient of thermal expansion (CTE) of the composite material was measured using dynamic mechanical analysis (DMA). The instrument used was a DMA Q800 from TA Instruments. The CTE test specimens were 8-mm cubes machined to meet ASTM E 831-05 and they were cut from the same 12.7 mm-thick E-glass/vinyl-ester panel fabricated at the University of Maine Hybrid Structures Laboratory that was used in the bolt clamp-up load loss study. Seven specimens were tested in the through-the-thickness direction. The first six were tested “as received”. The seventh was post cured to a temperature of 180 °C for 1 h before the CTE test. Test procedures and process were verified using copper coupons and a quartz sample was used as the baseline control. Fig. 3 shows a sample DMA test with a glass transition temperature (Tg) of 78.7 °C. The CTE in the range of interest of 0–50 °C is approximated as a straight line.
The copper sample tests resulted in an average CTE of 16.3 x 10⁻⁶/°C compared to reported results of 16.9 x 10⁻⁶/°C in the ASTM 831-05 standard at 50 °C. Test results for the composite specimens are given in Table 2 at a heating rate of 5 °C/min. Post curing of the composite specimen resulted in an increased glass transition temperature and virtually no change in the CTE as the average result of the first five composite CTE tests is 45.8 x 10⁻⁶/°C compared to 46.4 x 10⁻⁶/°C for the post cured specimen. Post curing substantially increased the glass transition temperature from 79 to 110 °C.
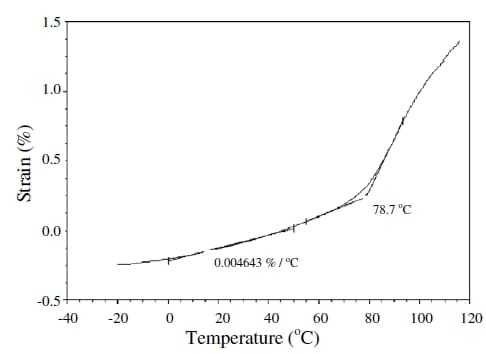
Fig. 3. DMA test to measure the CTE.
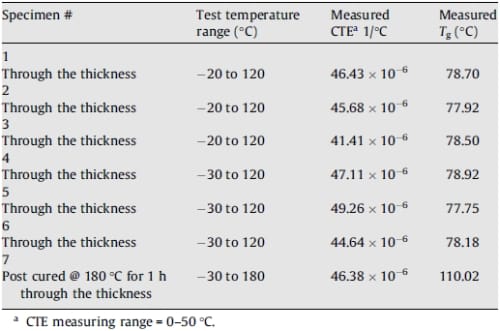
Table 2 – CTE and Tg experimental results
3. Testing method
Four different test procedures were utilized for this experimental investigation to observe the effect of the different parameters that affect the creep response of hybrid joints. These tests were: compression block tests, bolt retightening tests, bolt type tests, and elevated temperature tests. The objectives and procedures for each test are described below. Testing also included a control sample where a bolt was attached to an aluminum plate with no composite in place. A computer controlled data acquisition system was used to monitor the bolt load at predefined time intervals.
3.1. Test descriptions
The compression block test is used to quantify the stress relaxation of the composite laminate in the transverse direction, while subjected to a relatively uniform through-the-thickness stress state. The composite specimen was placed between the two steel plates of the compression block. The bolts were torqued to the desired preload incrementally while being held in a torquing fixture. The bolt load was monitored during the torquing process. Data acquisition was initiated when the bolts were all within 5% of the desired preload.
The retorquing test is used to study the effects of bolt retightening on the stress relaxation of the connection. The parameters under study included varying preload, thickness of the composite, and the time between bolt retightening. Pressure paper was placed between the plates to record the peak contact stress distribution. The test procedure included periodic retightening of the bolts. The data acquisition program was stopped before the retightening process was started and it was reinitialized after retorquing the bolts to the desired load. The relaxation parameters were modeled according to a power curve fit to the data.
Bolt type tests are used to study possible effects of using tapered- head bolts versus protruding-head bolts on the stress relaxation of the connection. Pressure paper was used between the aluminum and composite plates, in the same manner as in the retightening tests. No retightening was applied for this series of tests. The load washers were placed at the end of the bolt, between two mounting washers, so that the load applied to the washer was uniform.
Elevated temperature tests were performed to study the influence of temperature on bolt clamp-up force. Non-post cured specimens were temperature cycled from room temperature to 62 °C to assess the affect of temperature variation on clamp-up load. The peak temperature of 62 °C was chosen in order to remain below the Tg of the material during cycling.
3.2. Instrumentation
Omega® Engineering LC900 compression load washers were used to monitor the bolt preload in the compression block and tapered- head single bolt tests. For the compression block test, 12.7- mm load washers, with a 133-kN load capacity, were used. For the bolt type tests, the 19-mm load washers, with a 289-kN load capacity, were used with the tapered bolts. The load washers were calibrated at 5 V bridge excitation using a BK Precision® Model 1651A, triple power supply. The internally gaged bolts used in the protruding-head single bolt tests were provided by A.L. Design, Inc., model numbers: ALD-BOLT-.500 X 200 LONG, ALD-BOLT-.7500 X 2.500 LONG, and ALD-BOLT-100 X 3.500 LONG. Three sizes of bolts were used for testing: 12.7, 19, 22 and 25.4 mm. These bolts have a load capacity of 41, 96, and 175 kN, respectively. A 10-V power supply was used, since this was the excitation used during calibration. The humidity was monitored using a Honeywell? HIH-3610 series sensor, operated at 5 V DC. The room temperature was monitored using an LM34CZ chip, manufactured by National Semiconductor. Fujifilm prescale pressure paper was used
to quantify the pressure distribution between plates.
The data acquisition process was PC-controlled using the DAQFI- D5 software, written at the University of Maine. Two IOTECHTM Daqboard 2000 cards were used for data-acquisition. This system has 16 bit analog-to-digital conversion resolution and is capable of reading 32 channels at a throughput rate of 1 kHz, which is more that adequate for the rate of testing used in this study.
Multiple samples of data were averaged during acquisition to reduce the error due to instrumentation noise. Bolt preload was applied using a BlackhawkTM torque wrench. The data acquisition program was set to take data according to the schedule given in Table 3. To begin the test procedure, an initial data point was recorded, which quantified the bias voltage at zero load. This voltage was used as the zero point for the load washers or load bolts. The starting voltage was input into the voltage-offset section of the data-acquisition program. The voltage bias was then subtracted from the output voltage recorded after loading. Hence, the unbiased voltage was determined and the actual bolt load was obtained. A single data point, indicating the starting load in each bolt, was logged into the data file, and the data acquisition program was initiated and left to record the data over a three-month period.
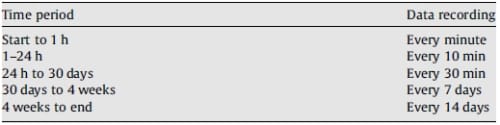
Table 3 – Data-acquisition recording schedule
3.3. Data analysis
The data analysis was performed by determining the constants in Eqs. (2), (4) and (5) using a least squares regression approach. The constants in Eq. (2) can be found by solving the expression for K1tn and taking the logarithm of each side. This result in Eq. 6 where n and K1 can be found from a linear regression analysis (see Fig. 4).

The constant α can be found in Eq. (4) using the above expression but forcing the intercept in the regression analysis, log[β], to zero such than β equals unity. Fig. 5 shows a sample case giving a comparison of the three equations. Eqs. (2) and (5) typically show a somewhat better fit to the data than does equation (4).
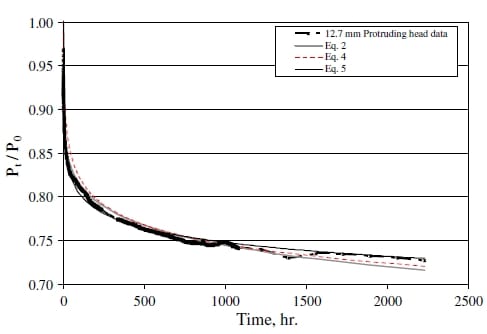
Fig. 4. Comparison of the use of various relaxation equations.
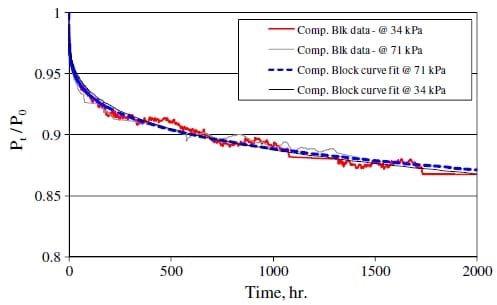
Fig. 5. Compression block tests.
4. Test results
4.1. Compression block test results
Fig. 5 shows the load history of the compression block test of two specimens preloaded to 184 and 89 kN. The clamp-up load is non-dimensionalized by dividing the load at time t, Pt, by the initial preload, P0. The actual initial preload on each the four bolts in the 184 kN test was 46.6, 45, 47.8 and 44.5 kN at an average pressure of 71 kPa. The actual preload one each bolt for the 89 kN test was 22.3, 22.3, 22.3 and 22.3 kN at an average pressure of 34 kPa. An average 13% reduction in the initial preload was observed for all bolts, over a period of approximately 2000 h. The percentage loss in the range tested is relatively insensitive to initial stress. Based on a power law fit to the curves, equations were developed for the load in each bolt of the compression block tests. Results of the various equation parameters are given in Table 4.
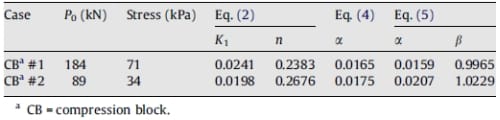
Table 4 – Values of relaxation coefficients for the compression block tests
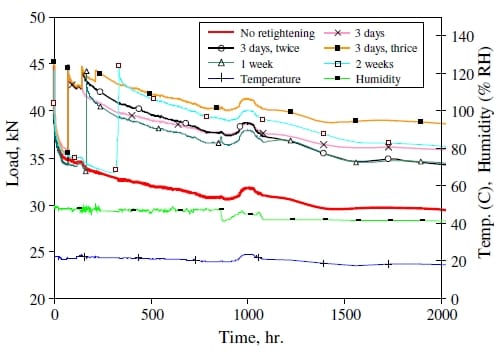
Fig. 6. Retightening study for 12.7-mm bolts, P0 = 22.25 kN.
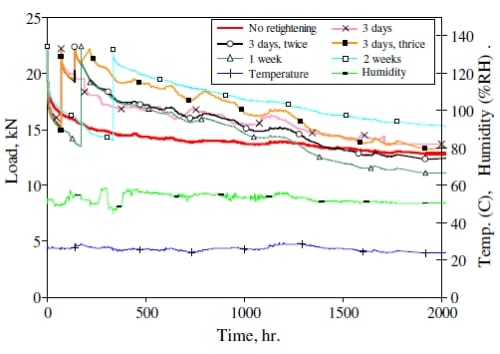
Fig. 7. Retightening study for 19.1-mm bolts, P0 = 45.5 kN.
4.2. Bolt retightneing test results
A summary of the results of the single bolt, retightening test specimens is shown in Figs. 6 and 7 for bolt diameters of 12.7 and 19.1 mm, respectively. These tests were run for a time period of approximately 90 days (2160 h). The specimen with a bolt diameter of 12.7 mm was preloaded to 22.25 kN while the 19.1-mm bolt diameter specimen was preloaded to 44.50 kN. The specimens were reloaded to their initial preloads according to the schedule presented in Table 1. Temperature and humidity histories are shown at the bottom of the graphs. The temperature data in Fig. 6 showed fluctuations of about 5–10 °C, at approximately 1000 h. Significant preload drops were observed when these temperature shifts occurred, for a time span of about 500 h. The specimen reloaded at one week showed a more rapid preload loss, while the specimen reloaded at two weeks maintained the largest preload. The most significant preload drops were observed during the 0–40 day (0–960 h) period. The effect of temperature shifts on the preload histories is also observed in Fig. 6, where a slight temperature increase produced a kink (load increase) in all the load history plots. This increase was more prominent for the specimens that were reloaded multiple times. After the temperature shift had ended, the loads returned to their expected value. Following this load increase, there was a steady loss in preload for the subsequent 20 days.
For the 19.1 mm specimens shown in Fig. 7 significant reduction in load loss is shown for all of the retightened specimens. The specimen reloaded every three days, thrice, maintained the largest preload, while the specimens reloaded at week one and every three days, twice, showed the largest preload loss. In a general sense, the specimens that had been reloaded showed a large dependence on room temperature changes, particularly under extended periods of time. It was observed that, even for small shifts in temperature, the preload in the connection specimens was altered. Retightening of the joint seemed to decrease the rate of stress relaxation and helped to maintain the initial preload. This conclusion warrants further study.
4.3. Bolt type tests results
The constants in Eqs.(2), (4) and (5) for various cases of different bolt configurations are summarized in Table 5. These are cases with no retorquing and nominal stress was computed using the area under the washer used for the tests. Fig. 8 shows a plot of the coefficient α in Eq. (4) versus the plate thickness; which is equal to the bolt diameter. There is a slight trend in the reduction of α with plate thickness. Although there is a high variability observed from test to test indicated by the trendline with an R2 value of 0.2. Fig. 9 shows a plot of the relaxation curves comparing the protruding-head to tapered bolts using Eq. (2). The protrudinghead bolts lie within the range of the tapered-head bolt results. The test results indicate no advantage to using tapered-head bolts over protruding-head bolts as far as clamp-up load is concerned.
Fig. 10 shows a plot of a in Eq. (4) versus the nominal stress level and includes data from Weerth and Ortloff [13] and Fox [18] as a comparison. For the range tested in this study a high variability and little correlation of this constant with stress is observed. The data from Weerth and Ortloff and Fox lie in the range of values observed in this study. This figure also shows that the compression block test where the composite is uniformly loaded has a significantly lower relaxation coefficient. This suggests that uniform loading may mitigate some of relaxation. On the other hand, the coefficient for the composite bolted to composite
specimen was significantly higher than all the others due to the composite material susceptibility to creep.
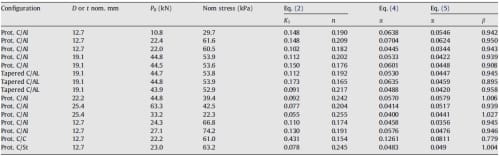
Table 5 – Values of relaxation coefficients the for single bolt tests
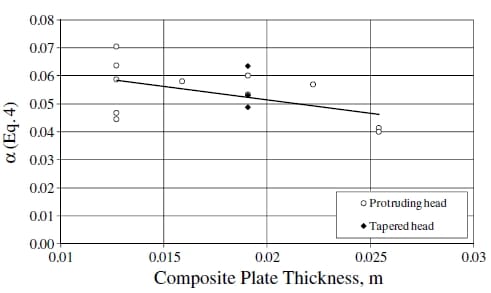
Fig. 8. Relaxation parameter a versus plate thickness.
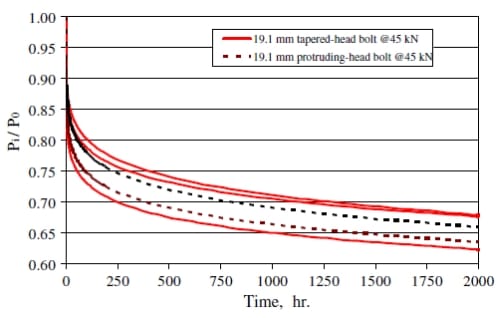
Fig. 9. Relaxation in tapered and protruding-head bolts.
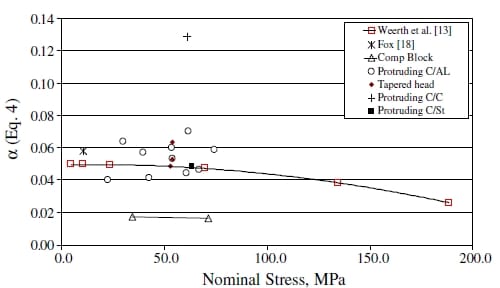
Fig. 10. Relaxation parameter α versus nominal stress.
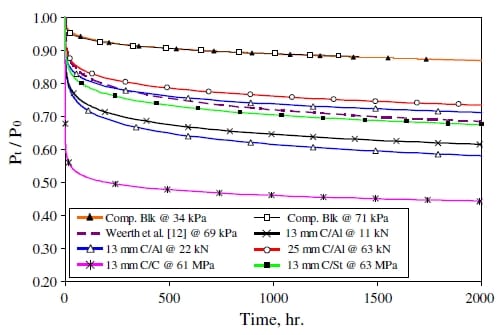
Fig. 11. Comparision of relaxation rates.
4.4. Pressure distribution
Pressure distribution through the connection may contribute to variation in the relaxation properties. Hence, pressure distributions were measured for several of the single-bolt specimens, during the bolt retightening tests. Since the pressure paper only showed the maximum pressure distribution in the connection it was not possible to observe changes in pressure distribution due to retightening of the bolts. Fig. 12 shows the pressure distribution contours for different test specimens. A pressure distribution color chart (Fig. 12d) was used to quantify the stress levels. Fig. 12a shows the pressure distribution contour between the composite and aluminum plates of a 25.4-mm, thick, specimen, preloaded to 66.72 kN. High stress values were observed around the bolt hole, while small pressure levels were observed at the aluminum/composite interface, which was attributed to the thickness of the composite plate. Fig. 12b shows the pressure distribution contour from a 19.1-mm, thick, test specimen, preloaded to 44.50 kN. With a 25% reduction in thickness, the contact pressure region can be clearly observed in this contour plot. Fig. 12c shows the pressure distribution contour of a 12.7-mm, thick, test specimen, preloaded to 22.25 kN. The contact pressure was observed to be more evenly distributed for this specimen. It was also noted that the pressure at the boundary of the hole reached the upper limit of the pressure paper.
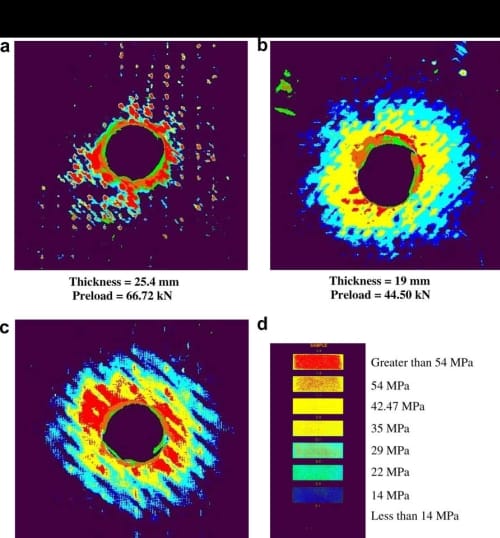
Fig. 12. Pressure distribution contours.
4.5. Temperature cycling
Temperature cycling effects are presented in Fig. 13 for various bolted joint cases including composite/aluminum (C/Al), composite/ steel (C/St), aluminum/aluminum (Al/Al) and composite/composite (C/C) connections. The connections were initially torqued and then allowed to relax for approximately 650 h. The C/C specimen showed significantly more load loss than the other specimens. The first temperature cycle was performed to approximately 62 °C. The relaxation curve was lost for this cycle due to a data acquisition malfunction. Although the load loss curve was not recorded, it is noted that a significant amount of preload was lost due to this temperature cycle on all but the Al/Al connection. The next temperature cycle showed a significant drop in load level achieved followed by the load level reaching a stable value in subsequent cycles. Load increase is observed at the end of the test corresponding to an increase in relative humidity levels.
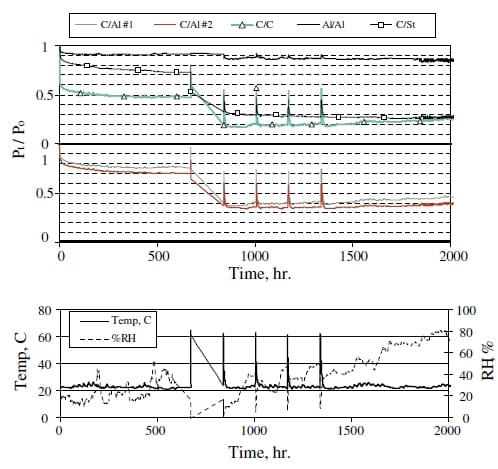
Fig. 13. Influence of temperature cycling.
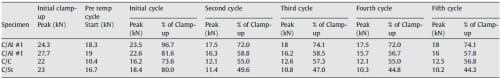
Table 6 – Clamp-up load per temperature cycle
Table 6 provides a comparison of the peak load achieved in each temperature cycle. The initial clamp-up load, and the load at the start of the temperature cycling is given along with the peak load recorded during each temperature cycle. The initial cycle resulted in a load that was greater than the initial load at the start of the cycle. The second cycle saw a significant reduction in this load level. After the second cycle the load achieved by the temperature cycling leveled out and the percent of initial clamp-up load remained relatively constant.
5. Conclusions
Clamp-up load loss in hybrid composite-to-metal bolted connections is significant and highly variable. Causes of the variability include differences in material properties typical of composites, geometry changes, surface finish, workmanship and other effects. Loss of bolt-clamp-up load may influence the strength and fatigue life of the connection and is warrant of further study. The results of the present study showed that after 2000 h of relaxation response clamp-up load loss varied from 13% for a uniformly loaded compression block specimen to 55% for the bolted composite specimens. Relaxation was influenced predominantly by the viscoelastic creep response of the composite material and is affected by temperature, moisture and stress distribution.
A study on the effects of bolt retightening demonstrated that there is potentially some benefit to retightening the bolts subsequent to the initial clamp-up. Tests on a 19.1-mm connection showed a significant increase in final clamp-up load and a single retorquing was sufficient. Tests on the 12.7-mm connection were not as clear. However the specimen that was not reloaded in this case showed significantly less primary load loss than all but the specimen retightened at week two. A study of tapered-head bolts showed that for practical purposes the response of tapered-head bolts was nearly the same as protruding-head bolts. Accordingly, from this limited study there is no significant benefit or detriment to the use of tapered-head bolts with regard to clamp-up load loss.
The most significant factor in load loss due to thermal effects is the amount of post cure of the specimens. It is recommended that post curing be performed at a temperature above the intended use temperature. The initial cycle of a non-post cured specimen showed a significant drop in clamp-up load, while subsequent temperature cycles showed little change in the final clamp-up load. The composite was essentially post cured by this initial cycle. Significant thermal response was also observed in this test due to the coefficient of thermal expansion mismatch of the materials. The CTE of the composite was measured by DMA to be about four times that of the steel bolts and twice that of the aluminum plates. It is noted that conclusions are based on limited experimental data and further experimental studies are recommended.
Acknowledgements
The authors gratefully acknowledge funding for this project through the Office of Naval Research under grants number N00014-01-1-0916 and N00014-05-1-0735. Dr. Roshdy G. S. Barsoum of ONR is the cognizant program officer. Guidance provided by Drs. Milt Critchfield, Loc Nyugen and Gene Camponeschi of NSWC-Carderock is gratefully acknowledged.
References
- Barsoum RGS. Best of both worlds: hybrid ship hulls use composites and steel. AMPTIAC 2003;7-3:52–61.
- Alm F. GRP versus steel in ship construction. Naval Forces 1983;5:82–6.
- Kabche JP, Caccese V, Berube KA, Thompson L, Walls J. Compos Struct 2002;78:207–21.
- Sun HT, Chang FK, Qing X. The response of composite joints with bolt-clamping loads, part II: model verification. J Compos Mater 2002;36(1):69–92.
- Starikov R, Schon J. Experimental study on fatigue resistance of composite joints with protruding-head bolts. Compos Struct 2002;55(1):1–11.
- Findley WN, Jam
es LS, Onaran K. Creep and relaxation of nonlinear viscoelastic materials. New York: Dover Publications, Inc.; 1976. - Raghavan J, Meshii M. Creep of polymer composites. Compos Sci Technol 1997;57:1673–88.
- Shen W, Smith SM, Ye H, Jones F, Jacobs PB. Real time observation of viscoelastic creep of a polymer coating by scanning probe microscope. Tribol Lett 1998;5:75–9.
- Kim W, Sun CT. Modeling relaxation of a polymeric composite during loading and unloading. J Compos Mater 2002(36-6):745–55.
- Kim KT, McMeeking RM. Power law creep with interface slip and diffusion in a composite material. Mech Mater 1995;20:153–64.
- Maksimov RD, Plume E. Long-term creep of hybrid aramid/glass fiber reinforced plastics. Mech Compos Mater 2001;37(4):271–80.
- Scott DW, Zureich A. Compression creep of a pultruded E-glass/vinyl ester composite. Compos Sci Technol 1998;57:1361–9.
- Weerth DE, Ortloff CR. Creep considerations in reinforced plastic laminate bolted connections. In: Army symposium on solid mechanics; October 1986. p. 137–54.
- Pang F, Wang CH. Activation theory for creep of woven composites. Composites: Part B 1999;30:613–20.
- Chen HS, Kung HK. A hygrothermal sensitivity evaluation on the clamp torque of bolted composite joint. In: 17th Annual technical conference of the American society for composites; October 2002.
- Guedes RM, Morais JJL, Marques AT, Cardon AH. Prediction of long-term behavior of composite materials. Comput Struct 2000;76:183–94.
- Shivakumar KN, Crews JH. Bolt clamp-up relaxation in a graphite/epoxy laminate. NASA TM-83268, Langley Research Center; 1982. 30 pp.
- Fox DM. Bolted joint studies in GRP. Massachusetts Institute of Technology thesis; 1984. 124 pp.
- Pelletier K, Caccese V, Berube KA. Influence of stress relaxation in hybrid composite metal connections. Report No. UM-MACH-RPT-01-02. Department of Mechanical Engineering, University of Maine; January 2005. 87 pp.
![]()