Lapo F. Mori, Neil Krishnan, Jian Cao, Horacio D. Espinosa¹
e-mail: [email protected]
Department of Mechanical Engineering, Northwestern University, Evanston, IL 60208
Contributed by the Manufacturing Science Division of ASME for publication in the JOURNAL OF MANUFACTURING SCIENCE AND ENGINEERING. Manuscript received August 9, 2006; final manuscript received March 20, 2007. Review conducted by Steven R. Schmid.
Abstract
In this paper, the results of experiments conducted to investigate the friction coefficient existing at a brass-steel interface are presented. The research discussed here is the second of a two-part study on the size effects in friction conditions that exist during microextrusion. In the regime of dimensions of the order of a few hundred microns, these size effects tend to play a significant role in affecting the characteristics of microforming processes. Experimental results presented in the previous companion paper have already shown that the friction conditions obtained from comparisons of experimental results and numerical models show a size effect related to the overall dimensions of the extruded part, assuming material response is homogeneous. Another interesting observation was made when extrusion experiments were performed to produce submillimeter sized pins. It was noted that pins fabricated from large grain-size material (211 μm) showed a tendency to curve, whereas those fabricated from billets having a small grain size (32 μm), did not show this tendency. In order to further investigate these phenomena, it was necessary to segregate the individual influences of material response and interfacial behavior on the microextrusion process, and therefore, a series of frictional experiments was conducted using a stored-energy Kolsky bar. The advantage of the Kolsky bar method is that it provides a direct measurement of the existing interfacial conditions and does not depend on material deformation behavior like other methods to measure friction. The method also provides both static and dynamic coefficients of friction, and these values could prove relevant for microextrusion tests performed at high strain rates. Tests were conducted using brass samples of a small grain size (32 μm) and a large grain size (211 μm) at low contact pressure (22 MPa) and high contact pressure (250 MPa) to see whether there was any change in the friction conditions due to these parameters. Another parameter that was varied was the area of contact. Static and dynamic coefficients of friction are reported for all the cases. The main conclusion of these experiments was that the friction coefficient did not show any significant dependence on the material grain size, interface pressure, or area of contact. [DOI: 10.1115/1.2738131]
1 Introduction
In recent years, the trend toward miniaturization of products and devices in industries, such as electronics, optics, medical devices, communications, etc., has continued unabated and created a need for metallic parts manufactured at an extremely small scale. Such parts that have at least two characteristic dimensions on the order of 1 mm are known as metallic microparts, and they encompass a wide variety of geometries, materials, functionalities, and production processes. Microextrusion has recently emerged as one such feasible manufacturing process to fabricate metallic micropins. At this length scale, the deformation of the workpiece is dominated by the so-called size effects, e.g., material properties and frictional behavior vary at small length scales. In recent extrusion experiments performed to produce submillimeter-sized pins having a base diameter of 0.76 mm and an extruded diameter of 0.57 mm, certain interesting deformation characteristics were observed. Kinsey et al. [1], Krishnan et al. [2] showed that, when a workpiece with a relatively large grain size of 211 μm was used, the billet tended to deform inhomogenously, and the extruded pins showed a tendency to curve (see Fig. 1). This phenomenon was not seen when workpieces with a smaller grain size of 32 μm were used. The curving tendency was seen to happen in ~60% of the samples tested, and the direction of curvature was random with no preferential bias. When investigating the causes of this behavior, the two plausible reasons were identified as (1) differences in material response and (2) differences in the frictional behavior. However, results observed during microextrusion show the combined effect of microstructure and interfacial contact, and in order to separate these two influences, a separate set of frictional experiments are to be conducted using a stored-energy Kolsky bar in this part of the paper. The advantage of this approach lies in the fact that the results are obtained as a direct measurement of stresses and no information about the material response is required, unlike other friction tests, such as ring compression. Another advantage of this method is the fact that the test provides both static and dynamic coefficients of friction at high interface velocities, akin to those that exist in metal cutting and forming operations.
![Fig. 1 Samples of pins extruded using the 0.76:0.57 mm die and work pieces having a grain size of 32 μm and 211 μm (modified from [2]) Fig. 1 Samples of pins extruded using the 0.76:0.57 mm die and work pieces having a grain size of 32 μm and 211 μm (modified from [2])](https://www.sensorprod.com/wp-content/uploads/2023/09/image01-9.jpg)
Fig. 1 Samples of pins extruded using the 0.76:0.57 mm die and work pieces having a grain size of 32 μm and 211 μm (modified from [2])
Several researchers have investigated the interfacial behavior that exists for brass as one of the contacting surfaces. Wang et al. [3] investigated the dry dynamic friction coefficients that exist under sheet-forming conditions by using a Bending-Under- Tension (BUT) test. One of the material pairs investigated was CuZn30 brass in contact with A2 steel having an average surface roughness of 0.2 μm. The authors reported dynamic friction coefficients for this particular contact pair between 0.26 and 0.32 for a punch speed of 200 mm/ s. Davim [4] conducted pin-on-disk dry friction tests to study the tribological behavior of the brasssteel pair. The sliding velocity was varied in the range from 0.1 m/ s to 1 m/ s, while the contact pressure was changed from 1MPa to 10 MPa. The tests were performed using CuZn30 brass and Ck-45 (1045) steel. The dynamic friction coefficients obtained were found to lie in the range of 0.18–0.28. Kim and Hwang [5] performed pin-on-disk dry friction tests to investigate the effect of mac
hining condition on the sliding behavior of metals. One of the samples investigated was CuZn40 brass having an average surface roughness in the range of 0.2–0.4 μm, in contact with STB2 steel having a surface roughness of 0.15 μm. The contact pressure was kept constant at 150 kPa, and the sliding velocity was in the range of 0.3–0.5 m/ s. The authors obtained a value of 0.25 for the dynamic friction coefficient. Ogawa [6] conducted impact dry friction tests using a modified split-Hopkinson bar to measure the dynamic friction coefficient for a brass-brass contact pair, where the mating surfaces had an average surface roughness of 70 nm. The effect of sliding velocities up to 5 m/ s and contact pressures up to 100 MPa were investigated. The dynamic friction coefficient was found to lie in the range of 0.2–0.3. The value was seen to be almost constant, independent of sliding velocity, and normal pressure. Sofuoglo et al. [7] used the ring compression test to determine the dry friction coefficients for various material pairs. One of the pairs investigated was that of brass on steel. The test velocity was ~5.1 mm/min and finite element method (FEM) simulations and experiments were compared to obtain an estimate of the friction coefficient. The reported friction values for brass were found to be from 0.12 to 0.2. Blau [8] analyzed the pair CuZn40 on steel and obtained a dry dynamic friction coefficient of 0.24.
As evidenced by the cited references, several researchers have investigated the friction coefficients of brass in contact with steel under a variety of conditions and parameters. Sliding velocity, surface roughness, contact pressure, and mating materials all have an important role to play in the interfacial behavior and, consequently, the deduced friction coefficient. However, except for the low-speed tests by Sofuoglu et al. [7], most of the reported dynamic friction coefficient values are seen to range from 0.18 to 0.32.
The key contribution of this research endeavor is the fact that it attempts to investigate the relationship between material grain size and friction coefficient by performing tests that are based on direct measures of strain, rather than standard tests, such as ring compression, which involve the influence of material response. Very few researchers have made an effort to address this problem. Geiger et al. [9] studied the effect of grain size on friction using ring compression tests and reported that an increase in grain size produced an increase in the value of the friction coefficient and also led to an increase in the scatter of the friction experiments. However, the authors did not elaborate on how they accounted for the variation of material response with varying grain size. The use of the stored-energy Kolsky bar method precludes the material response from being a factor in the friction measurements, and therefore, a more decoupled result is obtained.
In this paper, we present the experimental configuration of a modified Kolsky bar apparatus, appropriate for dynamic friction investigation at sliding velocities below 7 m/ s. Then the experimental method is shown, focusing on the sample preparation and the data analysis, followed by results and discussions. Finally, discussion on the friction coefficient results obtained from this pure friction test and those estimated from microextrusion tests presented in our companion paper will be presented.
2 Methods
2.1 Sample Geometry
Each friction pair is composed of a CuZn30 brass disk and a cup-shaped 1018 steel piece. The interface of contact is a small annular region corresponding to the rim of the steel cup. All the experiment use brass disks with the same geometry (see Fig. 2); to ensure that the contact is established well away from the edge of the disk, the diameter of the brass disks is 31.75 mm.
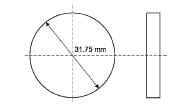
Fig. 2 Drawing of the CuZn30 brass disk
In order to investigate the specimen size effect on the friction phenomena, steel cups with two different contact areas were used (see Fig. 3 for drawing and Fig. 4 for pictures of physical samples): one case has a nominal contact area of 75.40 mm² (Fig. 4(a)) and the other of 13.35 mm² (Fig. 4(b)).
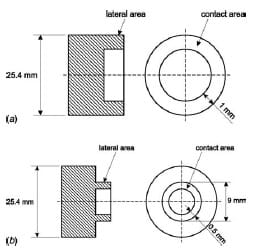
Fig. 3 Drawing of the cup-shaped 1018 steel piece for (a) the case of large contact area and (b) the case of small contact area
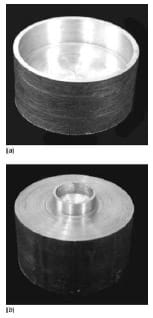
Fig. 4 AISI 1018 cold-drawn steel cup after lapping and polishing: (a) reports the large contact area cup (nominally 75.40 mm²) and (b) the small contact area cup (nominally 13.35 mm²)
2.2 Sample Preparation
In order to investigate the grain size effect, experiments were performed with brass samples having two different grain sizes: the set of specimen with small grain size has an average grain size of 32 μm (obtained by heat treatment at 550°C for 1 h and then cooled in firm air at 25°C), whereas the other set has an average grain size of 211 μm (obtained by heat treatment at 700°C for 1 hr and then cooled in firm air at 25°C).
Both steel and brass samples were machined and grounded to ensure that the plane contact surfaces are parallel to each other and perpendicular to the axis of the test specimens. In order to further control planarity and surface roughness, both surfaces of the steel ring and the brass disk were lapped on a Lapmaster floor standing lapping machine for 5 min with a silicon carbide powder of 12.5 μm grain size. Then, the surfaces were further smoothed on a polishing table to achieve a surface roughness Ra of ~310 nm for steel and brass samples.
The CuZn30 brass yield stress (~58 MPa) is lower than the contact pressure used in the high-pressure friction test (~240 MPa). To prevent any indention of the steel cups into the brass disks during the actual friction tests, these samples were preindented in the region of contact (see Fig. 5). The indentation area is larger than the contact area in order to prevent the lateral surface of the cup to touch the lateral surface of the intent disk during the test; in this way, the actual contact area can be easily measured (see Fig. 3). After cleaning the surfaces with water, acetone, and ethanol, the samples were labeled and scanned on a phase-shift white-light interferometer.
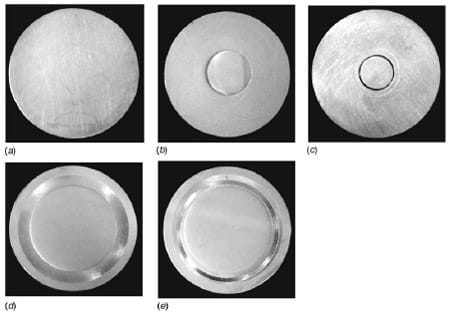
Fig. 5 CuZn30 brass disk after lapping and polishing: (a) reports the disk without indent, (b) the disk with the small area indent, (c) the disk with the small area indent after the test, (d) the disk with a large area indent, and (e) the disk with a large area indent after the test. The pictures taken after the test clearly show that the contact area (brighter ring) is inside the indent.
The steel cup pieces were measured with a digital caliber in order to have an accurate measurement of the contact area, which is crucial in the determination of the friction coefficient. The specimens were glued on the split-Hopkinson torsional bar with a thin layer of Hardman quick setting epoxy; since the alignment between the bars and the specimens is a crucial factor in this experiment, a clamp was designed ad hoc to hold the specimen during the glue hardening. Another critical aspect of the test is the uniformity of the pressure on the contact area; a nonintrusive method is necessary in order to avoid altering the surface characteristics and also to avoid adding contaminant elements to the surfaces in contact. To assess it, Fuji Prescale medium pressure² sensitivity film was used before every test. An example of the pattern obtained with this film is shown in Fig. 6; the shaded ring represents the contact area and the color density changes according to the pressure level; the color density reported is constant and attests that the pressure was uniform all over the contact area. No lubricant was applied to the mating surfaces.
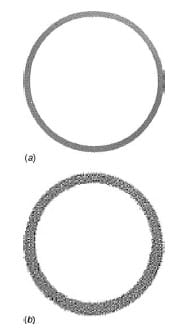
Fig. 6 Typical pattern generated by pressure-sensitivite film placed between
the ring and the disk of the friction pair; (a) represents a large contact area pair (nominally 75.40 mm²) and (b) a small contact area pair (nominally 13.35 mm²). Both images show a uniform shaded area, which corresponds to uniform pressure on the contact area.
2.3 Dynamic Friction Apparatus
The technique used to measure the dynamic friction in this research has been developed by Espinosa et al. [10] and has already been successfully used [11,12]. A slightly different technique was also developed by Rajagopalan and Prakash [13].
The scheme of the stored-energy Kolsky bar used for the dynamic friction analysis is shown in Fig. 7. It is composed of 25.4 mm 7075-T6 aluminum alloy bars; the incident bar is 2.3 m long and the so-called transmission bar is 1.9 m long. Each bar is supported by a series of recirculating ball fixed-alignment bearings (INA KBZI6PP) that minimize the friction resistance on the supports and allow the bar to rotate and translate freely in both directions. The compression/tension and shear loading are produced by hydraulic actuators: an axial hydraulic double-acting actuator (Enerpac RD 166) applies a compressive or tensile load at one end of the incident bar, and a hydraulic rotary actuator (Flo-Tork 15000-180-AICB-ST-MS2-RKH-N) located along the incident bar applies the torque.
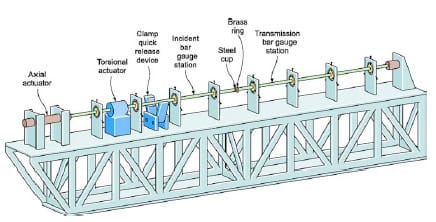
Fig. 7 Scheme of the stored-energy Kolsky bar used for the dynamic friction analysis
The sudden release of the stored energy is achieved using a clamp positioned between the rotary actuator and the specimen; it is able to hold the desired torque force, without slippage, and release the stored energy rapidly enough to produce a sharpfronted stress pulse traveling toward the specimen. This aspect can be directly verified by the quick rise in the incident wave recorded by the oscilloscope (see Fig. 8).
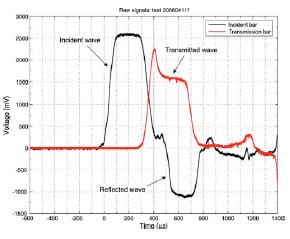
Fig. 8 Typical signal from the Wheatstone bridges on the incident and on the transmission bar recorded by the oscilloscope. The incident, reflected, and transmitted waves are highlighted by arrows.
The axial load is applied before gripping the clamp and the friction phenomenon is studied under quasi-static pressure conditions. On release of the clamp, a torsional pulse, with a constant amplitude equal to one-half of the stored torque, propagates down the bar toward the specimen. Simultaneously, an unloading pulse of equal magnitude propagates from the clamp toward the rotary and axial actuators.
As the pulse travels down the bar, it is detected by two straingage stations: one on the incident bar and the other on the transmission bar. Each station consists in a full Wheatstone bridge of four strain-gages of 350 Ω (MM EA-13-250BF-350); the strain gages are located at 45 deg with respect to the longitudinal axis of the bar and separated by 90 deg in the radial direction one from the other, in order to measure the torque independently of any other potential loading on the bar (i.e., bending or tension/ compression). Two other stations are used to measure the stored static torque and axial compression. A Tektronix TDS520C oscilloscope was used to record the signal output from the two Wheatstone bridges. Further information on the concepts behind the design of this apparatus can be found in [10,11].
The friction coefficient μ is computed as
μ = τσ / σn
where τσ and σn are, respectively, the shear stress and the normal stress in the contact area. The normal stress in the contact area σn, which is applied on the specimen by means of the axial hydraulic actuator, is determined by
σn = Ni / Ac
where Ac is the contact area and Ni is the static load measured by the strain-gage station located before the clamp. The shear stress is computed by means of elastic wave propagation theory; the shear stress averaged over the contact area τs can be expressed by

The shear frictional stress in the contact area of the sample τs
is given by
τs = TTr / Jps
where Jps is the contact area polar moment of inertia, TT is the transmitted torque, and r is the centerline radius. More details can be found in [10]. Based on these formulas, a MATLAB³ program was developed to process automatically the experimental data recorded by the oscilloscope.
2.4 Surface Analysis
The surface of the specimens were analyzed with an ADE MICROXAM phase-shift white-light interferometer. The analyses were conducted after the lapping, after the indentation, and after the dynamic friction test. At every stage, the surface was scanned in at least four locations and then the surface roughness properties were obtained as an average of all the readings (see Table 1).
On the samples with a large contact area, a surface of 864 μm by 642 μm was scanned, whereas on those with a small contact area, a surface of 432 μm by 321 μm was scanned.4 Each scan produced a three-dimensional profile (see, e.g., Figs. 9 and 10) from which the surface roughness statistical parameters, i.e., Ra and Rq, were numerically computed;5 these parameters are reported in Table 1.
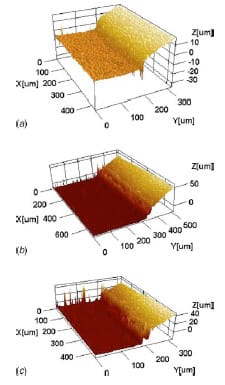
Fig. 9 Indent heights hi caused by pretest compression at a pressure of 150 MPa. The mapped surface for the different high-pressure tests is reported: (a) 32 μm grain size, large contact area, hi≈10 μm, (b) 211 μm grain size, large contact area, hi≈20 μm, and (c) 211 μm grain size, small contact area, hi≈30 μm.
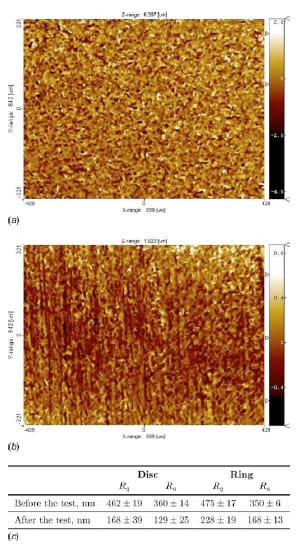
Fig. 10 Surface profiles of the brass sample and surface roughness values for the brass and steel samples before (a) and after (b),the friction test for the 32 μm grain size brass at low pressure. In (c) the average values and the standard deviation of the mean of the surface roughness are reported for each case.

Table 1 Experiment setup and results for all the tests conducted. For each type of test, three experiments were done and in the table are reported the average valuesa
2.5 Experimental Procedure The specimens are put in contact and then a static axial load is applied with the axial load actuator while the clamp is still open. In this way, the surfaces of the pair of materials to be tested are prestressed with a known pressure. Then the clamp is closed and the torque stored in the incident bar. The stored torsional energy is released by breaking the clamp pin and then the signals from the Wheatstone bridges are recorded with the oscilloscope; the incident pulse signal raise ramp is used to trigger the recording. A typical recording is reported in Fig. 8.
3 Results
The graph of the friction coefficient μ as a function of time t for different axial pressures, brass grain sizes, and contact areas is reported in Fig. 11(a)–11(e). The results represent the friction coefficients calculated based on the torsional pulse measured in the transmission bar. The initial peak of the pulse gives a static coefficient of friction (μs). Once a uniform sliding interfacial velocity is reached, the pulse gives the dynamic coefficient of friction (μk). The experiment setup and results for all the tests conducted are reported in Table 1.
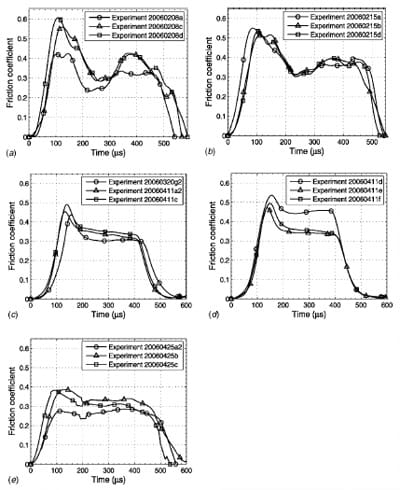
Fig. 11 Graph of the friction coefficient μ as a function of time t for different axial pressures, brass grain sizes, and contact areas: (a) low-pressure (22 MPa), 32 μm grain-size, large area, (b) low-pressure (22 MPa), 211 μm grain-size, large area, (c) high-pressure (245 MPa), 32μm grain-size, large area, (d) high-pressure (251 MPa), 211 μm grain-size, large area, and (e) high-pressure (291 MPa), 211 μm grain-size, small area
Two types of hypothesis tests have been conducted to investigate the dependence of the friction coefficient on grain size, pressure and specimen size: the Wilcoxon rank sum test and the Student’s t-test. The nonparametric Wilcoxon two-sided rank sum test [15] was used to tests if the independent samples came from identical continuous distributions with equal medians, against the alternative that they do not have equal medians. The unpaired6 twosided Student’s t-test [16] was used to test if the independent samples came from normal distributions with equal means and unknown variances, against the alternative that the means are not equal; this is the classical Behrens-Fisher problem [17,18]. Both tests were performed with a significance level of 1%.
The experiment
al data used for each analysis are reported in box plots [19]. The tops and bottoms of each box are the twenty-fifth and seventy-fifth percentiles of the samples, respectively; the line in the middle of each box is the sample median. The whiskers are drawn from the ends of the interquartile ranges to the furthest observations within the whisker length. Observations beyond the whisker length (1.5 times the interquartile range) are marked as outliers; the notches display the variability of the median between samples (the width of a notch is computed so that box plots whose notches do not overlap have different medians at the 5% significance level). Table 2 reports the average coefficients of friction for each subset of experiments.

Table 2 Average values of the friction coefficients for each subset of experiment considered for the hypothesis tests
3.1 Effect of Grain Size
The static coefficient of friction has an average value of μs=0.50 for small grain size (32 μm) and μs=0.52 for large grain size (211 μm); see Fig. 12(a). Both the Wilcoxon rank sum test and the Student’s t-test failed to reject the null hypothesis at the 1% significance level with respective p-values of pw=50.9% and pt=53.5%. The dynamic coefficient of friction has an average value of μd=0.31 for small grain size and μd=0.35 for large grain size; see Fig. 12(b). Both the Wilcoxon rank sum test and the Student’s t-test failed to reject the null hypothesis at the 1% significance level with respective p-values of pw=11.3% and pt=11.9%. Therefore, there is no statistically significant effect of the grain size on both the static and the dynamic friction coefficients.
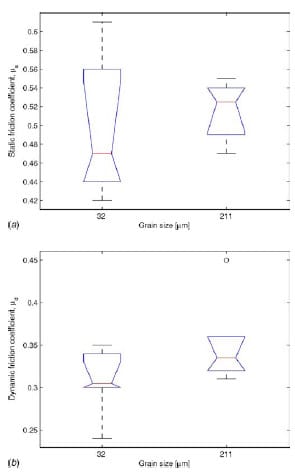
Fig. 12 Box plots representing the effect of grain size on the friction coefficients: (a) static coefficient of friction and (b) dynamic coefficient of friction
3.2 Effect of Contact Pressure
The static coefficient of friction has an average value of μs=0.53 for low contact pressure (22 MPa) and μs=0.48 for high contact pressure (248 MPa); see Fig. 13(a). Both the Wilcoxon rank sum test and the Student’s t-test failed to reject the null hypothesis at the 1% significance level with a p-value of pw=pt=11.9%. The dynamic coefficient of friction has an average value of μd=0.30 for low contact pressure and μd=0.36 for high contact pressure; see Fig. 13(b). In this case, both the Wilcoxon rank sum test and the Student’s t-test rejected the null hypothesis at the 1% significance level with respective p-values of pw=1.3% and pt=3.5%. Therefore, there is no statistically significant effect of the contact pressure on both the static and the dynamic friction coefficients.
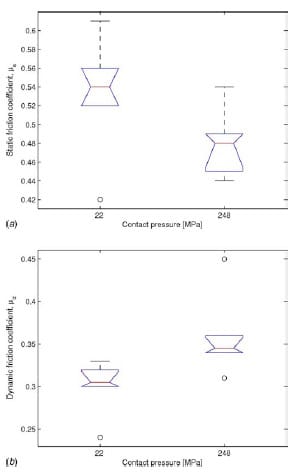
Fig. 13 Box plots representing the effect of contact pressure on the friction coefficients: (a) static coefficient of friction and (b) dynamic coefficient of friction
3.3 Effect of Specimen Size
In order to ensure that the pretest compression of the samples prevents indentation of the steel into the brass during the actual test, the depth of indentation was measured using the phase-shift white-light interferometer after pretest compression and after the actual test. Figure 9 shows the indent height caused by the pretest compression at a pressure of 150 MPa for all the samples being tested at high pressure. The indent height for the 32 μm grain size material was measured to be ~30 μm and that of the 211 μm grain size material was measured to be ~50 μm. As the material is compressed, the brass deforms with a curvature; this aspect is significant because the curvature ensures that during the test only a small region of the brass is in contact with the mating steel sample. If on the contrary the lateral contact area was larger then it should have been considered in the computation of the friction coefficient. Figure 14 shows the indents produced during the actual friction tests. These indents are produced because the actual test pressure is ~250 MPa, which is higher than the pressure used for pretest compression. The indent in the 32 μm grain size material is ~10 μm deep and the depth of the indent for the 211 μm grain size material is ~20 μm. For the small area tests, the normal pressure is ~290 MPa, and therefore, the indent depth is around 30–50 μm. The small depth of these indents ensures that the additional contact area created due to the indentation of the brass samples by the steel is extremely small and can be considered negligible with respect to the original annular contact area.
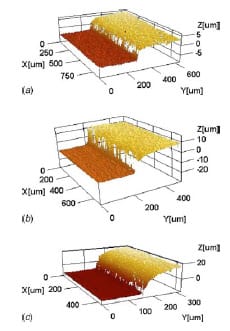
Fig. 14 Indent heights hi caused by the friction test after pretest compression. The mapped surface for the different highpressure tests is reported: (a) 32 μm grain size, large contact area, hi≈30 μm, (b) 211 μm grain size, large contact area, hi ≈ 50 μm, and (c) 211 μm grain size, small contact area, hi ≈50 μm.
The static coefficient of friction has an average value of μs=0.35 for small contact area (14 mm²) and μs=0.51 for large contact area (76 mm²); see Fig. 15. In this case the Wilcoxon rank sum test rejected the null hypothesis at the 1% significance level with a p-value of pw=0.4% while the Student’s t-test failed to reject the null hypothesis at the 1% significance level with a p-value of pt=2.2%. The dynamic coefficient of friction has an average value of μd=0.30 for small con
tact area and μd=0.33 for large contact area; see Fig. 15(b). Both the Wilcoxon rank sum test and the Student’s t-test failed to reject the null hypothesis at the 1% significance level with p-values of pw=39.6% and =pt=30.5%. Therefore, there is no statistically significant effect of the specimen size on the dynamic friction coefficient while for the static friction coefficient the p-values are so close to the significance level that the two tests give different results and it is not possible to reject the null hypothesis. In order to understand this behavior, the surface of these specimen was analyzed (Sec. 3.4).
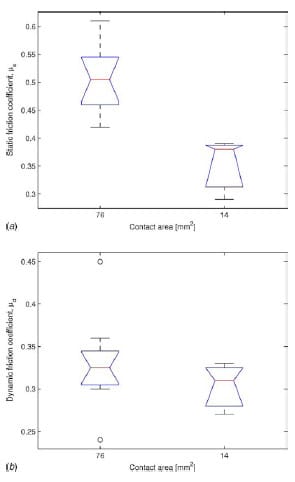
Fig. 15 Box plots representing the effect of contact area on the friction coefficients: (a) static coefficient of friction and (b) dynamic coefficient of friction
3.4 Surface Analysis
In order to study the brass samples before and after the tests, they are mapped using a surfacemapping microscope and the contour plots for the surface are shown in Figs. 10 and 16–19 for the various tests. The values of surface roughness before and after the tests are also shown. It can be seen that for all tests, the surface roughness of both the brass and steel samples tends to fall. A pattern of scratches in the direction of motion is also visible on the brass samples after the tests.
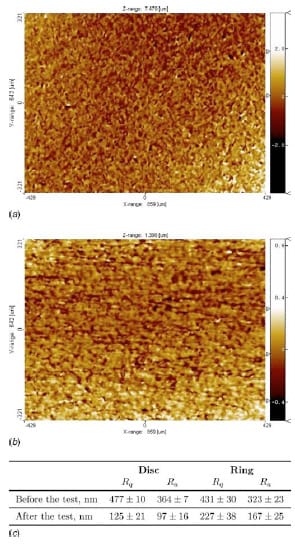
Fig. 16 Surface profiles of the brass sample and surface roughness values for the brass and steel samples before (a) and after (b) the friction test for the 211 μm grain size brass at low pressure. In (c), the average values and the standard deviation of the mean of the surface roughness are reported for each case.

Fig. 17 Surface profiles of the brass sample and surface roughness values for the brass and steel samples before (a) and after (b) the friction test for the 32 μm grain size brass at high pressure. In (c), the average values and the standard deviation of the mean of the surface roughness are reported for each case.

Fig. 18 Surface profiles of the brass sample and surface roughness values for the brass and steel samples before (a) and after (b) the friction test for the 211 μm grain size brass at high pressure. In (c), the average values and the standard deviation of the mean of the surface roughness are reported for each case.

Fig. 19 Surface profiles of the brass sample and surface roughness values for the brass and steel samples before (a) and after (b) the friction test for the small contact area 211 μm grain size brass at high pressure. In (c), the average values and the standard deviation of the mean of the surface roughness are reported for each case.
For the small area friction tests, an interesting phenomenon was noted when mapping the surface of the brass specimen after the test. Figure 20 shows the surface plots for two different locations on the brass sample. The surface appearance of the first location is similar to that of the previous tests, where a scratch pattern can be seen in the direction of motion. However, in the second location, the pattern is distinctly different. A distinct scratch pattern cannot be seen, and the surface appears to be much smoother than the first location. The appearance is not due to a lack of contact because the pattern is distinctly different from the surface before the test is conducted. In order to investigate this trend further, the brass sample was mapped at eight locations as shown in Fig. 21(a). The surface plots along with the surface roughness values are shown in Fig. 21(b)–21(i). Location 2 (Fig. 21(c)) and location 8 (Fig. 21(i)) show a lower surface roughness than other locations and also have a pattern that is distinctly different. Such a difference in surface patterns was not noted in friction samples having a larger area of contact. A possible explanation of this phenomenon is given by De Gee and Zaat [20]. They conducted dry sliding wear tests of clean 60-40 brass versus steel and noted that, when zinc oxide is present on the brass surface, this oxide does not lubricate as well as other brass oxides (i.e., CuO) and there is a large area of adhesion. They called this adhesive wear phenomenon “continuous film.”

Fig. 20 Surface profiles of the brass sample showing two distinctly different patterns at two locations after the friction test for the small contact area 211 μm grain size brass at high pressure: (a) profile after the test at location 1 and (b) profile after the test at location 2

Fig. 21 Surface profiles at eight different locations of the small contact area brass specimen after the high-pressure friction test: (a) shows the locations in which the surface is scanned and (b)–(i) represent an area of 430 μm by 320 μm. (b) Location 1, (c) Location 2, (d) Location 3, (e) Location 4, (f) Location 5, (g) Location 6, (h) Location 7, (i) Location 8.
Another difference noted between the large and small area specimens is shown in Fig. 22. Certain locations on the small area specimen show large amounts of surface damage where deep gouges of material appear to have been removed. This phenomenon is not observed in the friction tests where the contact area is larger. The damage is probably due to the adhesive wear process that De Gee and Zaat [20] called “local adherence” of brass to steel. They observed that the combination of the CuO oxide film present on the brass with the iron oxide lubricates well except at some isolated points where the brass transfers to steel. Lancaster [21] studied these two phenomena and was able to identify the transition between local or mild wear (local adherence of brass to steel) and global or severe wear (continuous film) to experimental parameters, such as sliding velocity,7 applied load, and ambient temperature [22].

Fig. 22 Surface profiles of the small contact area brass specimen after the high-pressure friction test. The images show regions where material appears to have been gouged out leading to excessive surface damage.
4 Discussion
The extrusion experiments are influenced by both the material response and the friction conditions, and the need to segregate these two influences necessitates testing using a method that does not depend on the material response. In this paper, friction tests were performed using a stored-energy Kolsky bar to understand the interfacial behavior between brass and steel. Tests with brass samples having small and large grain size were performed under a low normal pressure (20 MPa) and a high (250 MPa) normal pressure. The standard deviations of all these tests are around 0.02. On average, samples with 211 μm grains showed an increase of 0.05 in friction coefficient values compared to samples with 32 μm grains. The difference is not statistically significant for both static and dynamic friction. Also, no significant difference was observed when the contact pressure was changed from 20 MPa to 250 MPa. Tests performed using the small contact area samples showed a lower static coefficient of friction as evidenced by the lack of a peak in the friction plots (Fig. 11(e)). However, investigation of the surface topology revealed that certain regions showed a character different from that seen in the larger area tests. In these regions, a scratch pattern was not evident and the surface roughness was also lower (see Fig. 20(b)). This occurrence of local surface differences could be the cause of the lower static friction coefficient observed for the small contact area tests. Despite the difference in static friction coefficient, no statistically significant difference was found for the dynamic friction.
The overall average values8 of friction coefficients obtained from the Kolsky bar experiments are μs=0.47±0.2 (4.5%) and μd=0.32±0.1 (3.7%). They are higher than those estimated by comparing extrusion experiments and numerical models, as presented in the previous companion paper. This can be explained by the fact that the surface roughness values for the extrusion die (Ra=0.8-1.2 μm) and the brass billets (Ra=2 μm) are higher than the values of the brass-steel contact pairs in the friction tests (Ra=0.2-0.3 μm). Extrusion results presented in Cao et al. [23] have shown that a higher surface roughness gives us a lower extrusion force due to the changes in the adhesion behavior of the contacting interfaces as brass gets deposited and transferred to the steel surface.
An important conclusion that can be drawn from the fact that the friction coefficients do not significantly vary with grain size or contact area is that the curving tendency of the submillimetersized pins is related to the material response. This was verified by microstructural analysis of the deformed pins: large grains resisting to deformation were present in the curved regions of the pins [24]. Also, the drop in friction coefficients with decreasing die dimensions reported in the previous companion paper could be related to the fact that the tensile test data and material models used to simulate material response are insufficient to capture the material behavior for extrusions ranging from the 2.00:1.33 mm diam case down to the 0.76:0.57 mm dia case. Tensile tests reported in Cao et al. [23] did not show a distinct effect of sample dimensions, but other tests, such as bending experiments or compression tests, would help to further establish the validity of this result. Moreover, the assumptions of material isotropy and model symmetry cease to be valid due to the large share of the volume occupied by individual grains when submillimetersized pins are fabricated. For the smallest extrusion die in the previous companion paper, the inlet diameter is 0.76 mm, and therefore, only about four 211 μm grains can exist across the diameter. The relative size, location, and orientation of such grains have a significant impact on the extrusion process characteristics. This emphasizes the need for numerical modeling methods, e.g., FEM simulations using crystal plasticity material subroutines, that can account for discontinuities, such as the existence of large grains and the interactions at grain boundaries. Additional analysis tools, such as orientation
imaging microscopy (OIM), could also be used to study the texture of the deformed pins and the initial unextruded billets. This would help establish whether a specific material orientation is more conducive to deformation than others, thus, leading to a reorientation of material and a perceptible change in the texture before and after deformation.
5 Conclusions
A Kolsky stored-energy apparatus has been used to investigate the dependence of the friction between brass and steel on grain size, contact pressure and specimen size. We find that:
- There is no statistically significant effect of the grain size, the contact pressure, and the specimen size on both the static and the dynamic friction coefficients.
- Different scratch patterns are associated with different contact areas. This causes a slight difference in the static friction coefficient but no significant difference in the dynamic one.
- The curving tendency of submillimeter-sized pins is not related to the friction but to the material response. Further numerical simulations and experiments should explore the role of size, location, and orientation of grains in the pins.
Acknowledgment
This research was supported by the National Science Foundation through DMII Grant No. 0400267.
References
- Kinsey, B. L., Parasiz, S., Onyancha, R., Ehmann, K., Espinosa, H., Liu, W. K., Mori, L. F., Krishnan, N., and Li, M., 2006, “Investigation of Deformation, Process Model, and Frictional Size Effects During Microforming,” Proc. of 2006 NSF Design, Service, and Manufacturing Grantees and Research Conference, St. Louis, Sept. National Science Foundation.
- Krishnan, N., Cao, J., and Dohda, K., 2007, “Study of the Size Effects and Friction Conditions in Micro-Extrusion—Part I: Micro-Extrusion Experiments and Analysis,” ASME J. Manuf. Sci. Eng., 129, pp. 669–676.
- Wang, W., Wagoner, R. H., and Wang, X. J., 1996, “Measurement of Friction Under Sheet Forming Conditions,” Metall. Mater. Trans. A, 27(12), pp. 3971– 3981.
- Davim, J. P., 2000, “An Experimental Study of the Tribological Behaviour of the Brass/Steel Pair,” J. Mater. Process. Technol., 100(1–3), pp. 273–277.
- Kim, D. E., and Hwang, D. H., 1998, “Experimental Investigation of the Influence of Machining Condition on the Contact Sliding Behavior of Metals,” ASME J. Manuf. Sci. Eng., 120(2), pp. 395–400.
- Ogawa, K., 1997, “Impact Friction Test Method by Applying Stress Wave,” Exp. Mech., 37(4), pp. 398–402.
- Sofuoglu, H., Gedikli, H., and Rasty, J., 2001, “Determination of Friction Coefficient by Employing the Ring Compression Test,” ASME J. Eng. Mater. Technol., 123(3), pp. 338–348.
- Blau, P. J., 2002, “Appendix: Static and Kinetic Friction Coefficients for Selected Materials,” P. J. Blau, ed., ASM Handbook, 4th ed., ASM International, Materials Park, OH, Vol. 18.
- Geiger, M., Messner, A., Engel, U., Kals, R., and Vollertsen, F., 1995, “Design of Microforming Processes—Fundamentals, Material Data and Friction Behavior,” Proc. of 9th International Cold Forging Congress, Solihull, UK, May 22–26, pp. 155–163.
- Espinosa, H. D., Patanella, A. J., and Fischer, M., 2000, “A Novel Dynamic Friction Experiment Using a Modified Kolsky Bar Apparatus,” Exp. Mech., 40(2): 138–153.
- Espinosa, H. D., Patanella, A. J., and Fischer, M., 2000, “Dynamic Friction Measurements at Sliding Velocities Representative of High-Speed Machining Processes,” ASME J. Tribol., 122(4), pp. 834–848.
- Zhang, H., Patanella, A. J., Espinosa, H. D., and Pae, K. D., 1999, “Dynamic Friction of Nano-Materials,” Proc. of APS—Shock Compression of Condensed Matter, Salt Lake City, July, M. D. Furnish, L. C. Chhabildas, and R. S. Hixon, ed., American Institute of Physics, Melville, NY.
- Rajagopalan, S., and Prakash, V., 1999, “A Modified Torsional Kolsky Bar for Investigating Dynamic Friction,” Exp. Mech., 39(4), pp. 295–303.
- Larsen-Basse, J., 1992, “Basic Theory of Solid Friction,” ASM Handbook, 4th ed., P. J. Blau, ed., ASM International, Materials Park, OH, Vol. 18.
- Wilcoxon, F., 1945, “Individual Comparisons by Ranking Methods,” Biometrics Bull., 1(6), pp. 80–83.
- Student , 1908, “The Probable Error of a Mean,” Biometrika, 6(1), pp. 1–25.
- Behrens, W. V., 1929, “Ein Beitrag Zur Fehlerberechnung Bei Wenigen Beobachtungen,” Landwirtschaftliche Jahrbücher, 68, pp. 807–837.
- Fisher, R. A., 1935, “The Fiducial Argument in Statistical Inference,” Ann. Eugenics, 6, pp. 391–398.
- Tukey, J. W., 1977, Exploratory Data Analysis, Addison-Wesley, Reading, MA.
- De Gee, A. W. J., and Zaat, J. H., 1962, “Wear of Copper Alloys Against Steel in Oxygen and Argon,” Wear, 5(4), pp. 257–274.
- Lancaster, J. K., 1963, Proc. R. Soc. London, Ser. A, 273, p. 466.
- Ludema, K. C., 2002, “Sliding and Adhesive Wear,” ASM Handbook, 4th ed., P. J. Blau, ASM International, Materials Park, OH, Vol. 18.
- Cao, J., Krishnan, N., Wang, Z., Luand, H., Liu, W. K., and Swanson, A., 2004, “Microforming—Experimental Investigation of the Extrusion Process for Micropins and Its Numerical Simulation Using RKEM,” ASME J. Manuf. Sci. Eng., 126(4), pp. 642–652.
- Krishnan, N., Cao, J., Kinsey, B., Parasiz, S., and Li, M., 2005, “Investigation of Deformation Characteristics of Micropins Fabricated Using Microextrusion,” ASME International Mechanical Engineering Conference and Exposition, Orlando, Nov. 5–11 ASME, New York.
Footnotes
¹Corresponding author.
²Fuji prescale medium pressure has a sensitivity range from 10 MPa to 50 MPa.
³MATLAB is a trademark of The MathWorks, Inc.
4For the small contact area samples, the scan area was reduced in order to have the whole field of view covered by the ring trace.
5The average roughness Ra is the mean vertical height deviation of the asperities measured from the centerline of the surface between peaks and valleys [15]; the root-mean-square value Rq is defined as the square root of the deviations and represents the standard deviation of the asperity height distribution [14].
6Without the assumption of equal variances.
7In our experiment, because of the geometry of the samples, there was a difference in sliding velocity between the large contact area samples (~5 m/s) and the small contact area samples (~1 m/s).
8It is reported the average value, the standard deviation of the mean and the percentage of the mean represented by the standard deviation of the mean: μ ± σ(σ%).


