T Ous* and C Arcoumanis
*Corresponding author: Energy and the Environment Research Centre, School of Engineering andMathematical Sciences, The City University London, Northampton Square, London EC1V 0HB, UK. email: [email protected]
Energy and the Environment Research Centre, School of Engineering andMathematical Sciences, The City University London, London, UK
The manuscript was received on 8 March 2007 and was accepted after revision for publication on 1 June 2007.
DOI: 10.1243/0954406JMES654
Abstract
The effect of the compressive force on the performance of a proton exchange membrane fuel cell has been examined experimentally. The performance has been evaluated on two polarization regions of the cell: ohmic and mass transport. Cell voltage and current density as a function of pressure were measured under constant load and various inlet air humidity conditions. The pressure distribution on the surface of the gas diffusion layer was measured using a pressure detection film and the results show that increasing the pressure improves the performance of the cell. The improvement of the cell voltage in the ohmic region was found to be greater than that in the mass transport region, whereas for the cell current density, the mass transport region exhibited higher change. The increase in the cell specific power in the ohmic and mass transport regions, as pressure increases from 0 to 2MNm-2, is estimated to be 9 and 18mW cm-2, respectively. However, the fuel cell performance in these two regions declined dramatically when excessive pressure (≥5MNm-2) was applied. The mass transport region proved to be more susceptible to this sharp decline under excessive pressure than the ohmic region.
Keywords: proton exchange membrane fuel cell, compression, performance, torque, gas diffusion layer
1 Introduction
The compressive force applied to a single or a stack fuel cell design influences a number of mechanical, electrical, and probably chemical properties of fuel cells. Some of these changes are advantageous in terms of performance, whereas others can be detrimental. For example, not enough clamping pressure between the fuel cell plates can result in leakage of both reactants from the active flow channels. The interfacial contact resistance between the plates can also be very high. Too much pressure, in contract, can cause deformation of some of the plates, thus minimizing the electrical conducting area within the cell. It may even damage some brittle components of the cell, such as the gas diffusion layer (GDL) or the thin reactant-flow plates. In all cases, changes in fuel cell performance can take place, which makes an investigation to identify the optimum assembly pressure for an enhanced fuel cell both useful and necessary.
The impact of compression on the interfacial contact resistance between some of the fuel cell plates has been investigated previously [1–3]. In particular, the through-plane resistance of a Toray carbon paper (GDL) was characterized under various applied torque loads [1]. The approach was to apply a defined compaction force across the plate–GDL–plate assembly, pass a direct current through, and measure the plate-to-plate voltage drop. The results have shown an exponential reduction in the total resistance, bulk and contact resistance, with increasing compression. A similar technique was used in reference [2] to measure the contact resistance of GDL and various reactantflow plate materials. The contact resistance was again found to reduce exponentially with compression. In reference [3], the contact resistance was estimated by measuring the voltage between the current collector plate and the GDL under two different compaction pressures during the operation of a fuel cell. The measured voltage was plotted against the cell current density yielding a straight line whose slope was interpreted as contact resistance. The results indicate that higher compaction pressures induce lower contact resistance. The reduction in contact resistance caused by compression was found to be even more significant than trends observed inGDL’s contact resistance for various flow-plate materials such as graphite or stainless steel [4]. In reference [5] the pressure distribution on the surface of the GDL was simulated by a finite-element analysis model, which was validated using a sensitive pressure film inserted between the reactant-flow plate and the membrane electrode assembly (MEA). It should be noted that the method of applying pressure across the fuel cell end-plates affects the pressure distribution within the cell. As the assembly of most fuel cells is based on the traditional point-load design, the local pressure around the clamping areas is expected to be higher than that in other locations. This, however, may not show the true effect of compression on the performance of fuel cells. The compressive force across the cell should in principle be applied in such a way that pressure is equally distributed along the entire surface of the cell. The hydro-pressure technique used in reference [6] has produced a better pressure distribution than the traditional design; the fuel cell polarization curves showed that cells under uniform pressure have better performance than the traditional point-load design and that compression enhances the performance of the cell linearly. The experimental work in reference [7] has also investigated the effect of pressure directly onto the fuel cell polarization curve. Three different GDL types were examined and the results showed that each of them exhibited different optimal assembly pressure for performance enhancement of the cell.
Here, the effect of uniform-surface compression on the performance of fuel cells is investigated by inserting a pressure detection film between the GDL and the reactant-flow plates to measure the pressure distribution on the GDL surface. The change in performance as a function of pressure was analysed in two polarization regions under different air humidity conditions. Furthermore, the cell voltage and current density as a function of pressure were measured separately under constant resistance load.
2 Theory
The use of compaction pressure during the assembly of fuel cells plays a crucial role particularly at the interface between the GDL and the reactant-flow plates. It reduces the interfacial contact resistance between those two parts, as well as it serves as sealant to ensure proper delivery of reactants to the active flow channels. However, the increase in pressure must be controlled accurately because it may cause damage to some components of the cell. If the reactant-flowplate breaks, the reactants can escape from the reaction channels to the outer side of the cell; alter
natively, they can cross from channel to channel making less use of the active area of the catalyst. In addition, the bulk resistance of the reactant-flow plate becomes higher and the same applies to the GDL. Any hole or broken strip on the surface of the GDL allows the reactants to cross more easily from the anode to the cathode, or vice versa, increasing the amount of fuel crossover. The reactants can also flow directly from the channels into the catalyst layer without being uniformly distributed on the surface of the catalyst. Finally, the conducting area between the GDL and the catalysts will be reduced.
2.1 Effect on fuel cell resistance
The fuel cell resistance can be calculated by the summation of the bulk resistance and interfacial contact resistance of all the adjacent plates within the electrical network of the cell, as illustrated in Fig. 1. This includes the current collector plates, reactantflow plates, gas diffusion carbon layers, and the MEA sandwiched in the middle.
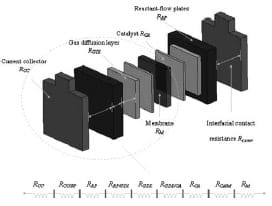
Fig. 1 Equivalent circuit of the total resistance for one-side electrode fuel cell
The fuel cell resistance RFC can be calculated as
RFC = RBulk + RContact (1)
RBulk = RM + 2RCA + 2RGDL + 2RRP + 2RCC (2)
RContact = RCC/RP + RRP/GDL + RGDL/CA + RCA/M (3)
where RBulk is the bulk resistance of the fuel cell plates, RContact the contact resistance between the plates, RM the ionic resistance of the membrane, RCA the resistance of the catalyst, RGDL the resistance of the GDL, RRP the resistance of the reactant-flow plates, RCC the resistance of the current collector plates, RCC/RP the contact resistance of the current collector/reactantflow plate interface, RRP/GDL the contact resistance of the reactant-flow plate/GDL interface, RGDL/CA the contact resistance of the GDL/catalyst interface, and RCA/M the contact resistance of the catalyst/membrane interface.
The membrane resistance RM has the highest value among the other terms of equations (2) and (3). It is a strong function of the water content and depends on the chemical properties of the Nafion used. The contact resistance values indicated in equation (3) are very difficult to be measured because it is experimentally difficult to insert a measuring probe precisely at the exact location within the micro-scale interface region. A more feasible way to obtain these values is to measure the total resistance of the electrical chain, bulk and contact resistance, then subtract it from the bulk resistivity of each layer. Measuring the resistance of a seven-layer membrane type (GDL is hot pressed with the MEA on each side) enables to quantify the summation of RM, REL, RGDL, RGDL/CA, and RCA/M of equations (2) and (3). The resistance of the reactant-flow plate RRP and the current collector plate RCC can be simply estimated by applying the following body resistance equation that is,
R = (p × d) / A (4)
where R is the plate resistance, p the resistivity of the material, d the travelling length of the electron or the plate thickness, and A its cross-sectional area.
Owing the presence of water as a result of the electrochemical reaction of the cell, the surface of a metal reactant-flow plate becomes corroded after a certain operating time. A passive film is then formed at the GDL/reactant-flow plate interface, which increases the contact resistance significantly [3]. The thickness of the film is a function of the cell operating time and is strongly dependent on the pressure applied across the plates.
In order to express quantitatively the effect of compression and associate it with the fuel cell voltage, the empirical equation of the cell voltage V must be used
V = E – Blog ((i + in) / i0) – (in + i)(RFC) (5)
where E the reversible potential at the exchange current density, B the Tafel slope constant, i the current density, i0 the exchange current density, and in is the internal and fuel crossover equivalent current density.
According to equation (5), the change in the fuel cell voltage becomes
ΔV = E – Blog ((i + in) / i0) – (in + i)(ΔRFC) (6)
2.2 Effect on mass transport
The porosity of the GDL facilitates the access of reactants into the fuel cell electrodes. By compressing the GDL, its thickness and effective porosity decrease, thus limiting the amount of reactants entering the electro-catalyst sites.The change in porosity Δε can be estimated from the change in the layer thickness [1]
The fuel cell current I is related to the mass flowrate of both reactants, oxygen and hydrogen, as
I = (4F / n) x UO2 (7)
I = (2F / n) x UH2 (8)
where F is the Faraday constant and UO2 and UH2 are the oxygen and hydrogen flowrates, respectively.
If the porosity of the diffusion layer reduces, the current calculations in equations (7) and (8) become
I = (4F / n) x (UO2)(1-Δε) (9)
I = (2F / n) x (UH2)(1-Δε) (10)
The pressure acting on the diffusion layer at the land interface of the reactant-flowplates reduces the porosity, especially under the land areas. This, however, minimizes the possibility for the reactants to cross from one channel to another, the so-called channel– channel crossover. The pressure can also cause a slight deflection of the membrane into the channels; the amount of deflection varies depending on the layer’s stiffness, compression load, temperature, and hydration of the membrane. This can result in changes to the flow and consumption of reactants in the channels. The effect is probably negligible once the channel is flooded with liquid water, but it can be avoided by making the channel length/width ratio less than 3 [8].
2.3 Effect on MEA
During the operation of the fuel cell, hydrogen protons migrate through the polymer membrane over a fixed distance governed by its actual thickness (~50–175μm). By applying more compression across the membrane, its thickness reduces. The distance which protons have to travel across the electrodes thus becomes shorter, leading to a faster electrochemical reaction by the cell. The results in reference [9] show that membrane thickness has a minimal effect on the fuel cell performance. Therefore, it is expected that the change in the fuel cell performance by compressing theMEAwill be caused by changes in the catalyst
layer, rather than shortening the polymeric distance which hydrogen ions have to travel.
The surface area (SA) of the catalyst is a measure of the number of surface atoms to bulk atoms [10].When compression is applied, the distribution of the catalyst atoms (e.g. Platinum (Pt) atoms) changes in sucha way that more atoms tend to be at the surface, thus increasing the active SA of the catalyst. In addition, compression may reduce the interatomic distances between the Pt atoms, providing more favourable sites for the dissociative adsorption of oxygen during the reaction of the cell [4].
3 Experiment
3.1 Experimental set-up
The experimental set-up is illustrated in Fig. 2. The hydrogen and air flow were regulated by the mass flow controllers CT Platon and JonCons, respectively. The reactant air was humidified (Norgren LO7-200- MPQG) before entering the cell. The pressure of the inlet reactant gases was measured using Stiko pressure indicators. The humidity and temperature of the inlet and outlet airwere measured using built-in k-type sensors (Honeywell HIH-3610 and HEL-700 series). Data were transferred into a PC via the data acquisition system (National Instruments PCI-6225), and the results were collected using the compatible Labview 7 software. The compression unit, shown in Fig. 3, allows a gradual increase in the pressure across the end-plates of the cell. The screw located at the back of the unit is controlled by a torque wrench device and it pushes a flat metal plate in the horizontal direction towards the cell. The fuel cell uses a Johnson Matthey MEA (MEAno.W11067-06, Pt loading 3.5mg/m³, active area 25cm²) sandwiched between two Toray carbon papers (TGP-H-060). The flow channels of both the anode and cathode were machined in serpentine shapes, with a channel width of 1.5mm, a depth of 1.5mm, and a length of 655mm. The total number of channels in each plate was 13 and they were equally spaced by lands, also called the ribs, of 1.5mm width. The fuel cell voltage and current density were measured using a multimeter (Black Star 3225), in which the external load used in the measurements was a series of electric resistors, manually placed across the fuel cell unit.
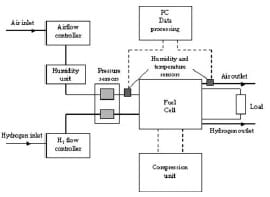
Fig. 2 Schematic diagram of the experimental set-up
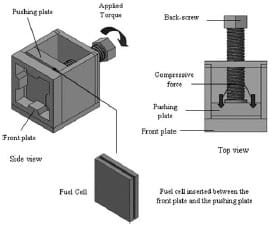
Fig. 3 Design of the compression unit
3.2 Pressure distribution measurements
By applying the screw thread mechanics theory, it is possible to estimate the pressure distribution on the surface of the GDL fromthe torque of the compression unit.A pressure detection film(Pressurex®)was inserted between the diffusion layer and the reactant-flowplate to measure the pressure distribution on the surface. Sample pieces to detect pressures between 0.19 and 9.65MNm-2 were cut at similar dimensions to the cell plates. After each test, the film was removed and colour intensity processing was conducted to quantify the pressure distribution. Figure 4 shows the colour intensity under 22Nm torque load, which corresponds to 5MNm-2 of the applied pressure. The white strips represent the channels in the reactant-flow plates, whereas the red areas represent the graphite solid phase. Test repeated within the torque range 8–22 Nm provided the required calibration with pressure (Table 1).
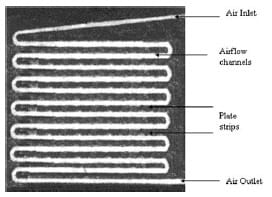
Fig. 4 Pressure distribution on the surface of the GDL under 22 Nm torque (5 MNm-2)
Table 1 Calibration between the pressure on the surface of the GDL and the applied torque
3.3 Operating conditions
The fuel cell was operating at a temperature of 25 °C and was kept in operation to reach steady state before measurements of voltage and current density were taken. The air enters the cell with a humidity of 100 per cent relative humidity, whereas the inlet hydrogen was kept dry; the airflow was set to a stoichiometry of 2.3 (at a current density of 128 mA cm²).
4 Results and Discussion
4.1 Effect on fuel cell polarization curve
Figure 5 shows the fuel cell polarization curves under various applied pressures in the range 0–5 MNm-2 and defines the three polarization regions. It can be seen from the figure that compressing the cell within 0.8–2 MNm-2 improves its performance whereas higher compression (>2 MNm-2) causes a dramatic decline in performance. The observed changes tend to be small at low current densities (activation region), but become significant at high current densities (ohmic and mass transport regions). As pressure increases from 0 to 2 MNm-2, themaximumchange in the power density of the cell, which occurs in the mass transport region, increases from 47 to 65 mW cm²; this gives a total amount of power gained for the 25 cm² cell size of 457 mW (ΔP = [P2MNm-2 – P0MNm-2] x cell size). The power enhancement is maximum between 0 and 0.8MNm-2 load and more consistent between 0.8 and 2MNm-2 pressure range. At a current density of 60 mA cm², the cell voltage increased by 70 mV as the pressure increased from 0 to 0.8 MNm-2; from 0.8 to 2 MNm-2, the value increased by only 14mV for each 0.6 MNm-2 increment of pressure, giving an enhancement rate of 7mV for each 0.3MNm-2 of applied pressure.
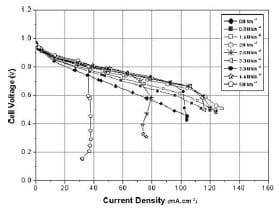
Fig. 5 Fuel cell polarization curves under various applied pressures
4.1.1 Ohmic region
The change in the internal resistance of the fuel cell can be obtained directly from the ohmic region of the polarization curve. By measuring the change in the cell voltage at a fixed cell current density, the change in the area specific resistance of the cell can be calculated. At a current density of 76 mA cm-2, the cell voltage increases by 120mV when the pressure increases from 0 to 2 MNm-2. This change corresponds to an increase in the specific power value of the cell by 9 mW cm-2. Fig. 6 shows the change in the fuel cell resistance ΔR under different applied pressures. It can be seen from Fig. 6 that ΔR reduces non-linearly with more applied pressure. This reduction is maximum at low pressure range (0–0.8 -2), and it gradually decreases until reaching a point (2.6 MNm-2) where more applied pressure has no effect on the internal resistance of the cell.
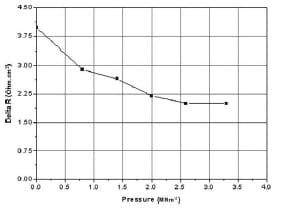
Fig. 6 Effect of compressive force in the ohmic region of a polarization curve
4.1.2 Mass transport region
The change in the mass transport region of a polarization curve is considered to be the most critical for the performance of fuel cells. It was shown previously in Fig. 5 that compressing the cell up to a value of 2 MNm-2 improves its performance. At a current density of 104 mA cm-2, the cell voltag
e increases by 200 mV as pressure increased from 0 to 2 MNm-2. This change corresponds to an increase in the specific power of the cell by around 18 mW cm-2. As the pressure increases to 2.6 MNm-2, the maximum current density of the cell starts to drop (~4 mA cm²). Fig. 7 shows the limiting current density ilimit of the cell as a function of pressure. It can be seen from Fig. 7 that the limiting current density at 2.6 MNm-2 was reduced by almost three times as a pressure of 5 MNm-2 was applied. This massive drop in current can be attributed to the reduction in the porosity of the GDL, thus limiting the amount of reactants entering the electro-catalyst layer to do the reaction. The amount of current drop can be used in equations (9) and (10) to estimate the change in the porosity of the GDL.
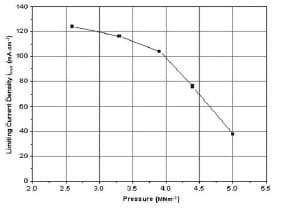
Fig. 7 Effect of compressive force in the mass transport region of a polarization curve
4.2 Effect on fuel cell performance at constant loads
Figure 8 shows the change in the fuel cell voltage within the 0–2 MNm-2 pressure range under fixed external loads (0.01, 0.33, and 10Ω). These resistance values have been selected as they were able to measure, according to the results of Fig. 5, the performance of the cell in the three polarization regions. The resistance value of 0.01Ω refers to the mass transport, 0.33Ω to the ohmic, and 10Ω to the activation regions. As pressure increases from 0 to 2 MNm-2, also shown inTable 2, the change in the ohmic region was ~76mV. This change was larger than the activation (4mV) and the mass transport (58mV) regions. Figure 9 shows the variations in the current density for the same loads used in Fig. 8. The current density in the activation domain was almost constant, whereas the highest change was measured in the mass transport domain. In particular, the change in the current density within the 0–2 MNm-2 range was estimated to be 0.6, 13, and 23 per cent for the activation, ohmic, and mass transport regions, respectively.
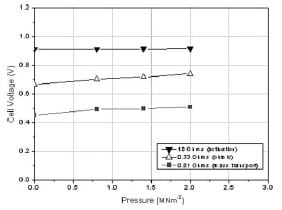
Fig. 8 Variation in the cell voltage for different electronic loads
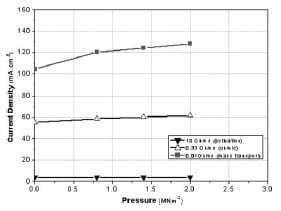
Fig. 9 Variation in the cell current density for different electronic loads

Table 2 Variation of fuel cell voltage and current density in the ohmic and mass transport regions
Figures 10 and 11 show the effect on fuel cell voltage and current density in the ohmic region for the entire load range (0–5 MNm-2) examined. These graphs can be divided into three main parts. In the first region, from0 to 2.6 MNm-2, both voltage and current density values increase linearly by an amount of 13 per cent for each 0.3 MNm-2 of applied pressure. As the pressure exceeds 2.6 MNm-2, the slope of that change becomes less steep, making the values almost constant. After a pressure of 4.4 MNm-2, a dramatic decrease in the performanceoccurs.This decline should be associated with the decrease in porosity of the GDL, as explained previously. Table 2 lists the changes in the various quantities for the ohmic and mass transport regions.
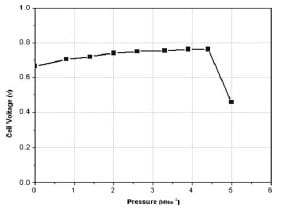
Fig. 10 Variation in the cell voltage in the ohmic region (0.33Ω) as a function of pressure (0–5 MNm-2)
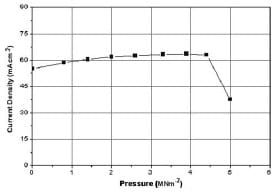
Fig. 11 Variation in the cell current density in the ohmic region (0.33Ω) as a function of pressure (5MNm-2)
5 Conclusions
A compressive force was applied across a proton exchange membrane fuel cell in order to study possible effects on its performance. At each pressure load, cell voltage and current density were measured. The results show that increasing the torque up to a value of 12 Nm improved the performance of the cell. The improvement of the cell voltage in the ohmic region was found to be greater than in that the mass transport region, whereas for the cell current density, the mass transport region exhibited higher change. The increase in the cell specific power in the ohmic and mass transport regions, as pressure increases from 0 to 2 MNm-2, is estimated to be 9 and 18 mW cm-2, respectively. However, the fuel cell performance in these two regions declined dramatically when excessive pressure (≥5 MNm-2) was applied. The reduction in the ohmic region is expected to be caused by a deflection to some plates in the cell design which increased the cell internal resistance. The significant drop in the mass transport region was the result of a large decrease in the porosity of the GDL, which limited the amount of reactants entering the electrocatalyst layer of the membrane. Under constant resistance load, the fuel cell voltage and current responded in amannersimilar to compression by improving quite linearly with compression up to a pressure load of 3.9 MNm-2. They then remained constant between 3.9 and 4.4 MNm-2, but declined dramatically at higher pressures (≥5 MNm-2).
Acknowledgements
The authors would like to acknowledge the contributions of Dr J. M. Nouri, Dr M. Gavaises, Mr Tim Fleming, and Mr Jim Ford as well as the technical support provided by Johnson Matthey to this programme.
References
- Mathias, M. F., Roth, J., Fleming, J., and Lehnert, W. Diffusion media materials and characterisation. In Handbook of fuel cells: fundamentals, technology and applications (Eds W. Vielstich, A. Lamm, and H. A. Gasteiger), 2003, Chapter 42, vol. 3, pp. 517–537 (John Wiley & Sons).
- Mepsted, G. O. and Moore, J.M. Performance and durability of bipolar plate materials. In ‘Handbook of fuel cells: fundamentals, technology and applications (Eds W. Vielstich, A. Lamm, and H. A. Gasteiger), 2003, Chapter 24, vol. 3, pp. 286–293 (John Wiley & Sons).
- Shores,D. A. andDeluga,G. A. Basicmaterials corrosion issues. In Handbook of fuel cells: fundamentals, technology and applications (Eds W. Vielstich, A. Lamm, and H. A. Gasteiger), 2003, Chapter 23, vol. 3, pp. 273–284 (JohnWiley & Sons).
- Jalan,V. andTaylor,E. J. Importance of interatomic spacing in catalytic reduction of oxygen in phosphoric acid. J. Electrochem. Soc., 1983, 130, 2299–2302.
- Lee, S. J., Hsu, C. D., and Huang, C. H. Analyses of the fuel cell stack assembly pressure. J. Power Sources, 2005, 145, 353–361.
- Zhang, B.,Wang, X., and Song, Y. Pressurized endplates for uniformpressure distributions in PEMfuel cells. First International Conference on Fuel cell development and deployment, Storrs, Connecticut, 7–10March 2004.
- Lee,W. K., Ho, C. H.,Van Zee, J.W., and Murthy,M. The effects of compression and gas diffusion layers on the performance of a
PEM fuel cell. J. Power Sources, 1999, 84, 45–51. - Wilkinson, D. P. and Vanderleeden, O. Serpentine flow field design. In Handbook of fuel cells: fundamentals, technology and applications (EdsW. Vielstich, A. Lamm, and H. A.Gasteiger), 2003, Chapter 27, vol. 3, pp. 315–324 (JohnWiley & Sons).
- Kocha, S. S. Principles ofMEA preparation. InHandbook of fuel cells: fundamentals, technology and applications, (Eds W. Vielstich, A. Lamm, and H. A. Gasteiger), 2003, Chapter 43, vol. 3, pp. 550–565 (JohnWiley & Sons).
- Shimpalee, S., Greenway, S., Spuckler, D., and Van Zee, J. W. Predicting water and current distributions in a commercial-size PEMFC. J. Power Sources, 2004, 135, 79–87.
Appendix
Notation
A – cross-sectional area
B – Tafel constant
E – reversible open circuit voltage
F – Faraday constant
i – current density
ilimit – limiting current density
in – internal current
io – exchange current density
I – cell current
n – cell number
P – power
R – resistance
RCA catalyst resistance
RCC – current collector resistance
RFC – fuel cell resistance
RGDL – gas diffusion layer resistance
RM – membrane resistance
RRP – reactant plate resistance
RCA/M – catalyst/membrane contact resistance
RCC/RP – current collector/reactant plate contact resistance
RGDL/CA – gas diffusion layer/catalyst contact resistance
RRP/GDL – reactant plate/gas diffusion layer contact resistance
UO2 – oxygen flowrate
UH2 – hydrogen flowrate
V – cell voltage
ε – porosity
p – resistivity


