

Rajtukova, V.a *, Hudak, R.a , Zivcak, J.a , Halfarova, P.b , Kudrikova, R. a
a Technical University of Kosice, Fakulty of Mechanical Engineering, Department of Biomedical Engineering and Measurement, Letna 9, Kosice, 042 00, Slovakia
b VSB-Technical University of Ostrava, Faculty of Metallurgy and Materials Engineering, Department of Quality Management, Studentska 1, Ostrava – Poruba, 708 33, Czech Republic
Abstract
The paper deals with the problem of a biomechanical solution for human locomotion after amputation of a lower limb. With an inappropriately designed transtibial prostheses socket, the interaction between the socket and the stump occurs, leading to increased friction and subsequent surface damage to the soft tissue. In individual types of transtibial prostheses, locations are defined which can be loaded and which cannot be loaded. On the basis of the study of the anterior side of the stump, three loadable and two non-loadable areas were monitored using the TACTILUS tactile pressure sensor (Sensor Products Inc., Madison, New Jersey, USA). Methods of measuring individual values were proposed for the purpose of sensing the pressure in the socket and the liner interface, the stump and the liner interface. Each method includes the methodological preparation of the patient, the preparation of the room, the preparation of the measuring system, and the subsequent method of data processing. In the submitted paper, 11 stumps were non-invasively monitored. The method of assessing the pressure exerted on the stumps was focused on the monitoring of the pressure distribution in the selected areas. The results obtained by the pressure measurements were statistically processed. In both cases of the pressure system placement, the p-value was higher than 0.05; therefore, we can state that the sets are equal.
© 2014 Published by Elsevier Ltd. This is an open access article under the CC BY-NC-ND license
(https://creativecommons.org/licenses/by-nc-nd/3.0/).
Peer-review under responsibility of organizing committee of the Modelling of Mechanical and Mechatronic Systems MMaMS 2014
Keywords:pressure sensor, stump, transtibial prosthesis, methodology
* Corresponding author. Tel.: +421-55-6022657 E-mail address: [email protected]
1877-7058 © 2014 Published by Elsevier Ltd. This is an open access article under the CC BY-NC-ND license
(https://creativecommons.org/licenses/by-nc-nd/3.0/).
Peer-review under responsibility of organizing committee of the Modelling of Mechanical and Mechatronic Systems MMaMS 2014 doi: 10.1016/j.proeng.2014.12.106
1. Introduction
Despite the use of modern technologies in the prosthesis manufacture, there is certain residual interaction between a prosthesis and a stump, causing discomfort to a user wearing the prosthesis, as well as pain and stump soft tissue damage. [1]. These consequences occur due to the mutual pressure interaction between the prosthesis and the stump, which is one of the important factors for the assessment of the corrective, supporting, or fixation biomechanical effect. The use of a pressure sensor could facilitate the scanning of the pressure in the selected stump areas and thus optimize the prosthesis socket, avoid the skin damage, pain, and discomfort when using a prosthesis. [2].
According to the statistics of the National Health Information Centre regarding the activities of the Common Diagnostic and Curative Facilities in the SR, the submitted study was focused on the pressure measurements in transtibial prostheses, as their occurrence is higher than that of femoral prostheses (Table 1). On a transtibial stump, there are accurately defined loadable and unloadable areas that must be considered when manufacturing a transtibial prosthesis.
Table 1 Review of the provided endoskeletal prostheses [4]
| Number of providing endoskeletal prostheses | ||
|---|---|---|
| Year | Transtibail | Transfemoral |
| 2009 | 305 | 252 |
| 2010 | 228 | 212 |
| 2011 | 280 | 215 |
| 2012 | 369 | 300 |
Distribution of pressure on the interface between the stump and the transtibial prosthesis socket is required for the assessment of the socket design and construction. Measuring the pressure in the transtibial prosthesis sockets has been carried out for almost 50 years. Acquisition of correct data by the pressure measurements in sockets required proper measuring technology, appropriate sensors, proper sensor positioning and data collection. An ideal pressure sensor should facilitate the monitoring of the actual surface tension, i.e. the pressure distribution without substantial interventions in the initial conditions of the socket structure. At present, this is usually carried out using the Matrix TACTILE Sensors (MTS), application of which has become significant in the healthcare segment, as well as in the prosthetics and orthotics segments [3].
In his study, Faustini [5]carried out the pressure measurement after the transtibial amputation using the F-Socket 9811 (Tekscan) sensor. One sensor was placed on the lateral side of the stump and the fibula head, the second one was placed on the distal part of the tibia on the anterior stump side. F-Socket sensor dimensions were 76.2mm x 203.2 mm, with the thickness of 0.28 mm and it contained 96 sensors (each with the area of 161.3 mm2 ), arranged in 6columns and 16 rows, with the pressure range between 0 and 517 kPa. In their study, Dumbletonet al. [6] was dealing with the comparison of the dynamic pressure interface between the socket and the transtibial stump. The pressure measurements in the endoskeletal prosthesis were carried out using the Tekscan F-scan pressure scanner (Tekscan, Inc; Boston, Massachusetts, USA). Scanning in the prosthesis socket was carried out on the anterior, medial, posterior, and lateral side. It was observed that the distribution of the dynamic pressure on the stump interface was similar on both, loadable and unloadable areas.
In their study, Kang et al. [12]were examining the effects of various settings of the transtibial prosthesis socket (5°, 0°and 10°) using the F-socket pressure system (Tekscan). They measured the effects of the pressure in the anterior area (proximal, medial, and distal) and in the posterior area (proximal, medial, and distal) in different socket flexion angles (5°, 0°and 10 °). The pairwise t-test was used to compare the pressure in a socket with the flexion angle of 5° and the pressures in the socket flexion angles of 0° and 10°, while the significant level was 0.05.In other studies, the pressure system was used for measuring the pressure
in the transtibial prosthesis socket during walking [8][9] and during walking up the stairs[9][11][12].
2. Materials and methods
The pilot measurements were used as the basis for the preparation of the methodology for the pressure measurements in the transtibial prosthesis socket in the stump/liner and liner/socket interfaces. The measurements were carried out using the TACTILUS pressure sensor, (SENSOR PRODUCTS INC, USA). The methodology consisted of the methodology for the preparation of the environment where the measurements were carried out, the methodology for the preparation of the TACTILUS measuring system, the methodology for the preparation of a subject, the methodology for the processing of the acquired data, elaboration of reports, and data implementation. The measurements were carried out on 11 transtibial stumps of 10 subjects; out of these, 9 subjects had unilateral transtibial amputation, and in one case it was a bilateral transtibial amputation. The subjects did not report any pain during the utilisation of their transtibial prosthesis, their stump soft tissue integrity was not disturbed, and they did not feel any major pressure in the socket. Except for the subject with the bilateral amputation, all the users of transtibial prostheses were active. Subjects participating in the measurements were males aged 41 to 70 years. The average age of subjects was 55.72 ± 8.08 years. The period of prosthesis utilisation varied (between2 and 47 years)
The TACTILUS pressure pad was placed on the anterior area of the stump, on which the loadable areas (ON1, ON2 and ON3) and unloadable areas (NON4 and NON5) were monitored. The selected loadable areas in the submitted study are ON1 (medial area of the tibia, Fig. 1a), ON2 (the area between the tibia and the fibula, Fig. 1b), and ON3 (quadriceps tendon, Fig. 1c). The NON4 (anterior edge of the tibia, Fig. 1d) and the NON5 (bone end of the stump, Fig. 1e) areas are sensitive to pressure, i.e. they are unloadable.
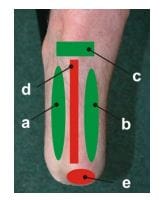
Fig. 1 Loadable areas (ON1 – a, ON2 – b, ON3 – c) and unloadable areas (NON4 – d, NON5 – e) on the transtibial stump
The TACTILUS pressure sensor was used to identify the maximum and the average compression loads in the selected areas (ON1, ON2, ON3, NON4 and NON5) with two pressure sensor placement alternatives. The first position was between the stump and the liner; the second one was between the liner and the transtibial prosthesis socket. The compression load was measured while subjects were walking (8 – 10 steps).
The measurements using the TACTILUS system were carried out in the room with a constant temperature (21- 24°C) and humidity during the entire measuring. As it is a dynamic measuring with a pressure sensor, it is necessary to ensure absence of barriers during the execution of the measurements –walking by a subject with a pressure sensor.
The pressure measurements in the stump/liner interface and the liner/transtibial prosthesis socket interface were carried out using the TACTILUS system by the SENSOR PRODUCTS INC. (USA) which was made available by the Department of Biomedical Engineering and Measurement (TUKE, Slovakia). The TACTILUS system consists of a sensor pad (20x20cm) with the range of 0to 97.19 kPa, a signal converter, a laptop with the installed TACTILUS software application, and interconnecting cables. Technical parameters of the TACTILUS system are presented in Table 2.
Table 2 Technical parameters of the TACTILUS system (SensorProd Inc., USA).
| Technology | Piezoresistive/ Resistive |
| Pressure range | 0.1 to 200 PSI (0.007 to 14.1 kg/cm2) |
| Sensing area | 200 x 200 mm |
| Thickness | 0.3 mm |
| Packaging area | 230 x 230 mm |
| Scan speed | Up to 1,000 hertz |
| Spatial resolution | Customizable from 0.04 (2 mm) and higher |
| Accuracy | ± 10% |
| Repeatability | ± 2% |
| Hysteresis | ± 5% |
| Non-linearity | ± 1.5% |
Free movement of a subject with an applied pressure pad was secured by the interconnecting cable with the length of 10 meters between the converter and the pad. Wide cables containing 40 cores transmit signals from individual sensors (20x20cm) and subsequently form a matrix of 400 sensing points. The software assigns different colours, representing specific compression loads, to individual analogue signal strengths [14].
Prior to a measurement, all hardware components of the TACTILUS system (pressure pad, connecting cable, converter) must be properly connected. The methodology for the pressure pad placement is identical for both measurement types. In the first case, the pressure pad is applied to the stump, the liner is slipped over, and then the prosthesis itself is applied (Fig. 2a). In the second case, the pressure pad is applied to the liner and a subject applies a prosthesis (Fig. 2b). After the prosthesis is put on, a subject walks 8-10 meters, while the pressure dynamic development is being recorded in the real time. Dynamic pressure measurement can concurrently be viewed, using the software, on the laptop/PC screen, and the measurement can be repeated, if necessary. No special attachments of the TACTILUS system were required; after the liner was slipped over, the sensor′s movement was hindered and sufficient securing was achieved. The same applies to the second method of prosthesis placement, where the pad stabilisation was achieved after the prosthesis was applied.
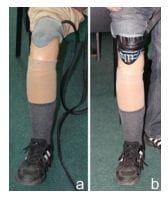
Fig. 2 Pressure sensor placement methods- a)stump/liner, b) liner/socket
Prior to a measurement, a subject should be instructed on the measurement procedure, development, and objective. During the sensor application, a subject is sitting on a chair to enable better access for the pressure pad application. Prior to each measurement, a trial measurement is carried out to identify a correct position of the pressure pad by pressing the selected areas (ON1, ON2, ON3, NON4 and NON5) with fingers and their position is checked using the TACTILUS software
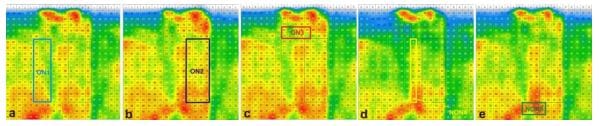
Fig. 3 Pressure maps for loadable (a,b,c) and unloadable areas (d,e)
The submitted study was monitoring the values of the maximum and the average pressure for the selected areas on the transtibial stump. On the generated pressure matrix, the selected areas (ON1, ON2, ON3, NON4and NON5) were marked. Fig.3 shows the impact of pressure in the selected areas, whereas impact of the pressure was identified for each selected area separately. The positions of individual selected areas were identified by a trial measurement and the trial measurement was considered in the assessment regarding the selection of the monitored areas. After the selected areas are marked, the TACTILUS software provides a graphical representation of the dynamic development of the measurement in form of curves (Fig. 4). As various stresses affect the transtibial prosthesis socket during a walking cycle, each selected area was assessed separately. By means of a graphic curve, the maxim
um and the average value was identified for a particular selected area. Selection of a monitored area is followed by the visualisation of curves of the minimum, average, and the maximum pressure, presented on the dynamic curve of the pressure impact for one area
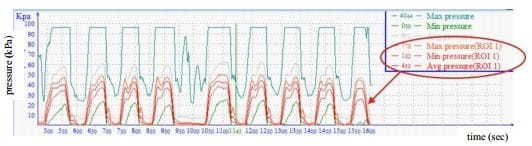
Fig. 4 Dynamic pressure curve during a walking cycle
Assessed output from the TACTILUS pressure sensor with the marked selected areas is shown in Fig. 5.
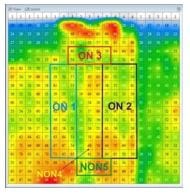
Fig. 5 Assessed output from the TACTILUS pressure system
Using the TACTILUS software, the average impact of the pressure between the stump and the liner was assessed.
As shown in Fig. 6, the strongest impact of the average pressure between the stump and the liner was observed in the ON1 area with the value of 81 kPa. On the contrary, the lowest value of the average pressure was 21 kPa in the NON4 area.
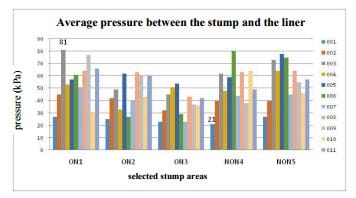
Fig. 6 Average value of the pressure between the stump and the liner
The average value was also identified for the second method of the pressure system placement (Fig. 7). The highest value of the average pressure between the liner and the socket was 78kPa in the NON5 area. In this case again, the lowest value of the average pressure was identified in the NON4 area with the value of 6 kPa.
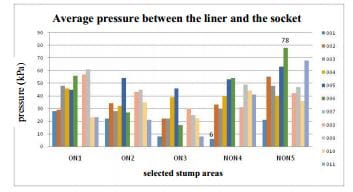
Fig. 7 Average value of the pressure between the liner and the transtibial prosthesis socket
The TACTILUS pressure sensor was used to identify the impact of the pressure in the selected areas (ON1, ON2, ON3, NON4 and NON5), as well as the pressure distribution. In each subject, the pressure was measured in the stump/liner and the liner/socket interfaces. In case of the 007 stump, the pressure was only measured in the stump/liner interface, as the structure of this transtibial prosthesis did not allow for the pressure measurement in the liner/socket interface. On the basis of the obtained results it can be stated that the liner absorbs the pressure developed in the socket when a prosthesis is worn.
3. Results
Statistic methods were applied to compare the average values for the unloadable NON4 and NON5areas. In the correlation of average pressure values in the NON4 and NON5 areas in the stump/liner interface, the p-value of 0.019 was observed. Similarly, in the correlation of average pressure values in the NON4 and NON5 areas in the liner/socket interface, the p-value = 0.006 was observed. In both cases of the pressure system placement, the p-value was higher than 0.05, it means that we can state that the sets are equal. The placement of sensor (stump/liner vs liner/socket) has no affect to measuring methodology (correlation between sensor placement) but they have affect to obtained values.
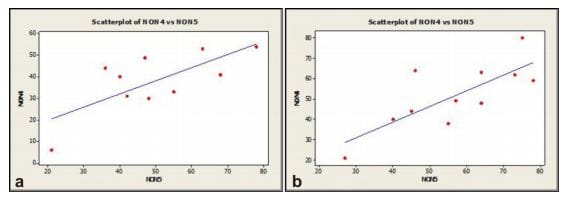
Fig. 8 Statistical assessment of the average pressure in the stump/liner (a) and the liner/socket (b)interfaces
An alternative method for the determination of appropriateness of the designed socket was the pressure scanning using the surface pressure sensor placed between the stump and the liner in the first case and between the liner and the socket in the second case. Considering the pressure distribution and the obtained values, it can be stated that higher values and higher number of extremes occurred when the sensor was placed between the stump and the liner. With the placement between the liner and the socket, the values are lower and their distribution is more homogenous (lower occurrence of extremes), which indicates that the liner facilitates more even pressure distribution on the socket and also absorbs possible impacts when a prosthesis is used.
The assessed results indicate that the pressure scanning in a transtibial prosthesis socket is an appropriate method of the fast diagnostics of the fabricated socket. The system discussed can be used in the stage of designing, fabrication, and application of the transtibial prosthesis socket. Significance thereof can also be applied in the testing and modification of the transtibial prosthesis socket.
Acknowledgements
Presented manuscript was supported by project Research of new diagnostic methods in invasive implantology, MšSR-3625/2010-11, Stimuls for Research and Development of Ministry of Education, Science and project ITMS: 26220220185 MediPark Medical university science park in Kosice.
References
[1]. MAK, A.F.T.; ZHANG, M.; BOONE, A.C.P.: State of the art research in lower limb prosthetic biomechanics socket interface; Journal of rahabilitation research and development, Vol. 38, No.2, March/April 2001, pages 161-174
[2]. R. Gailey, K. Allen, J. Cstles, J. Kucharik, M. Roeder, Review of secondary physical conditions associated with lower-limb amputation and long-term prosthesis use, J. Rehabil. Res. Dev., 45 (2008), p. 15
[3]. HALAJ, M., PALENČÁR, R., CHUDÝ, V., TIMA, J.: Metrological Characteristucs of the Tactile Sensor Array. Zborník z konferenci Strojné inžinierstvo 2000, Bratislava, 2000, str. 3-28
[4]. QUESADA P, SKINNER HB, Analysis of a below-knee patellar tendon-bearing prosthesis a finite element study. J Rehabil Res Dev 1991 :28(3) :1-12.
[5]. FAUSTINI M.C, CRAWFORD R.H, NEPTUNE R.R, ROGERS W.E, Bosker G., Design and Analysis of Orthogonally Compliant Features for Local Contact Pressure Relief in Transtibial Prostheses, Journal of Biomechanical Engineering, Vol.127, 2005 ASME
[6]. DUMBLENTON, T., ARJAN W. P. BUIS, et al, Dynamic interface pressure distributions of two transtibial prosthetic socket concepts Journal of Rehabilitation Reseasch and Development, Vol. 46, Number 3, 2009, page 405-416, ISSN: 1938-1352,
[7]. Národné centrum zdravotníckych informácií. Činnosť spoloČnÝch vyšetrovacích a liečebných zložiek v SR [cit. 07.09.2013]. [online]: .
[8]. CONVERY,P., BUIS,A., Socket/stump interface dynamic pressure distributions recorded during the prosthetic stance phase of gait of a trans-tibial amputee wearing a hydrocast socket, Prosthet. Orthot. Int., 23 (1999), pp. 107–112
[9]. GOH,J., LEE,P., CHONG,S., Stump/socket pressure profiles of the pressure cast prosthetic socket, Clin. Biomech., 18 (2003), pp. 237–243 [10].DOU,P., JIA, X., SUO, S.,WANG,R. ZHANG,M. Pressure distribution at the stump/socket interface in transtibial amputees during walking on stairs, slope and non-flat road, Clin. Biomech., 21 (2006), pp. 1067–1073
[11].ESHRAGHI, A., OSMAN, A., GHOLIZADEH,H., ALI, S.,Saevarsson,S.K., Abas, W., An experimental study of the interface pressure profile during level walking of a new suspension system for lower limb amputees, Clin. Biomech., 28 (2012), pp. 55–60
[12].Wolf S., Alimusaj, M., Fradet, L., Siegel, J., Braatz, F., Pressure characteristics at the stump/socket interface in transtibial amputees using an adaptive prosthetic foot, Clinical Biomechanics, Volume 24, Issue 10, December 2009, Pages 860–865
[13].KANG P., KIM J., ROH J., Pressure Distribution in Stump/Socket Interface in Response to Socket Flexion Angle Changes in Trans-Tibial Prostheses With Silicone Liner, PTK Vol.13, No. 4, 2006
[14].HUDÁK, R., RAJŤ–KOVÁ, V., ŽIVČÁK, J., HUDÁK, J., BEDNARČíKOVÁ, L.: The use of matrix tactile sensors (MTS) for diagnostics of the efficiency of production, testing and application of a trunk orthosi
s / – 2012. In: CINTI 2012 : 13th IEEE International Symposium on Computational Intelligence and Informatics : proceedings : Budapest, Hungary, November 20-22, 2012. – Budapest : Óbuda University, 2012 P. 299-304. – ISBN 978-1-4673-5204-8
[15].TSIOKOS, D., KANELLOS, GT., PAPAIOANNOU, G., PISSADAKIS, S.: Fiber Optic–Based Pressure Sensing Surface for Skin Health Management in Prosthetic and Rehabilitation Interventions, In: Biomedical Engineering – Technical Applications in Medicine, ISBN 978- 953-51-0733-0, 432 pages, Publisher: In Tech, Chapters published September 06, 2012
![]()