

Article
Related Links
Jerrold S. Petrofsky PhD, JDKatie McClellen PhD, Michelle Prowse MS, PT, Gurinder Bains MD, Lee Berk DrPH, MPH, CLS, Scott Lee MD
ABSTRACT
Introduction
Much attention has been given to the effect of pressure on skin blood flow in the feet of older people and people with diabetes. But little attention has been paid to other areas of the body, especially under the belt at the waist where pressure might be high during body movements associated with exercise. This may be very important when devices such as heat packs are worn during the day under the belt since their safety relies on appropriate skin blood flow to dissipate the heat; in diabetic populations burns have been seen.
Methods
Forty male and female subjects, with and without diabetes, were examined in 2 series of experiments to assess the vertical and shear pressure under a belt worn during different common exercises. Vertical and shear pressure under the belt, belt tension and shear pressure were measured with a Tactilus pressure mapping system. Eleven different body movements were examined. Then, from the recorded pressures, a second series of experiments examined skin blood flow at these same pressures.
Results
The results of the experiments showed that there was little shear and vertical pressure in thin subjects during 10 different exercises. But for overweight subjects, pressure under the belt was as high as 150 KPa. At these high levels of pressure, skin circulation was occluded.
Conclusions
In subjects with diabetes who are generally overweight and have impaired circulation, hot packs should be used with caution due to the low blood flows at rest and occlusion of the circulation under the belt with body movement.
Keywords: pressure, circulation, obesity, age
Introduction
Lower back pain is a major problem in the United States and around the world [1]. Even in professions where individuals are in good physical condition, such as fire fighters, there are significant injuries that cause back pain [2]. This is especially apparent in people that stand on their feet for long periods of time such as nurses [3]. People who are overweight or older have a greater chance of having low back pain due to stress and poor abdominal core strength [4].
Commonly, after a lower back injury, hot packs are used [3]. In one study for example, in Thailand, 64% of almost 600 therapists used hot packs routinely for low back pain [5]. This modality is used either alone or sometimes with exercise [6]. These hot packs, manufactured and sold by many different companies, have grown in use due to over the counter heat wraps that can be worn for up to 12 hours. These are worn under the belt for lower back pain while people move about and work during the day. The heat is dissipated by an increase in circulation; without that increase in circulation, these constant calorie generating heat packs can get very hot and may cause a burn [7, 8, 9, 10, 11, 12, 13]. The pressure caused by the belt may cause such a reduction in circulation.
Normally, when low pressure is applied to the skin, there is a reactive hyperemia. With greater pressure applied to the skin, blood flow is occluded [10, 11, 14]. This is believed to be mediated by capsaicin sensitive nerve fibers that release neuro peptides [15, 16]. This hyperemia at low pressure is believed to protect the skin from damage [15, 17, 18]. Further, compression induced damage can occur to soft tissue if the pressure becomes too high [19]. This is especially true where the skin itself is weak as is the case in older people or people with diabetes [19, 20]. Other risks, for developing ulcers and skin breakdown, also include the thickness of the skin which can be modified by obesity [21]. Thus, obesity is a risk factor for burns [22] as is ageing and diabetes [23, 24].
While it might be predicted that pressures on the skin might be high during exercise under a belt, and especially under a heat wrap or hot pack, the pressure under the belt during exercise, in relation to skin blood flow, has not been assessed. When an overweight person moves and wears a belt, it can be predicted that belt tensions will be higher than that of a thin person because of the adiposity around the waist. Older people and people with diabetes generally have greater body fat, making this group especially susceptible to pressure [25, 26]. Therefore, in the present investigation, vertical and sheer pressures were measured under the belt as was belt tension during typical exercise and movement as seen during activities of daily living. The subjects included younger people, older people and people with diabetes. The subjects were initially divided, for data analysis into low and high body fat groups and then re-analyzed by age and diabetes. This was done since the greatest effect on skin pressure and belt tension was body fat. However, it could be that ageing and diabetes would impact circulation the most.
Subjects
The subjects in this study were 40 males and females. They were initially divided into a high body fat (body fat >25%, HF) and low body fat (body fat <25%, LF) groups. The demographics are listed in Tables 1 and 2. They were selected to give a variety of ages and body fat to provide a cross section for the study. Twenty eight subjects were free of diabetes and circulatory disorders while 12 had diabetes. Of the 28, 12 subjects were less than 35 years old (younger subjects) and 16 were over 35 years old (older subjects). The low body fat group was 15 subjects and the high body fat group was 25 subjects. Subjects were not taking alpha or beta agonists or antagonists. Subjects with diabetes had an average HbA1c of 7.4% and were selected if they were in the range between 6 and 8.5%. All methods and procedures were approved by the Institutional Review Board of Loma Linda University. All subjects signed a statement of informed consent.
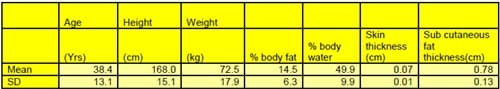
Table 1 – The demographics of the low fat group of subjects (LF) ( female= 8, male=7)
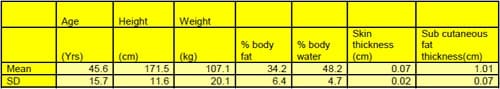
Table 2 – The demographics of the high fat group of subjects (HF) (female=13, male=12)
Methods
Measurement of skin pressure:
Vertical skin pressure was measured with the Tactilus pressure mapping system. The pressure sensors were 7.94 by 7.94 millimeters and were spaced at intervals of 4.5 by 4.5 millimeters. The sensor used by the Tactilus pressure system was a resistive strain gauge sensor. The pressure range was between 0-200 kPa. The thickness of the sensor was between 7 and 10 mms. The sensors were in an array of 512 sensors and each sensor wa
s scanned at ten times per second. Calibration was accomplished by the factory and was done internally by the computer system.
Measurement of Shear:
Shear was measured with a Tactilus (Sensor Products Madison, New Jersey) shear sensing system. This system was capable of measuring shear directly at the interface between two meeting surfaces. The sensor was a combination of two sensor elements; one measuring vertical pressure and the other a Piezo resistive sensors measuring shear. The total sensing area was 5.1 by 5.1 cm (2inches by 2 inches) and the force range for shear was 0-1.5 Newtons for the shear sensor. The pressure range for the associated lateral sensors was 0-50 kPa. The total grid size was 4 inches by 4 inches with sensing in the center. There were 16 discrete vertical pressure sensor points plus shear. Scan speed was 10 hertz. The thickness of array was 1.5 millimeters (58.5 mms). Accuracy stated by the manufacturer was +/- 10 % with repeatability of +/- 2 %. +/- 1.5 % linearity over the stated pressure range.
Measurement of skin and fat thickness:
Measurement of skin and fat thickness was accomplished on a 2-D ultrasound system manufactured by Sonasite Inc. (Brothel, Washington). The device, Sonasite 180 plus, provided an ultrasound signal at a frequency of 10 million Hertz. The ultrasound signal, reflected from the tissue below the probe, created a two dimensional picture to measure the thickness of skin and subcutaneous fat. Because of physical problems in measuring the thickness of skin near the surface of the probe, a one centimeter of standoff was used (Cone Instruments, Cleveland, Ohio). The probe was placed at an angle of 900 with respect to the skin and a linear probe was used. This probe had 95 separate ultrasound elements to provide a high resolution picture. To assure the greatest accuracy the measurements were done by one single investigator. The same investigator made measurements of skin and fat by an ultrasonic adaptor and then by dissecting the skin and fat on the cadaver to confirm the accuracy of the measurements.
Body Fat Content
Body fat content was measured by an impedance plethysmograph (RJL systems, Clinton TWP, MI).
Belt Pressure
Belt pressure was measured by a 4 strain gage pressure transducer integrated into a belt [Figure 1]. The belt force transducers output was conditioned with a strain gage amplifier (DA 100C BioPac Systems) with a frequency response flat from DC to 1000 Hertz and a gain of 5000. The output was digitized at 1000 samples per second with a 16 bit A/D converter on a BioPac MP100 system (BioPac Systems, Goleta California).
Exercise and movement
Eleven different exercises were used. These were meant to represent normal daily activities to see what these normal body movements would have on skin and belt tension. The exercises accomplished were:
- The subject stood and inhaled deeply.
- The subjects stood and exhaled deeply.
- The subject, from the standing position, flexed the hips until touching the toes with the hands (or as far to the ground as they could go).
- The subjects stood and rotated the upper trunk to the right as far as possible.
- The subject stood, then squatted down and lifting a 15 pound box off the floor with handles and placing it on a table at 1 meter height.
- The subject moved from standing to sitting in a chair with no back support.
- The subject started by sitting in a chair and then leaned back in a chair with a back rest
- The subject sat in a chair and flexed the trunk forward completely.
- The subject while in the sitting position, performed a side bend to the right and the left as far as possible
- The subject lay supine on a massage table.
- The subject while lying supine on a massage table did an abdominal crunch with knees bent and arms across the chest (standard sit up).
Measurement of Blood Flow
A single point infrared laser Doppler flow meter (TST 140 probe, LDF100 module, BioPac Inc., Goleta, CA) was used to measure the skin blood flow. The skin blood flow was recorded for 30 seconds. The flow meter had a head with an active area of 1 cm2. The probe was plugged into an LDF 100C amplifier and then digitized at 2000 samples per second with a 16 bit analogue to digital converter. The converted signal was then saved for final analysis with a BioPac MP 100 system (BioPac Inc, Goleta, CA). Behind the blood flow probe a load cell was placed to measure the force applied to the skin through the blood flow probe. The output of the strain gauge bridge was conditioned and amplified with a BioPac strain gage amplifier (DA 100C BioPac Systems) with a frequency response flat from DC to 1000 Hertz and a gain of 5000. The output was digitized at 1000 samples per second with a 16 bit A/D converter on a BioPac MP100 system (BioPac Systems, Goleta California).
Procedures
There were 2 series of experiments. The first series involved the subjects accomplishing the body movements described under methods equivalent to normal daily activities. In the second, pressure was applied at similar levels and blood flow was measured. Room temperature was constant for all experiments on all subjects at 22 degrees Celcius.
Series 1
The array of pressure sensors measured pressure on the back above, under, and below a leather belt that was 2 cm wide. The belt was adjusted by the subject so that tension was comfortable and at the same tension as they normally applied the belt on their pants in everyday life. Experiments were repeated twice on each subject. The first time, the sensors were the vertical pressure sensors and the second time the exercises were repeated, the shear sensors were used. Subjects accomplished the exercises for 1 minute and 1 minute was allowed between each exercise. The order was chosen at random with a statistical random number generator.
Series 2
The subject sat comfortably in the controlled environment room at 24°C for 20 minutes. Before any pressure was applied, baseline blood flow was taken. The laser Doppler flow probe was placed on the back 4cm lateral to the spine. The pressure array was placed on top of the probe and manual pressure was applied for 30 seconds while the blood flow was recorded. The pressure was removed for 30 seconds and the blood flow continued to record. Pressure was applied in a random order at 7.5, 15, 30, 45 and 60 kPa.
Data Analysis
Data analysis involved the calculation of means and standard deviations, related and unrelated T tests and Pearson Product correlation coefficients and partial correlation coefficients. The level of significance was p<0.05). Data from pressure sensors was averaged over 50 cells below the belt , 50 cells above the belt and 50 pressure cells under the belt, over the lower back. Shear sensor data was from 2 locations under and above the belt.
Results
Series 1
Belt tension- The results for the 2 groups of subjects are shown in Figures 2, 3 and 4 for the low body fat (LF) group and 5, 6 and 7 for the high body fat (HF) group. The tension recorded in the belt during the 11 movements is shown in figures 2 (LF) and 5 (HF). Belt tension before movement was 0.08+/-0.01 Newtons in the LF group before movement. However, for the HF group, resting tension was 5.3+/-2.8 Newtons. This difference between the groups was significant (p<0.01). Some individuals with a high body fat had resting forces as high as 11.4 Newtons. In fact, the correlation between resting belt pressure and body fat for the entire group was 0.92, a significant correlation; the greater the body fat, the tighter the belt was at rest. This same relationship was extended to the body movements studied here.
The greatest tension in the belt for both groups of subjects wa
s during an abdominal crunch. The lowest tension was during exhaling. While the pattern of responses was the same in both groups of subjects, belt tension during each movement was exaggerated in the HF group. For example, during a sit up, belt pressure was just 9.1+/-1.9 Newton’s in the LF group but was 88.1+/- 18.2 Newton’s in the HF group. The difference between pressures in the 2 groups of subjects was significant [p<0.01]. There was little variation in the LF group. But in the HF group, the individuals with the greatest body fat had the greatest belt tensions with belt tension, for an abdominal crunch reaching 180 Newtons in one individual.
When data was analyzed by partial correlation coefficients with age, diabetes and body fat being the 3 variables, the only significant correlation between belt tension was body fat- there was no significant correlation between age and diabetes and belt tension for any movement or at rest once body fat was removed as a variable p>0.05).
Shear Force
Similar results were seen for shear force as shown in Figure 3 for LF subjects and Figure 6 for HF subjects. With either group of subjects standing and not moving, there was no shear force recorded. During movement, there was only negligible shear force due to movement of the clothing above and below the belt, shear forces in the LF group being 0 Newtons and in the HF group averaging for all exercises 0.02+/-0.01 Newtons. But shear force under the belt during movement was greatest during touching of the toes as shown in Figures 3 and 6. Here the belt caused the greatest side to side movement for both groups of subjects. Abdominal crunches, a similar bending action at the waist, also showed high shear for both groups of subjects as seen in Figures 3 and 6. However, there were shear forces recorded for all body movements examined. The shear for any movement was significantly greater in the HF subjects than the LF subjects [p<0.01]. Shear in the HF group was as high, on the average, as 1 Newton. But some individuals with high body fat showed shear forces of 1.5 Newtons during abdominal crunches, tow touching and twisting. There were no significant partial correlation coefficients between age and diabetes and shear once body fat was removed. However, body fat was significantly correlated to shear for each body movement with the correlation averaging 0.81+/-0.12 for all subjects (p<0.01).
Skin Pressure
The vertical pressure on the skin above and below the belt in the LF and HF group was 0 kPa. But the vertical pressure on the skin under the belt was high in the HF subjects. In this group, pressures for the group were as high as 80 kPa compared to only 1 kPA in the LF subjects. These differences for each exercise were significant when comparing the LF and HF groups (p<0.01). But for individuals with greater body fat, there were even higher pressures where, for the person with the greatest body fat, pressure was over 150 kPa during laying supine and during crunches. There was no correlation between diabetes and age and pressure itself once body fat was removed but the correlation between body fat and pressure for the body movements pooled together was 0.84, a significant correlation (p<0.01).
Blood flow
When pressures were applied to the skin through a pressure cell and the skin blood flows were measured in the subjects, body fat itself was not correlated to blood flow if age and diabetes were removed as variables. But age and diabetes were both negatively correlated to skin blood flow at rest and during application of pressure. In general, the greater the applied pressure the less was the blood flow in the skin. After pressure was applied, the extent of reactive hyperemia was inversely related to the applied pressure; the greater the pressure, the greater the post pressure reactive hyperemia. Skin blood flows returned to normal within 1 minute post application for pressure. However, when the subjects were pooled by age, there was a difference between the groups. For the younger subjects, the blood flow at rest and after any pressure was greater (Figure 8) than for the older subjects and the subjects with diabetes.
Discussion
A natural protective mechanism exists in the skin to protect it from pressure damage [10, 11, 14]. This mechanism, mediated through voltage gated TRPV 4 channels in endothelial cells lining blood vessels, allows skin circulation to increase in response to mild pressure [15, 16]. Thus, when standing on the feet, pressure does not occlude skin circulation and cause skin damage that might occur if it weren’t for this mechanism. However, standing on the feet may not be the only source of pressure on the skin encountered in daily living.
Wearing tight clothing, especially during movement should also apply a pressure to the skin. The pressure might be both vertical and shear pressure. Vertical pressure would tend to occlude the circulation [10,11] while shear pressure has been shown to be a stressor on the dermal epidermal interface, and, in older people and people with diabetes can causes separation of these 2 skin layers and pressure sore formation [19,20].
In the present investigation, the greater shear and vertical pressure in overweight individuals during typical exercises might be expected. But the magnitude of these pressures was surprising. Pressures, both vertical and shear, were almost 10 fold higher on the average in the HF group than the LF group; but for some individuals with high BF, they were over 20 fold higher. When blood flow was measured at these same average pressures, it was almost occluded. For some individuals it was totally occluded in the skin. Thus, these high pressures may contribute to chaffing and damage to the skin in areas such as under the belt.
Making matters worse, for the older subjects, who generally have the higher body fat content, circulation was even poorer and easily occluded by pressure. Ageing is associated with a general senescence of the autonomic nervous system involving ganglionic damage, excessive free radical formation in vascular endothelial cells and reduced bioavailability of the vasodilator nitric oxide [9, 10, 11, 25, 26]. Further, there may also be reduced availability of l-arginine, the precursor of nitric oxide reducing blood flow even further [27].
These same groups of older overweight people are the same population with repeated back injury and soreness and frequent users of heat wraps worn under the belt. During activities of daily living, this makes them more susceptible to not only pressure injuries but also thermal injuries as well. Heat wraps depend on the circulation to remove heat [10,11]. As per the Pennes equation, without adequate removal of heat, thermal damage to the skin can occur [8].
The overall effect is that, in older overweight people there is a greater chance of skin damage due to the much higher pressures during normal daily exercise than would be seen in a thinner population. Extra care should be used in this population to keep belts loose or use wider belts to dissipate this pressure especially using devices such as lower back heat wraps.
Figure 1 – Belt pressure transducer
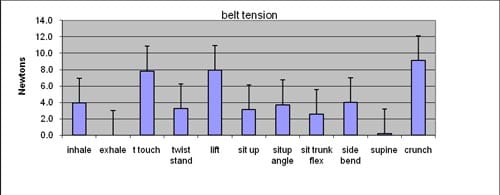
Figure 2- The tension recorded in the belt in Newtons during the body movements described under methods. Each bar graph is the average of 15 subjects +/- the SD. Data is shown for the low body fat group.
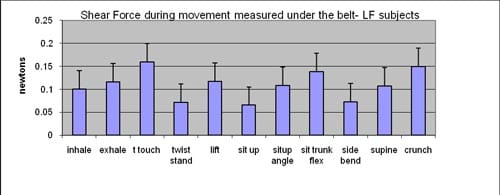
Figure 3- The shear force recorded under the belt in Newtons during the body movements described under methods. Each bar graph is the average of 15 subjects +/- the SD. Data is shown for the low body fat group of s
ubjects.
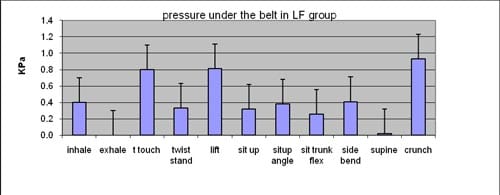
Figure 4- The pressure recorded under the belt in KPa during the body movements described under methods. Each bar graph is the average of 15 subjects +/- the SD. Data is shown for the low body fat group of subjects.
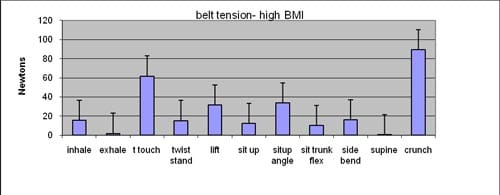
Figure 5- The tension recorded in the belt in Newtons during the body movements described under methods. Each bar graph is the average of 25 subjects +/- the SD. Data is shown for the high body fat group of subjects.
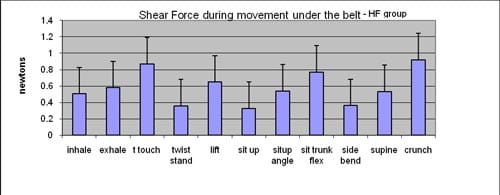
Figure 6- The shear force recorded under the belt in Newtons during the body movements described under methods. Each bar graph is the average of 25 subjects +/- the SD. Data is shown for the high body fat group of subjects.
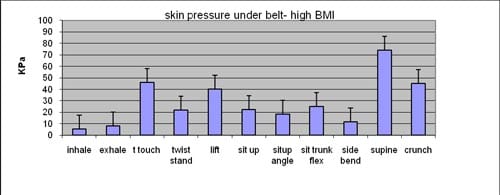
Figure 7- The pressure recorded under the belt in KPa during the body movements described under methods. Each bar graph is the average of 25 subjects +/- the SD. Data is shown for the high body fat group of subjects.

Figure 7- The pressure recorded under the belt in KPa during the body movements described under methods. Each bar graph is the average of 25 subjects +/- the SD. Data is shown for the high body fat group of subjects.
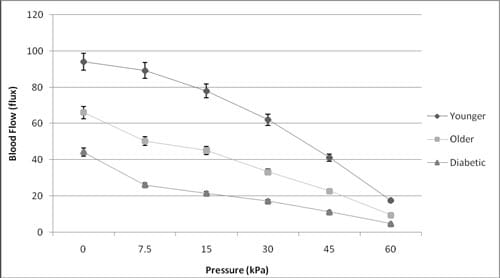
Figure 8- The relationship between applied skin pressure and the skin blood flow in younger (n=12) and older subjects (n=16) and subjects with diabetes, n=12) +/- the standard deviation.
REFERENCES
- Webster B S, Verma S K, Gatchel R J. Relationship between early opioid prescribing for acute occupational low back pain and disability duration, medical costs, subsequent surgery and late opioid use. Spine. 2007;32(19):2127-32.
- Kim P, Hayden J A, Mior SA. The cost-effectiveness of a back education program for firefighters: a case study. J Can Chiropr Assoc. 2004; 48(1):13-9.
- Dawson A P, Mc Lellan S N, Schiller S D, Jull G A, Hodges P W, Stewart S. Interventions to prevent back pain and back injury in nurses: a systematic review. Occup Environ Med. 2007 Oct;64(10):642-50
- Stitik T P, Chang M Y, Levy J, Nadler S F. Occupational low back pain. Clin Occup Environ Med. 2006;5(3):545-69, v-vi.
- Pensri P, Foster N E, Srisuk S, Baxter G D, Mcdonough S M. Physiotherapy management of low back pain in Thailand: a study of practice. Physiother Res Int. 2005;10:201-12.
- Chok B, Lee R, Latimer J, Tan S B. Endurance training of the trunk extensor muscles in people with subacute low back pain. Phys Ther. 1999;79(11):1032-42.
- Feldman KW, Morray JP, Schaller RT. Thermal injury caused by hot pack application in hypothermic children. Am J Emerg Med. 1985 Jan;3(1):38-41
- Pennes HH. Analysis of tissue and arterial blood temperatures in the resting human forearm. 1948. J Appl Physiol. 1998 Jul;85(1):5-34
- Petrofsky JS, McLellan K, Bains GS, Prowse M, Ethiraju G, Lee S, Gunda S, Lohman E, Schwab E. Skin heat dissipation: the influence of diabetes, skin thickness, and subcutaneous fat thickness. Diabetes Technol Ther. 2008 Dec;10(6):487-93.
- Petrofsky J S, Bains G S, Prowse M, Mc Lellan K, Ethiraju G, Lee S. The influence of age and diabetes on the skin blood flow response to local pressure. Med Sci Monitor 2009A Jul;15(7):CR325-31
- Petrofsky J, Bains G, Prowse M, Gunda S, Berk L, Raju C, Ethiraju G, Vanarasa D, Madani P. Dry heat, moist heat and body fat: are heating modalities really effective in people who are overweight? J Med Eng Technol. 2009B;33(5):361-9.
- Ng EY, Chua LT.Prediction of skin burn injury. Part 2: Parametric and sensitivity analysis. Proc Inst Mech Eng [H]. 2002;216(3):171-83.
- Jiang SC, Ma N, Li HJ, Zhang XX. Effects of thermal properties and geometrical dimensions on skin burn injuries. Burns. 2002 Dec;28(8):713-7.
- Mayrovitz HN, Macdonald J, Smith JR.. Blood perfusion hyperaemia in response to graded loading of human heels assessed by laser-Doppler imaging. Clinical Physiology. 1999 19(5), 351-359.
- Garry A, Sigaudo-Roussel D, Merzeau S, Dumont O, Saumet JL, Fromy B. Cellular Mechanisms Underlying Cutaneous Pressure-Induced Vasodilation: In Vivo Involvement of Potassium Channels. Am J Physiol Heart Circ Physiol, 2005; 289 H174-H180.
- Fromy B, Abraham P, Samuet JL. Non-nociceptive capsaicin-sensitive nerve terminal stimulation allows for an original vasodilatory reflex in the human skin. Brain Res,1998; 811:166-168.
- Fromy B, Merzeau S, Abraham P, Saumet JL: Mechanisms of the Cutaneous Vasodilator Response to Local External Pressure Application in Rats: Involvement of CGRP, Neurokinins, Prostaglandins and NO. Br J Pharmacol, 2000; 131: 1161-1171.
- Charanya G, Patil KM, Narayanamurthy VB, Parivalavan R, and Visvanathan K. Effect of Foot Sole Hardness, Thickness, and Footwear on Foot Pressure Distribution Parameters in Diabetic Neuropathy. J Engineering in Medicine, 2004; 218: 431-443.
- Garber S L, Rintala D H. Pressure ulcers in veterans with spinal cord injury: a retrospective study. J Rehabil Res Dev. 2003;40(5):433-41.
- Zimny S, Dessel F, Ehren M, Pfohl M, Schatz H. Early detection of microcirculatory impairment in diabetic patients with foot at risk Diabetes Care. 2001 Oct;24(10):1810-4
- Keller B P, Willie J, van Ramshorst B, van der Werken C. Pressure ulcers in intensive care patients: a review of risks and prevention. Intensive Care Med. 2002;28(10):1379-88.
- Purdue G F, Hunt J L, Lang E D. Obesity: a risk factor in the burn patient. J Burn Care Rehabil. 1990;11(1):32-4.
- Haik J, Liran A, Tessone A, Givon A, Orenstein A, Peleg K; Israeli Trauma Group.Burns in Israel: demographic, etiologic and clinical trends, 1997-2003. Isr Med Assoc J. 2007 Sep;9(9):659-62.
- Akerlund E, Huss FR, Sjöberg F.Burns in Sweden: an analysis of 24,538 cases during the period 1987-2004. Burns. 2007 Feb;33(1):31-6.
- Tafeit E, Greilberger J, Cvirn G, Lipp RW, Schnedl WJ, Jürimäe T, Jürimäe J, Wallner-Liebmann SJ. Estimating DXA total body fat percentage by lipometer subcutaneous adipose tissue thicknesses. Coll Antropol. 2009 Jun;33(2):391-6.
- Huxley R, Mendis S, Zheleznyakov E, Reddy S, Chan J. Body mass index, waist circumference and waist:hip ratio as predictors of cardiovascular risk-a review of the literature. Eur J Clin Nutr. 2009 Aug 5. [Epub ahead of print]
- Yi J, Horky LL, Friedlich AL, Shi Y, Rogers JT, Huang X. L-arginine and Alzheimer’s disease. Int J Clin Exp Pathol. 2009;2(3):211-38
![]()