

Article
Related Links
Patrick J. Golden*
* Tel.: +1 937 255 5438; fax: +1 937 656 4840.
E-mail address: [email protected]
This article appeared in a journal published by Elsevier. The attached copy is furnished to the author for internal non-commercial research and education use, including for instruction at the authors institution and sharing with colleagues.
Other uses, including reproduction and distribution, or selling or licensing copies, or posting to personal, institutional or third party websites are prohibited.
In most cases authors are permitted to post their version of the article (e.g. in Word or Tex form) to their personal website or institutional repository. Authors requiring further information regarding Elsevier’s archiving and manuscript policies are encouraged to visit: https://www.elsevier.com/copyright
Abstract
A unique dovetail fretting fatigue fixture was designed and evaluated for testing turbine engine materials at room or elevated temperatures. Cold section and hot section materials from military turbojet engines were chosen for testing. These included Ti-6Al-4V, Rene’88DT, and Rene’N5. The new fixture was improved over a previously used dovetail fretting fatigue fixture by including instrumentation for direct measurement of the normal contact force, alignment control, and elevated temperature capability. Measurement of the shear component of the contact force was validated through an alternative instrumentation method. Investigation of the thermal gradient in the specimen and pads was conducted. Initial test results revealed interesting variability in the behavior of the nickel based superalloy specimens at elevated temperature.
Keywords — Fretting, Dovetail, Ti-6Al-4V, Nickel based superalloy, Elevated temperature
1. Introduction
Fatigue failures and high maintenance costs caused by fretting are a major concern in aircraft structures. Fretting occurs when two members are pressed together in contact and have a small oscillating relative displacement [1,2]. The wear and very high local stresses that occur near the edge of contact results in the nucleation of cracks and the reduction of the fatigue life of the material. Common locations of fretting damage in aircraft include lap joints of aircraft structures and at the dovetail blade and disk attachment in turbofan engines. Additionally, fretting in dovetail joints has been recognized as one of the costliest sources of in-service damage related to high cycle fatigue (HCF) in the US Air Force [3].
The objective of this work was to investigate fretting in a dovetail or fir tree type attachment that could be found in the fan, compressor, or turbine stages of a turbojet engine. A new testing apparatus has been developed to allow cyclic loading of a dovetail shaped specimen. This geometry results in the application of simultaneous cyclic normal and shear loading at the contact interface. Both room temperature and elevated temperature testing were conducted on Ti-6Al-4V and a Nickel based superalloy Rene’ 88DT, respectively. The fixture was designed to directly measure the contact forces on the specimen which was an improvement over previous dovetail fixtures [4,5]. In particular, the fretting pad holder design resulted in approximately 95% of the normal load transfer to a load cell while carrying the shear force. Also, the replaceable fretting pads provide a significant cost advantage to replacement of entire dovetail fixtures after each test. Finally, elevated temperature test capability was added for test temperatures of 650 °C and higher. Testing and analysis was conducted on Ti-6Al-4V and Rene’88DT specimens and pads. Finite element method (FEM) analysis was used to confirm the measured contact loads and understand the behavior of the test.
2. Experimental procedures
2.1. Apparatus
Two sets of material have been used for this study. The first was a Ti-6Al-4V forged plate used in the US Air Force National High Cycle Fatigue Program. This material was tested at room temperature and was representative of materials found in the cooler sections of the turbofan engine such as the fan and early compressor stage blades and disks. The material was α + β forged then heat treated at 927 °C for 1 h, fan air cooled, and stress relieved at 704 °C for 2 h. The resulting microstructure was bimodal with a primary alpha grain size of approximately 20 μm (60% volume fraction) and the balance was lamellar α + β. This microstructure can be seen in Moshier et al. [6]. This material was used for both the specimen and pad in the room temperature tests. The second set of materials was chosen for the elevated temperature testing and is representative of a turbine disk and blade pair. The specimen was machined from a forged disk made from a powder processed superalloy Rene’88DT. Details of this material can be found in Caton et al. [7]. The specimens were machined from the outer rim of the disk. The fretting pads paired with this specimen were machined from a single crystal alloy, Rene’N5, cast in an approximately 16 x 57 x 145 mm slab. Further details of this material can be found in [8,9]. The pads were machined from the slabs with the pressure face normal oriented along the growth [100] direction of the crystal. The 12.7 mm height direction of the pad was oriented in the thickness direction of the slab. Details of the specimen and pad geometry will be discussed below.
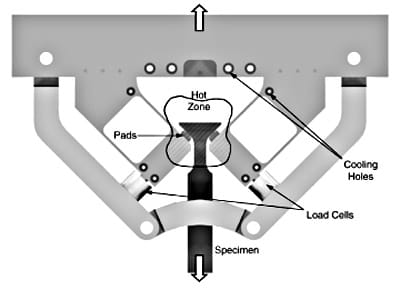
Fig. 1. Drawing of the elevated temperature dovetail fretting fatigue fixture.
There were two primary motivations for a new fretting fatigue fixture to test dovetail type specimens. First, improved methods of instrumentation and alignment were needed. The previous dovetail fretting fatigue fixture [4,5] was machined from a steel plate leaving little flexibility for alignment of the pad–specimen interface or for direct measurement of the contact loads. Second, an elevated temperature capability was needed for the application of interest. Heating an elevated temperature version of the previous dovetail fretting fatigue fixture was considered, however, instrumentation would have been difficult. A new dovetail fretting fatigue fixture was designed and machined as shown in the Fig. 1 drawing. This design is composed of several parts. The top piece is a 50.8 x 63.5 x 381 mm steel beam that serves as the base for the other components of the fixture and attaches to the load cell and top of the servo-hydraulic test frame by a threaded rod. The outer truss structure is mad
e of 25.4 x 38.1 mm cross-section steel members linked by 1/2 in. shoulder bolts. The inner structure has two IN718 pad holders which are each bolted to the base structure by four 3/8–24 bolts. The pad holders have a slot machined to accept the fretting pads shown in Fig. 2 and described below. The central part of the pad holders are composed of two 2.5 mm thick webs. The webs are designed so that the pad holders are stiff in the transverse or shear loading direction, but compliant in the normal loading direction. Behind each pad holder is a miniature 45 kN load cell that supports the normal component of the contact load. This mini-load cell transferred the normal component of contact force from the pad holder to the outer truss structure and measured it in the process. In order to remove any slack in the system, a small plate and a 3/4″ set screw is located behind each mini-load cell that allowed the system to be preloaded by tightening the set screws. Finally, heating of the specimen and pads is achieved through the use of furnace igniters mounted on both sides and surrounded by ceramic blocks and insulation. Temperature is controlled using thermocouples and a Barber–Coleman controller to modulate the current to the igniters.
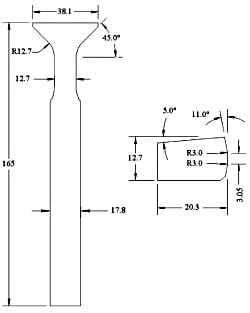
Fig. 2. Drawing and dimensions (mm) of the fretting specimen and pad.
The specimen design was developed from previous work [5] and modified slightly with a longer grip section to fit the new fretting fatigue fixture. It is shown in Fig. 2. The fretting pad design was a scaled down version of that used by Murthy et al. [10]. Both the specimen and the pad are 7.62 mm thick. The pad has a 5° taper which is matched by the slot in the pad holder discussed above. This taper allows the pad to become wedged into the slot and eliminate further slipping of the pad in the pad holder during the test. The contact profile chosen for this study was flat with rounded edges. The flat length is 3 mm and has 3 mm blending radii to an 11° taper. This type of rounded flat contact profile was representative of the interface between an engine blade and disk. Six Ti-6Al-4V specimens and 12 pads were machined for room temperature testing to compare to previous work on other fretting fatigue fixtures. Twenty-four Rene’88DT specimens and forty-eight Rene’N5 pads were machined for elevated temperature testing. Four of the Ti-6Al-4V specimens and six of the Rene’88DT specimens have been tested. Testing was conducted with constant amplitude loading at a remote load ratio of 0.1. All tests were performed at 20 Hz to match the previous room temperature Ti-6Al-4V testing, and to develop an initial load-life curve for Rene’88DT. Future tests with Rene’88DT are planned at both 20 Hz and 0.33 Hz (20 cpm) to study frequency effects.
Viewing the test setup one might conclude that the specimen represents the blade and the pad and fixture represent the disk. The test setup, however, is limited in the type of loads that can be applied and only the specimen has stresses that are representative of what is seen in either a blade or disk contact region. Microcracking may occur in the fretting pads, but the cracks will not grow to failure. So, if one was interested in studying fretting cracks in a turbine engine disk material such as Rene’88DT the natural choice would be to make the specimens from the disk material and the pads from the blade material, as was done in this study.
2.2. Symmetry and alignment
Achieving satisfactory symmetry and alignment of this system, as with any fretting apparatus, required a difficult procedure. A major advantage of this dovetail fretting setup over prior designs was that the ability to adjust the fixture to improve alignment was designed into the system. Although symmetry of the specimen and fixture about the loading direction was necessary for good alignment it was not sufficient. Several steps and checks, therefore, were performed to ensure the best possible results were achieved. A summary of this procedure is described here.
First, the entire load train was aligned in the MTS test machine. Two cylindrical rods were used; one threaded to the bottom of the base of the fixture and the other gripped in a hydraulic collet grip attached to the actuator. The two rods were aligned using an MTS 609 alignment fixture which can remove both concentric and angular misalignments. After the load train was satisfactorily aligned, the rest of the fretting rig was installed as shown in Fig. 1. The design of the system allowed the gap between the two pad holders to be adjusted. Their placement was carefully adjusted using precision depth gauges to ensure they were symmetric before bolting them in place. Next, the 3/4 in. set screws below the miniature load cells were incrementally tightened to preload them into compression. The set screws were adjusted until the mini-load cells read the same preload to within less than 1%. The typical value of preload was 2 kN compression. This forced the pin joints in the truss to tighten and remove any looseness in the system that could negatively affect the test. Finally, the specimen was gripped into hydraulic wedge grips using guides and depth gauges preset to ensure the specimen was aligned with the centerline of the fixture.
At this point in the setup process the system is as symmetric and grossly aligned as possible, however, this does not ensure fine alignment of the contact surfaces. Alignment of the contact surfaces was checked using pressure sensitive Fuji prescale film. This film is available in varying levels of pressure sensitivity. The intensity of the red color in the film is proportional to the pressure applied. The film was cut into small strips and placed between the contact pads and specimens. A small load was then applied and the film read. Small misalignment could be interpreted from the pattern on the film. This type of misalignment could be corrected by another set of hardware attached to the system, alignment plates. Four alignment plates were attached to the base beam as shown in Fig. 3, one on each side of the pad holders. Each plate had two set screws that could be used to adjust the position of the pad holders and thus the alignment of the contact. Adjustments were made until the pattern on the prescale film showed satisfactory alignment at which point the bolts holding the pad holders were fully tightened.
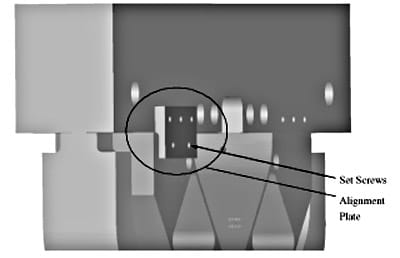
Fig. 3. Drawing of one of four alignment plates used to align the contact specimen and pad.
2.3. Load transfer
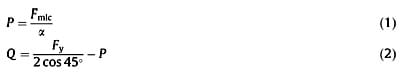
As described above, miniature load cells were used to carry the normal contact force from the contact interface to the outer structure of the fretting rig. One hundred percent of the normal force cannot transfer through to the load cells, since a portion of the normal force was carried by bending of the pad holder webs. An FEM model of the pad holders (described below) was created to calculate the load transfer ratio to the load cells. The load transfer calculation defines the relationship between the normal contact force, P, and the measured load in the miniature load cell, Fmlc. This relationship is defined by Eq. (1) where α is the fraction of normal load transferred to the load cell and was calculated to equal 0.95 from the FEM results. Additionally, the shear force, Q, between the specimen and the pad could be calculated with Eq. (2) from the applied remote load, Fy, and P. Symmetry must be assumed in this calculation so that the remote vertical force was equally divided between the left and right contacts. The actual maximum differenc
e measured between left and right mini-load cell for each test ranged from 2% to 5.5%. This means that the maximum difference from the average mini-load cell value ranged from 1% to 3%. In practice, the average value from the two miniature load cells was used in Eq. (1), however, it was important to consider the level of symmetry when considering error estimates for the contact forces. Additionally, an important measure of symmetry was the relative appearance of wear scars from each side. After each test, wear scars were photographed and examined. Some of the wear scars have shown problems with scar shape indicative of misalignment, but the misalignment was of the type correctable using the alignment plates. So far, no scar patterns appeared that were indicative of symmetry problems that could be correlated to the measured values from the mini-load cells.
A method of validating the actual value of a was desired to confirm that accurate contact forces were acquired for the tests. An ideal method of validating α would have been to place a second pair of mini-load cells on the opposite side of the pad holders, then apply the contact forces and measure the level of load transfer. No method of performing this validation test was found, however. Instead, an indirect check of α was performed by experimentally determining the shear force transferred through the pad holder webs. The thin webs on one of the fretting pad holders were instrumented with strain gages on the front and back of both webs. The gages were placed at equal positions along the length of the webs and configured in four separate quarter bridges which allowed the average axial strain in each web to be calculated. The results were then used to calculate the axial force transferred through the pad holder webs as shown in Eq. (3). Here, E is Young’s Modulus, A is the total cross-sectional area of both webs, and εi are the strains. A simple free body diagram shows that the sum of the axial force in the webs is equal to the shear contact force, Q, minus a small amount of shear load transfer through the mini-load cell. This was an unknown error that was assumed to be small. The surfaces of the mini-load cell were greased in an attempt to reduce shear load transfer.
The results from a strain gage instrumented experiment were plotted in Fig. 4. The maximum difference in shear load and the difference in slope from perfect agreement were each approximately 5%. A value of a was then back calculated using the result of Eq. (3) and Eqs. (1) and (2). Three repeated experiments resulted in values of α equal to 0.94, 0.96, and 0.97. These experiments appeared to give estimates for a that were very consistent with the FEM calculated value. Upon further examination of this approach, however, it was found that the estimate of α was relatively insensitive to the strain gage measured value of Q. More importantly, what has been learned from these equations is that the calculated value of shear force, Q, is quite sensitive to the assumed value for α. A 1% change in α resulted in a 2.9% change in the calculation of Q for this particular case. Other tests were analyzed and the sensitivity to a 1% change in a varied from 1.8% to 3.0% and depended on test conditions. This means that when calculating contact forces in future tests, careful consideration will have to be made to obtain error estimates of Q. This is particularly important when using results of these experiments for the evaluation of life prediction models. The error in the normal force, P, was approximately equal to the error in the estimate of α.
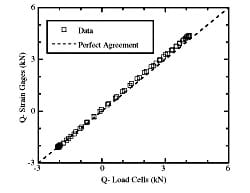
Fig. 4. Comparison of shear force measurements, Q, by two different methods.
2.4. Elevated temperature
Heating of the specimen and pads was provided by a pair of ceramic hot surface furnace igniters equally positioned on the front and back faces of the specimens. The Saint-Gobain Crystar® type N igniters were mounted to lightweight ceramic plates which were in turn attached to the steel beam base. The open voids above and around the specimen were filled with ceramic fiber insulation to retain heat, maintain stable specimen temperature, and protect the steel base. Multiple cooling holes in the fixture were used to circulate cooling water. This protected the load cells and steel components from the heat. The specimen temperature was controlled by a thermocouple and a Barber–Coleman closed loop controller which provided power to the igniters. A temperature gradient was expected to form in the contact region.
An experiment was conducted to calibrate the contact region temperature with the control thermocouple location and to investigate temperature gradients in the specimens and pads. Multiple thermocouples were applied to a Rene’88DT specimen and Rene’N5 pad as shown in Fig. 5. The positions of the thermocouples relative to the contact interface were listed in Table 1. Application of a thermocouple near the high stress edge of contact region would be avoided during a test, so position 1 was chosen for test control. During the test, however, the desired test temperature should be maintained in the contact region, position 4. The mean load from a typical constant amplitude test was applied to establish contact between the specimen and pads and permit heat conduction. The system was heated and allowed to stabilize for approximately 1 h. The power to the igniters was then adjusted slightly until the temperature in the contact region of the specimen reached the desired test temperature of 650 °C. Future tests were then controlled by raising the control thermocouple (position 1) to 695 °C as shown in Table 1. Within 1–2 mm of the contact the temperature increased 12–18 °C. Even more dramatic was the 140 °C temperature drop across the contact interface. The fretting pads received less radiant heat from the igniters and they were mounted in the cooled pad holders. Although an attempt was made in the design to reduce this temperature difference by placing the water cooling holes in the pad holders as remotely as possible the pad holders still behaved as a heat sink.
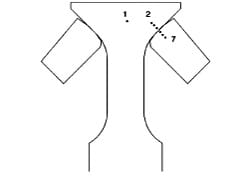
Fig. 5. Schematic of dovetail specimen and pads along with thermocouple locations.
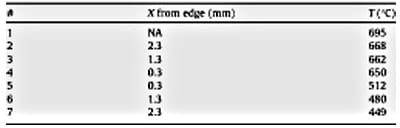
Table 1. Thermocouple locations and temperatures for a target test temperature of 650 °C
3. Modeling
Modeling of the fretting test setup was performed for two distinct purposes. First, a parametric design study of the pad holders was performed to finalize the overall design of the test system. This will be discussed briefly. Second, a 2-D contact analysis was conducted. The contact analysis allowed contact forces to be predicted given an assumed or measured value of the coefficient of friction. Also, contact and bulk stresses could be extracted from the results and used for life prediction analysis.
3.1. Fixture design
Rather than
model the entire system, several boundary conditions were used to represent the system. The model is shown in Fig. 6. First, symmetry was imposed. Second, rather than model the attachment of the pad holder to the base it was assumed to be nearly rigid and a fixed boundary condition was applied at the top edge of the pad holder. Finally, the load cell and outer truss were represented by a spring that accounted for their stiffness. The stiffness of this spring was determined to be 7.50 x 10⁷ N/m. The load cell stiffness was measured experimentally on a hydraulic load frame and the stiffness of the truss (under pre-load) was calculated using FEM to be greater than 10 times that of the load cell. The model shown in the figure was used for contact, but for this analysis the specimen was removed. Instead, a normal force in conjunction with a shear force was applied to the fretting pad and the force in the spring was determined to equal approximately 95% of the applied normal force. This result was used in the previous section.
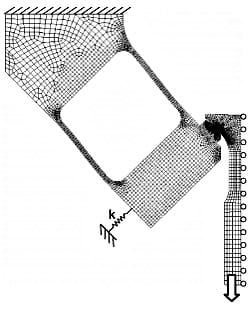
Fig. 6. Finite element mesh used for contact modeling and for
design of the pad holder (displacement scaling of 30x).
3.2. Contact analysis
The mesh shown in Fig. 6 was also used to perform a contact mechanics analysis on the pad and specimen interface with the FEM software ABAQUS. The model was initially exercised with Ti-6Al-4V specimens and pads to simplify the analysis since the material is isotropic and the testing was at room temperature. The average coefficient of friction μ was an additional input to this analysis. It varied from 0.3 to 0.75 and was determined empirically from test data. A typical value of μ for Ti-6Al-4V from this test setup was 0.7. The average value of μ can be measured experimentally as described in the following section. Three load steps were used for this analysis (max, min, and max). The loads were applied remotely as a pressure on the bottom edge of the specimen. The output of this analysis included the pressure and shear tractions and the peak stresses at the edge of contact. These tractions were then integrated to determine the normal, P; shear, Q; and moment, M at each load step and increment in the analysis. Fig. 7 is an example of Q versus P for an analysis with μ = 0.7. The solid line with squares is the result from the FEM analysis. Each square represents one of the 20 equally spaced time increments for each load step. The dashed lines bound the values of Q such that |Q| ≤ μP. When |Q| = μP the dovetail specimen was in gross slip and was either sliding out or sliding in for loading that was either increasing or decreasing respectively. Between the bounds the contact condition was partial slip. Experiments and analysis have shown that a characteristic value of the slope dQ/dP exists during partial slip and it is dependent on the specimen and fixture geometry and stiffness. In this case the value of dQ/dP = 2.30. This slope was constant whether loading or unloading so long as the contact was in partial slip.
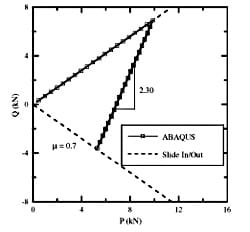
Fig. 7. Example of a shear, Q, versus normal, P, contact force plot.
The contact element mesh size was varied so that a simple convergence study could be performed. The results of this study are reported in Table 2. Contact element size was decreased by factors of approximately two, except the first step which was by a factor of four. Three different model outputs were reported here: the peak tangential component of stress at the edge of contact, the peak value of pressure, and the slope dQ/dP during partial slip. The results in Table 2 were normalized by the value of the most refined mesh. This does not presume that the most refined mesh shown was converged. In fact, the peak stress changed by 20% in the last two increments in element size. The model was, therefore, not yet converged for the peak stress. The pressure peak only changed by approximately 1% between the last two element sizes and, therefore, it appeared to be converged. Fig. 8 is a plot of the pressure traction at the maximum applied force for three mesh sizes. Clearly the coarsest mesh with only 16 elements in contact did not capture the correct pressure distribution, however, the 25 μm element size was quite close to the 5 μm result. The shear tractions showed the same trend. The most interesting result, however, was that the model was converged in terms of contact forces with relatively few elements. Even with just 16 elements in contact the calculations for the forces showed only a 1.3% error with the converged values.
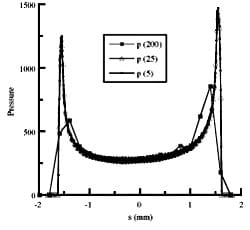
Fig. 8. Comparsion of the pressure tractions for meshes
with 200 μm, 25 μm, and 5 μm contact element sizes.
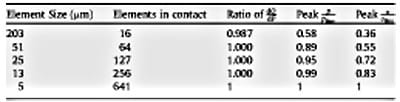
Table 2. The convergence study showed dramatically different conclusions for load, pressure, and stress.
The experimentally measured value of partial slip dQ/dP was dependent on the assumed value of load transfer, α. The load transfer assumption could, therefore, potentially be validated by comparing experiment with contact model results. In this case, it was also of interest to see the influence of elevated temperature test conditions on the contact force history. The FEM model was setup with the temperature dependent material properties for the Rene’ 88DT specimen, Rene’N5 pad, and the IN718 pad holder. At room temperature with these materials the predicted value of dQ/dP equaled 3.15. Note that this value is significantly different than the Ti-6Al-4V room temperature dQ/dP value of 2.30. This illustrates the sensitivity of the contact forces to the relative stiffness of the fixture and specimen. An elevated temperature test was conducted and the pad holder, specimen, and pads were probed at multiple points to develop a temperature gradient. These temperatures were input into the model as initial conditions and the predicted dQ/dP changed from 3.15 to 3.01. The experimentally observed value of dQ/dP was 2.96 for α = 0.95 for a 1.6% difference with the model. If this model and experiment were used to calibrate α, the resulting value of α would equal 0.967. This was found to be a potential method of calibrating for α and thus reduce some of the uncertainty in Q discussed in the previous section.
4. Results and discussion
The results of the room temperature Ti-6Al-4V and elevated temperature Rene’88DT dovetail fretting fatigue tests are reported in Fig. 9. All tests were conducted with constant amplitude loading with remote load ratio, R = 0.1. The lives of the four Ti-6Al-4V specimens ranged between 40,000 and 600,000 cycles. The six Rene’ 88DT specimen results included run-outs at 18 kN and 20 kN, two repeats at 24 kN, and failures at 28 kN and 32 kN. Although only two repeats were performed at 24 kN, the results show a wide scatter with failure ranging between 118,40
0 and 1.38 million cycles. One of the objectives of future testing will be to measure variability in the life and to study the sources of that variability. Ten to fifteen repeated tests will be performed at the same maximum load, load ratio, temperature, and frequency. Variables that will be studied include the measured contact loads, the average coefficient of friction, the evolution of the loads and coefficient of friction over the course of the test, and the resulting damage and crack formation. Some initial study of variability between the tests performed at 24 kN will be discussed below.
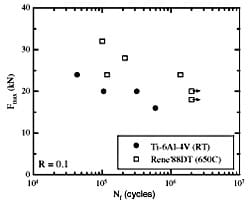
Fig. 9. Test results from dovetail fretting fatigue fixture
for Ti-6Al-4V at room temperature and Rene’88DT at 650 °C.
Fig. 10 is a plot of the shear force Q versus the normal force P for a Ti-6Al-4 V test. The solid line trace represents a few cycles of data recorded early in the experiment after the coefficient of friction had stabilized. The open squares are numerical results from the ABAQUS FEM model of the contact. The dashed lines represent the bounds of possible Q and P combinations defined by |Q| ≤ μP, where μ is the average coefficient of friction. The initial ramp up in load occurred under gross slip as shown by the FEM results. This ramp up is also observed experimentally (not shown) and represents the average coefficient of friction, μ = Q/P during gross slip. The dovetail specimen became wedged between the pads in the same manner as a turbine blade in a disk dovetail slot. Once the load reversed the dovetail remained wedged in place and the contact changed to partial slip. Fig. 9 shows that the FEM model matched the experimental value of partial slip dQ/dP very well. In this test, the contact remained in partial slip throughout the remainder of the test. If unloading were to continue (reduction in R) or if the coefficient of friction were to decrease, the contact would return to gross slip. The offset between analysis and experiment in this case was due to a slight change in μ over the course of the experiment. Both curves were plotted for the same specimen applied force, but a change in the initial μ results in a slightly different path in the experimental results. This changing μ could be modeled in ABAQUS if desired, but the simplest modeling approach of a constant μ was chosen.
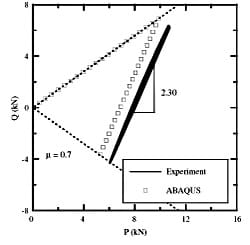
Fig. 10. Ti-6Al-4V FEM results compared to test results.
Note the very close match between the test and model Q versus P slopes during partial slip.
Fig. 11 is an example of Q versus P for a Rene’88DT specimen, identified as 05-952, with a maximum load of 24 kN and R = 0.1. The test lasted 118,400 cycles and was in partial slip throughout the test. The maximum value of Q/P during the test was 0.75 which bounded the average coefficient of friction, μ ≤ 0.75. The second set of data on this plot, which was measured at 118,000 cycles, clearly shows a change in slope and a curvature in the load path. This resulted from the change in compliance of the specimen due to a crack growing from the edge of contact on one side of the specimen. This effect was measurable and was used to detect cracks for all tests. A second Rene’88DT specimen (05-955) was also tested with a maximum load of 24 kN and R = 0.1. It survived early failure and failed at 1.38 million cycles. It was not clear why these two specimens exhibited such wide scatter. Unfortunately, reliably contact force history data was not available for the majority of the long life test. Future testing will collect this data to allow further investigation.
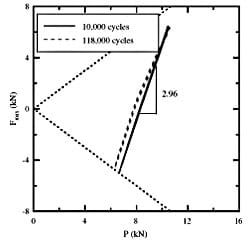
Fig. 11. Q/P load history for test (05-952) that formed a large crack and failed at 118,400 cycles.
To help understand the long life data, the run-out tests were more closely examined. Fig. 12 is a plot of three Q versus P load traces at various times during the 20 kN run-out experiment (05- 953). Initially (1000 cycles), the load trace was very similar to specimen 05-952 but with a slightly different Q versus P slope during partial slip. As the test progressed, however, the load trace began to change. After 1 million cycles the load trace had moved to higher values of Q and lower P and the load trace was an open loop rather than a straight line. By the end of the test, at 2 million cycles, the load trace indicated a classic gross slip hysteresis. The average coefficient of friction had dropped from 0.75 to 0.5 and gross slip was occurring on each cycle. This type of contact behavior was likely to be more damaging in terms of wear, in fact, relatively large amounts of wear debris were observed post test. This behavior may also be less favorable to crack initiation and growth.
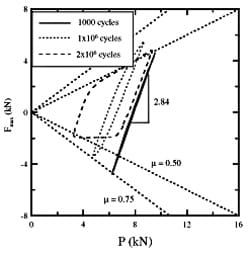
Fig. 12. Q/P load history for a run-out specimen (05-953).
Figs. 13 and 14 are photographs of the fretting scars from two of the specimens discussed above (05-952 and 05-953). Specimen 05-952, which failed early, had a racetrack pattern type of scar. Dark bands around the edges of contact indicate wear in the slip zones which surround the contact patch during partial slip conditions. Specimen 05-953, however, was a 2 million cycle run-out that did not form a crack that grew to failure. The wear scar, like the load traces, indicated more severe damage throughout the contact patch due to gross slip or fretting wear. It was unclear why these two specimens that were tested with identical materials, temperatures, and frequencies behaved so differently. It seemed that if the test did not form a crack early in life the surface interaction changed. This was likely due to lubrication of the interface with the build up of oxidation and fretting debris. Planned analysis of the stress, fatigue, and crack growth of these specimens will help improve understanding of the life variability.
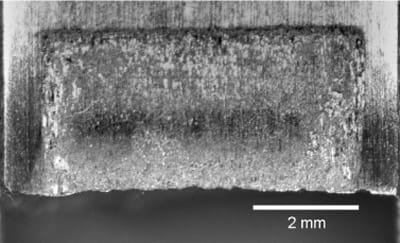
Fig. 13. Fretting scar for specimen 05-952 showing typical partial slip fretting scar.
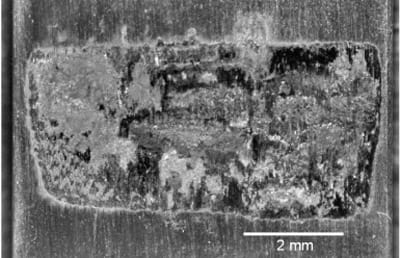
Fig. 14. Fretting scar from specimen 05-953 showing wear damage due to gross slip after 2 million cycles.
5. Conclusions
A unique dovetail fretting fatigue experimental setup was developed to study fretting of turbine engine materials. The design of this experimental work built on the capabilities of previously developed systems. Important capabilities added to this system included heating elements capable of simulating conditions in the attachment region of a turbine rotor. Also, direct force measurements of the contact forces were obtained through
small load cells mounted in the fixture. Fine tuning of the alignment between the specimen and pads was possible with set screw adjustment of the pad holder orientation. Analysis of the behavior of the specimen and fixture showed that the contact force measurement was sensitive to a model parameter that has not been fully validated. Also, symmetry of the system was found to be critical, and although symmetry was quantified through the mini-load cell measurements, its influence on the contact force calculations also has not been fully validated. These issues must be carefully considered when using contact forces from this fixture for life model validation. Despite these limitations, the current dovetail fretting fixture was an improvement over the previous fixture it replaced in terms of alignment, contact force measurement, and elevated temperature capability.
Several conclusions could be made from the initial tests that have been conducted with this new system. First, the specimens fail at the expected location and the fretting scars appeared as expected. The elevated temperature system worked and satisfactorily controlled the temperature of the specimens near the contact interface. The initial set of Rene’88DT tests had interesting results including large variability in life and surface condition at similar test conditions. Further testing is planned to study the sources of variability. The resulting data are also expected to be valuable for exercising life prediction models.
Acknowledgement
This work was supported by the DARPA Engine System Prognosis program with Dr. Leo Christodoulou as program manager. The author would like to acknowledge Professor Farris and students from the School of Aeronautics and Astronautics at Purdue University for their contributions to the design of this fretting fatigue fixture. The author would also like to acknowledge General Electric Aviation for supplying the Rene’88DT and Rene’N5 materials used in this study.
REFERENCES
- Johnson KL. Contact mechanics. Cambridge: Cambridge University Press; 1985.
- Hills DA, Nowell D. Mechanics of fretting fatigue. Dordrecht, The Netherlands: Kluwer Academic Publishers; 1994.
- Nicholas T. Critical issues in high cycle fatigue. Int J Fatigue 1999;21(S):221–31.
- Conner BP, Nicholas T. Using a dovetail fixture to study fretting fatigue and fretting palliatives. ASME J Eng Mater Technol 2006;128:133–41.
- Golden PJ, Nicholas T. The effect of angle on dovetail fretting experiments in Ti-6Al-4V. Fatigue Fract Eng Mater 2005;28:1169–75.
- Moshier MA, Nicholas T, Hillberry B. Load history effects on fatigue crack growth threshold for Ti-6Al-4V and Ti-17 titanium alloys. Int J Fatigue 2001;23(S):253–8.
- Caton MJ, Jha SK, Rosenberger AH, Larsen JM. Divergence of mechanisms and the effect on the fatigue life variability of Rene’88DT. In: Green KA, Pollock TM, Harada H, Howson TE, Reed RC, Schirra JJ, Wanston S, editors. Superalloys 2004. The Minerals, Metals and Materials Society (TMS); 2004.
- Nazmy M, Kunzler A, Denk J, Baumann R. The effect of strain rate on the room temperature tensile properties of single crystal superalloys. Scripta Mater 2002;47:521–5.
- Walston WS, OHara KS, Ross EW, Pollock TM, Murphy WH. Rene N6: third generation single crystal superalloy. In: Kissinger RD, Deye DJ, Anton DL, Cetel AD, Nathal MV, Pollock TM, Woodford DA, editors. Superalloys 1996. The Minerals, Metals and Materials Society (TMS); 1996.
- Murthy H, Rajeev PT, Okane M, Farris TN. Development of test methods for high temperature fretting of turbine materials subjected to engine-type loading. In: Mutoh Y, Kinyon SE, Hoeppner DH, editors. Fretting fatigue: advances in basic understanding and applications, STP 1425. West Conshohoken (PA): American Society for Testing and Materials International; 2002.
![]()