

Article
Related Links
S.S. Cho1)*, C. S. Shin1), C. S. Lee1), H. Chang2) and K. W. Lee2)
1)Department of Mechanical & System Design Engineering, Hongik University, Seoul 121-791, Korea
2)Hyundai Motor Company, 772-1 Jangdeog-dong, Hwaseong-si, Gyeonggi 445-706, Korea
Abstract
An engine cylinder head-block joint is a gasketed, bolted joint. Assessment of sealing performance and fatigue durability of the joint during engine development relies entirely on the engine dynamometer test because the rig test cannot mimic the engine run condition and finite element analysis employs gasket and bolt models that are too simple to provide the stress data for fatigue assessment. This paper introduces finite element-based assessment of the gasket and the bolt and a model that improves the analysis accuracy without increasing computation time. Experimental data for the deformation of joint members under thermo-mehanical load are presented to demonstrate the accuracy of the model.
Keywords – Engine cylinder head-block joint, Multi-layer steel gasket, Bolt, Finite element analysis, Sealing, Fatigue
1. Introduction
An engine cylinder head-block joint is assembled by fastening the head, block and gasket with bolts. In order to prevent combustion gas, cooling water and lubrication oil leakage, the gasket sealing pressure must be maintained above a critical level as the engine runs. Because the sealing pressure increases with gasket compression during bolt tightening, the bolt preload should be high enough to ensure sealing performance. On the other hand, if the bolt preload is excessive, the joint members are severely distorted and stressed, which lowers engine performance and durability. Because modern engines are designed for high power and light weight, a greater load is applied to the weaker joint, and thus optimal design of the joint is even more important.
Assessment of joint during engine development relies entirely on the engine dynamometer test. Because joint failures in the test cause significant losses of time and money, an assessment method that can be employed prior to the dynamometer test is required. Furthermore, because a reliable assessment method must consider the effects of thermo-mechanical joint load, gasket performance and durability, bolt preload, size and strength, and the structural characteristics of the head-block assembly, an approach using the finite element analysis is more realistic than rig tests (Kestly et al., 2000; Aizawa et al., 2002).
Many researchers have applied finite element analysis to assess the head-block assembly (Fukase et al., 1999; Chen et al., 2000; Chyuan, 2000; Lee et al., 2005). In constructing their models, gasket structure and bolt geometry were simplified significantly in order to reduce analysis time. As a result, the stresses on the gasket and the bolt were unrealistic; thus, the fatigue durability of the gasket and the bolt could not be assessed. Moreover, the accuracy of the simplified models was not examined.
The authors have complemented the finite element-based approach to assess the head-block joint. First, axisymmetric finite element bead models for multi-layer steel (MLS) gaskets were developed to obtain the sealing pressure and the most significant alternating stress in the bead as a function of bead compression during a cyclic load (Cho et al., 2005a; Cho et al., 2005b; Cho et al., 2006). A second work sought to develop a method to assess the fatigue durability of a bolt (Cho et al., 2008) when the bolt thread was modeled as a cylinder. It is noted that the simplified bolt model cannot yield realistic stresses at the engagement point where fatigue failure usually occurs.
Although the head-block joint is a complex structure, the joint model should be simple and realistic to assess the joint accurately without increasing analysis time. More specifically, the simplified gasket model should consider the effects of interaction between the beads as well as its own deformation behavior, and the simplified bolt model should maintain the joint stiffness realistically. Moreover, the joint assessment process should be facilitated. These topics are the objectives of this paper.
2. Modeling and Verification
2.1. Finite Element Model
Finite element analysis was conducted with the commercial code, ABAQUS. Figure 1 shows the finite element model for the head-block assembly. Each member, except the gasket and bolts, is modeled to mimic its real shape, and they are assembled with the bolts as in the real engine. Figures 2 and 3 show schematic sectional views of a real MLS gasket and its model and the planar view of a mesh, respectively. The MLS gasket is a stacked structure of function layers and a spacer, and contains function components named full-bead, half-bead and stopper that exhibit different compression behavior. Such a complex gasket structure is modeled as a single layer of uniform thickness, in which the function components are distinguished by defining their compression behavior separately. The location of each bead in the model coincides with that of the contact pressure in a real gasket (Figure 2). This is why there are two parallel full-bead lines in the model, while there is only one full-bead line in the real gasket. All the bead lines have a unit width because the width of the contact pressure in the real gasket varies with the bead load during the engine run, whereas it is impossible to change the contact pressure width in the model in accordance with the bead load during the analysis. Meanwhile, if the bead width is set to a unit value in the model, the average contact pressure has the same magnitude as the bead load, which is usually expressed as a line load, i.e., the sum of contact pressure acting over the bead width. Because the bead load is used to assess the bead sealing performance and can be related to the most significant alternating bead stress for fatigue assessment, the bead line with unit width facilitates the assessment of the gasket bead.
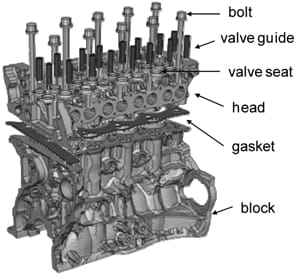
Figure 1. Finite element model of a head-block assembly.
The half-beads are classified into three types based on their dimensions and then classified further into either the interacting bead or the isolated bead depending on whether or not two adjacent beads affect the compression behavior of each other. Figure 4 shows the compression behavior of the isolated and interacting beads with the same dimensions. This result was obtained using the bead model (Cho et al., 2006). The difference is large, which demonstrates that the distinction is essential. The difference
between the interacting bead and the isolated bead diminishes as the distance between two adjacent beads increases. Thus, the distance of 10 mm was chosen as a criterion for the distinction. It is noted that the other researchers have made no distinction between the interacting bead and the isolated bead.
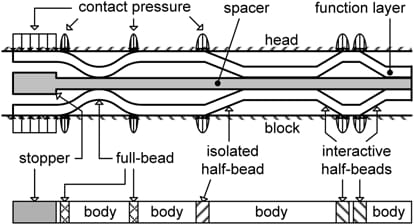
Figure 2. Schematic sectional views of a real MLS gasket and its model.
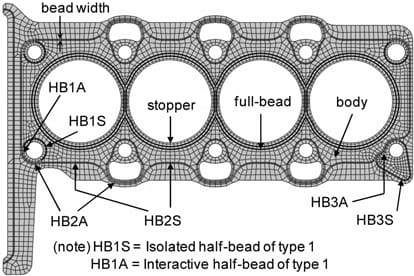
Figure 3. Finite element mesh of an MLS gasket.
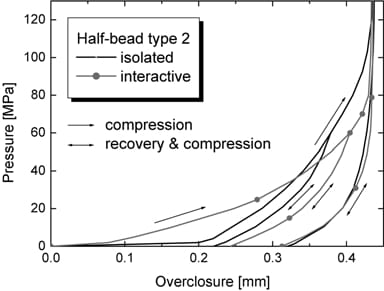
Figure 4. Pressure-overclosure curves for isolated and interacting half-beads with identical dimensions.
The MLS gasket is modeled as one layer, although the real gasket consists of several layers (Figure 2). Using the facts that the bead is a type of spring and that two or more beads of the same type are stacked in series in the real gasket, the compression behavior of the stacked beads can be calculated from that of a single bead, which is estimated using the bead model (Cho et al., 2005a; Cho et al., 2006). Because the maximum value of the cyclic bead load affects the compression-recovery behavior of bead and varies along the bead line, the compression behavior of each bead type is defined with the pressure-overclosure curves for various maximum bead loads, as shown in Figure 4.
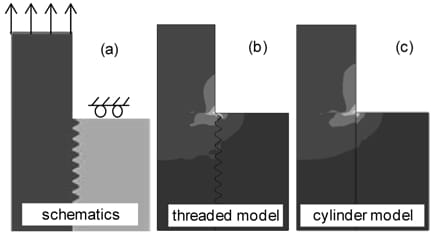
Figure 5. Mises stress around the engaged interface in threaded and cylindrical bolt models.
When modeling the bolt, the thread portion is simplified as a cylinder with a diameter equal to that of the tensile stress area of bolt. It is noted that the other researchers have used a nominal diameter. The bolt head and shank have the same shapes as the real ones. The thread connection interaction model available in ABAQUS is employed to the engaged interface in order to generate the interaction forces. The reliability of the cylindrical bolt model was examined by comparing its behavior with the behavior of the bolt model that mimics the thread profile. Figure 5 shows the Mises stress distribution in the thread connection when the bolt is subjected to the axial tensile load. Because the models yield similar stress distributions, it is concluded that the cylindrical bolt model is acceptable.
2.2. Model Verification
Various experiments were conducted to examine the reliability of the joint model. Figure 6 shows the gasket contact pressure after the assembly. In the experiments, the pressure was measured with Fuji pre-scale measurement film. Both the experiment and the analysis yield similar results. The stopper and the full-bead generate higher pressure than the half-bead. Relatively high pressure is observed near the bolts. The half-bead close to the full-bead exhibits relatively low pressure. The pressure is relatively low in the regions between the cylinders.
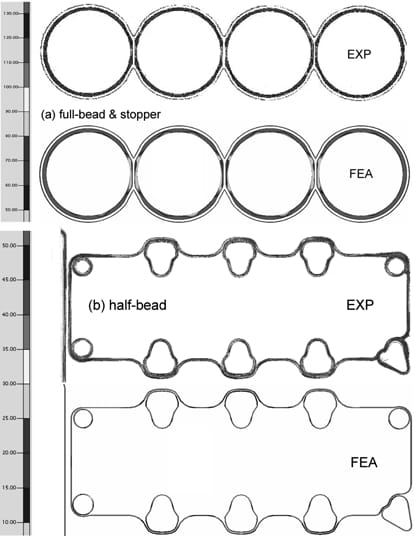
Figure 6. Gasket contact pressure at the assembled state.
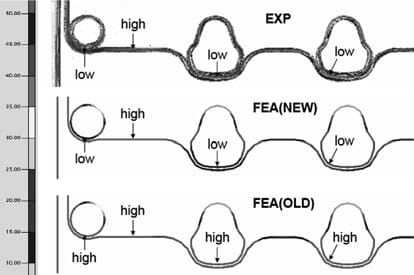
Figure 7. Comparison of gasket contact pressure at the assembled state between experimental and finite element analyses using new and old models.
Figure 7 shows enlarged views of the gasket contact pressure in the left-bottom region in Figure 6. The experimental result illustrates that the pressure varies along the half-bead line. The pressure is relatively high in the region where there is only one bead line, whereas it is low in the region where two bead lines are nearby. This characteristic variation is also observed in the analysis using the new model, in which the isolated bead is distinguished from the interacting bead; this distinction is not made in the analysis using the old model. Thus, it is concluded that the analysis accuracy improves by distinguishing the interacting bead from the isolated bead.
Figure 8 shows the axial normal strain along the circumference of the cylinder surface at different cooling water temperatures. The strain was measured at a distance of 30 mm from the top surface of block. In the experiment, the joint was assembled at a temperature of 25oC, and then water with a temperature of 90oC was forced to flow through the cooling water channel until a steady state temperature was established. Relatively high compressive strain is observed at the rear and front sides where the engine block is structurally weak. As the temperature rises, the cylinder is compressed further, but the characteristic variation is maintained. Analysis results agree well with the experimental results. The analysis results using the old model are not included in Figure 4 because of marginal improvement.
Figure 9 shows the average load increment of four bolts around the pressurized cylinder. In the experiment, a dummy piston was inserted into the cylinder, and then compressed air was supplied to the cylinder through the ignition plug hole. The bolt load increases linearly with pressure. The new bolt model yields almost the same values as the experiment, whereas the old model yields about 20 percent higher values. It is noted that the diameter of thread portion in the new model is equal to that of the tensile stress area whereas in the old model it is equal to the nominal diameter.
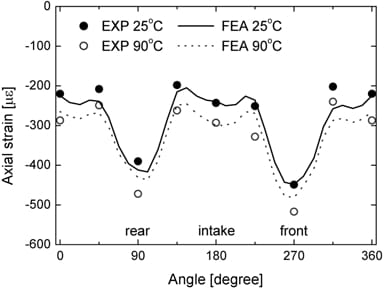
Figure 8. Axial strain along the circumference of the cylinder surface at different cooling water temperatures.
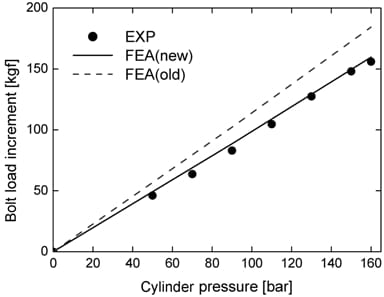
Figure 9. Increase of bolt load with cylinder pressure.
It is concluded that the new joint model yields more accurate results than the old model without increasing the analysis time. Moreover, the new model realistically simulates the deformation of all the joint members subjected to the thermo-mechanical loads.
3. Analysis And Assessment
3.1. Analysis of Running Engine
The simulation starts with joint assembly with the bolts. The bolt preload is generated by reducing the bolt shank length. The steady-state engine temperature acquired from CFD analysis is imported to generate the thermal stresses, and then the firing pressure is applied to the cylinders one by one. Because the gasket deformation behavior stabilizes after one engine cycle, the engine temperature is lowered back to the ambient temperature; then, the engine cycle described above is repeated once more. The assessment is conducted with the data in the second engine cycle.
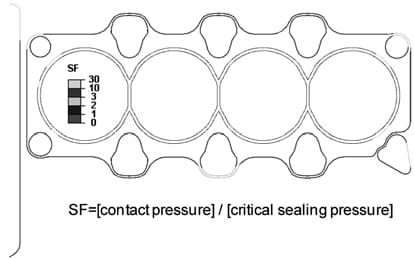
Figure 10. Assessment of gasket sealing performance.
3.2. Performance and Durability Assessment
The gasket sealing performance is ensured if the minimum contact pressure on the beads and the stopper during engine run is higher than the critical sealing pressure. The critical sealing pressure is measured experimentally. Figure 10 shows the distribution of the sealing performance safety factor, which is defined as the ratio of the minimum contact pressure to the critical sealing pressure. All the safety factor values are above one; thus, no leakage is expe
cted.
The gasket fails as a result of fatigue cracking in the beads; thus, the gasket fatigue assessment requires stresses in the bead. Because the real structure of a gasket is not considered in the model, the bead stresses cannot be obtained from the engine analysis; however, it is possible to correlate the bead stresses to the bead load, because the gasket bead analysis (Cho et al., 2005b; Cho et al., 2006) yields the bead stresses as a function of the bead load. Figure 11 shows the relationship between the bead load and the maximum value of the principal stress amplitude in the full-bead when the bead is subjected to cyclic loads. The relationship depends on the maximum value of the bead load because the compression-recovery behavior of the bead depends on the maximum value of the bead load (Figure 4). If the same kind of relationship is acquired for each bead type, the maximum value of the principal stress amplitude during the engine cycle can be estimated at all nodal points along the bead in the gasket. Figure 12 shows the distribution of the bead fatigue safety factor. The safety factor is calculated using the bead fatigue strength (Han et al., 2004). Enlarged plots for relatively weak regions are included. Because all the safety factor values are greater than one, it is expected that the gasket will not fail as a result of fatigue cracking in the bead.
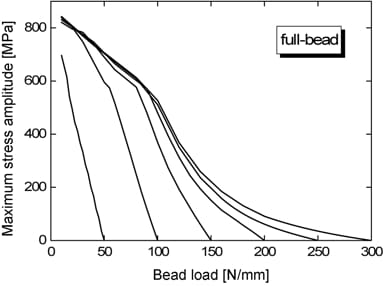
Figure 11. Variation of maximum stress amplitude in the full-bead with bead load.
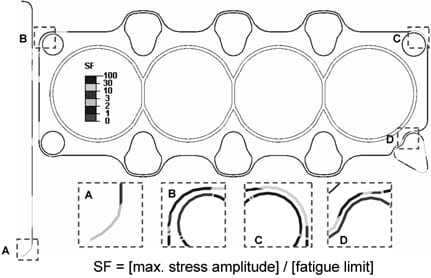
Figure 12. Fatigue assessment of gasket.
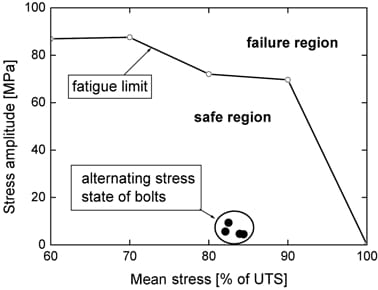
Figure 13. Fatigue assessment of bolts.
Fatigue failure of the head bolts usually occurs at the first bolt-nut engagement point. The fatigue limit of bolt has traditionally been estimated with the nominal bolt stress that excludes the stress concentration effect. In the engine model, the bolt stress rises at the first engagement point due to the stress concentration (Figure 5). Thus, the unconcentrated bolt stresses at the first engagement point are calculated by extrapolating the axial stresses on the shank (Cho et al., 2008). The amplitude and mean value of the most significant, unconcentrated alternating stress during the engine cycle are estimated and then compared with the bolt fatigue limit. Figure 13 shows the Haigh diagram of the bolt (Cho et al., 2009), to which the bolt alternating stress state at the first engagement point are added. Because the bolt stress state is in the safe region, infinite bolt lifetimes are expected.
Figure 14 shows the distribution of the fatigue safety factor in the head and the block. The high-cycle fatigue theory is applied to estimate the safety factor. At the weakest locations, indicated with arrows, the safety factor values are greater than one. Thus, both the head and the block are not expected to fail by fatigue.
Figures 12~14 demonstrate that the sealing performance and the fatigue durability of all the joint members can be assessed with the finite element analysis results. Although the finite element-based assessment cannot replace the engine dynamometer test, it helps reduce the number of the tests. Moreover, if the head-block joint fails in the engine dynamometer test, finite element analysis provides invaluable data that can be used to examine and eliminate the causes of failure. The assessment method reliability will be examined in the future.
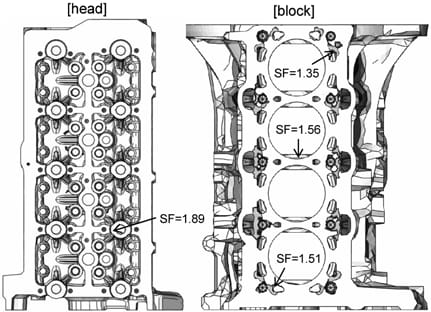
Figure 14. Fatigue assessment of head and block.
4. Conclusion
The accuracy of the finite element analysis of an engine cylinder head-block joint can be improved without increasing the computation time by distinguishing between the interacting half-bead and the isolated half-bead in the gasket model and by setting the diameter of the thread portion of the cylindrical bolt model equal to that of the tensile stress area of bolt. The improvement in the analysis accuracy, as well as reliability of the joint model, has been verified with experimental data such as the gasket contact pressure at the assembled state, the variation of axial normal strain on the cylinder surface with cooling water temperature, and the variation of bolt load with the cylinder pressure.
Both the gasket and the bolt can be assessed with the analysis results, even if the simplified gasket and bolt models are employed in the joint model. Both the sealing performance and the fatigue durability of an MLS gasket can be assessed using the alternating bead load during the engine cycle. Fatigue durability of the bolt can be assessed using the alternating axial stress at the first engagement point, which is calculated by extrapolating the axial stresses on the shank.
References
- Aizawa, O., Uno, T., Yakushiji, M., Kodama, T., Nishihara, T., Wakabayashi, K. and Motoyama, Y. (2002). An experimental study on the dynamic characteristics of cylinder head gaskets for diesel engine: Dyanmic characteristics in heating and cooling temperature cycle by abrupt change of water during steady operation. JSAE Review, 23, 15-20.
- Chen, C., Obermaier, S. and Popielas, F. W. (2000). CAE approach for multi-layer steel cylinder head gaskets. SAE Paper No. 2000-01-1348.
- Cho, S.-S., Han, B. K., Chang, H. and Kim, B. K. (2005a). Effects of forming process on sealing performance of full-bead of MLS gasket. Int. J. Automotive Technology 6, 2, 191-196.
- Cho, S.-S., Han, B. K., Lee, J.-H., Chang, H. and Kim, B. K. (2005b). Fatigue durability assessment of full-bead of mls gasket using finite element analysis. Int. J. Automotive Technology 6, 5, 513-517.
- Cho, S.-S., Han, B. K., Lee, J.-H., Chang, H. and Kim, B. K. (2006). Finite element modeling and parameter study of half-bead of MLS cylinder head gasket. Int. J. Automotive Technology 7, 1, 109-114.
- Cho, S.-S., Chang, H. and Lee, K. W. (2008). Finite elementbased fatigue assessment of engine connecting-rod bolts. Trans. Korean Society of Automotive Engineers 16, 4, 14-20.
- Cho, S.-S., Chang, H. and Lee, K. W. (2009). Dependence of fatigue limit of high tension bolts on mean stress and ultimate tensile strength. Int. J. Automotive Technology 10, 4, 475-479.
- Chyuan, S.-W. (2000). Finite element simulation of a twincam 16-valve cylinder structure. Finite Elements in Analysis and Design, 35, 199-212.
- Fukase, F., Takahashi, T. and Kimura, J. (1999). Experimental study of static and dynamic behavior of the cylinder head gasket in a turbocharged diesel engine with intercooler. SAE Paper No. 1999-01-2799.
- Han, B. K., Cho, S.-S., Chang, H. and Kim, B. K. (2004). Fatigue fracture of NBR-coated SUS301 thin plate for MLS gasket. Trans. Korean Society of Automotive Engineers 12, 4, 207-212.
- Kestly, M., Popielas, F., Grafl, D. and Weiss, A. (2000). Accelerated testing of multi-layer steel cylinder head gaskets. SAE Paper No. 2000-01-1188.
- Lee, C.-C., Chiang, K.-N., Chen, W.-K. and Chen, R.-S. (2005). Design and analysis of gasket sealing of clinder head under engine operation condition. Finite Elements in Analysis and Design, 41, 1160-1174.
![]()