Article
Related Links
Correlation of In Situ and Ex Situ Measurements of Water Permeation Through Nafion NRE211 Proton Exchange Membranes
Makoto Adachi,a,b Titichai Navessin,a,z Zhong Xie,a,* Barbara Frisken,c and Steven Holdcrofta,b,z
aInstitute for Fuel Cell Innovation, National Research Council Canada, Vancouver, British Columbia V6T 1W5, Canada
bDepartment of Chemistry and cDepartment of Physics, Simon Fraser University, Burnaby, British Columbia V5A 1S6, Canada
Water permeability at 70°C is determined for Nafion NRE211 membrane exposed to either liquid or vapor phases of water. Chemical potential gradients of water across the membrane are controlled through use of differential humidity (38–100% RH) in the case of water vapor and hydraulic pressure (0–1.2 atm) in the case of liquid water. Accordingly, three types of water permeation are defined: vapor-vapor permeation, liquid-vapor permeation (LVP), and liquid-liquid permeation. The difference in chemical potentials across the membrane, and more significantly, the flux of water, is largest when the membrane is exposed to liquid on one side and vapor on the other (i.e., LVP conditions). Polarization curves and net water fluxes are reported for NRE211-based MEAs at 70°C under two different operating conditions. Water permeability measurements obtained ex situ are compared to fuel cell water balance measurements obtained in situ. It is found that the magnitude of back-transport of water during fuel cell operation can be explained only by considering that the membrane is exposed to liquid on one side and vapor on the other (i.e., LVP conditions). Thus, LVP water transport is largely responsible for regulating water balance within the operating membrane electrode assembly.
As a clean and efficient power converter, proton exchange membrane (PEM) fuel cells are considered a candidate for mobile, transportation, and stationary applications. In this type of fuel cell, a PEM serves as both the electrolyte and the separator of reactants. Perfluorosulfonated ionomer (PFSI) membranes are commonly employed and are sandwiched between gas diffusion electrodes that form the anode and cathode of a membrane electrode assembly (MEA). In these devices, hydrogen gas is typically oxidized at the anode and oxygen is reduced at the cathode. Protons generated at the anode transport through the aqueous regions of the PFSI membrane to the cathode where they combine with oxygen according to known electrochemical reactions. The presence of water in the membrane is considered essential for proton transport to occur, and in this respect, the membrane must be sufficiently hydrated during operation.
Water transport to, from, and through the membrane involves a complex interplay of processes, as illustrated in Fig. 1. Included in these processes are the transport of water from the anode to the cathode by electro-osmotic drag (JEOD), i.e., water that accompanies protons as they travel from anode to cathode, and the generation of water at the cathode as the product of the oxygen reduction reaction (JORR) at a rate that increases with current density. Both these processes lead to an unfavorable, unbalanced distribution of water within the MEA. Electro-osmotic drag (EOD) has the potential to dehydrate the ionomer near, and in, the anode catalyst layer, whereas the accumulation of liquid water in the pores of the cathode impedes oxygen from reaching the reaction sites. The latter is mitigated if the rate of water evaporation at the cathode (Jc_evap.) offsets its accumulation, whereas the effect of the former may be reduced if water is able to permeate from the cathode to the anode (JWP). When the sum of the rates of liquid water evaporation (Jc_evap.) and back water permeation (JWP) is insufficient to compensate the sum of JORR and JEOD, water accumulates at the cathode.
During the past decade, a number of water balance experiments have been performed on fuel cells that refer to the direction and the magnitude of the net flux of water (i.e., the sum of JWP and JEOD).1-7 The water fluxes obtained from these experiments are useful for discerning the net flow of water under steady-state conditions.
When comparing net water fluxes of fuel cell systems, it is often convenient to normalize the data to obtain the value, β, which is the ratio of the net water flux to proton flux, as defined by Springer et al.8 When β is positive, the direction of the net water flux is toward the cathode; when negative, it is toward the anode. Negative β-values imply that JWP toward the anode is larger than JEOD and have been experimentally observed. Janssen and Overvelde et al. conducted a systematic evaluation of β using Nafion 105 under combinations of wet, dry, and differential pressure of the supplied gases.9 Negative β-values were observed when the anode was dry, whereas positive β-values were observed for other operating conditions. Yan et al. observed negative β-values when the cathode gases were saturated and the flow rate of the relatively drier H2 gas β20% RH β at the anode was increased.10 Cai et al. conducted a water balance study of Nafion 112-based MEAs under dry H2 and moderately humidified air and report that β-values are negative, increasing in magnitude from -0.06 to -0.18 as the current density is increased from 0.1 to 0.6 A cm-2.11
Although the body of work on measurements of net water transport through an operating fuel cell is quite large, more information is required to take advantage of negative β values so that a net transport of water to the anode may serve to offset the deleterious effects of dehydration of the anode and flooding of the cathode.5,9-11 For this reason, studies of water permeation (JWP) through PEMs are drawing increasing interest as part of a general strategy for mitigating issues associated with water management and improving the performance of PEM fuel cells.
The permeation of water through a membrane is the transport of water from one side of a membrane to the other.12 The process consists of water sorption, diffusion within the membrane, and desorption. Within the field of PFSI-based PEMs, Nafion has been the most extensively studied. Studies of water transport through Nafion can be categorized as one of three types: (i) Measurements of rates of water transport into, within, and out of, the membrane, (ii) studies of the distribution of water within the membrane, and (iii) the molecular mobility of water within the membrane. This current work falls within the first category. Information on water transport can be extracted by observing the rate of swelling and deswelling of the membrane on exposure to water vapor.13-17 In these experiments, transient rates
of water ingressing or egressing the membrane can be derived. Alternatively, the permeability of a membrane to water can be determined by applying a chemical potential gradient,18-21 induced by a concentration or pressure gradient, and measuring the flux of water. For example, Majsztrik et al. determined the water permeation flux through Nafion 115 membrane to be 0.03 g min-1 cm-2 (equivalent to 0.28 mol m-2 s-1) under a liquid water/PEM/dry N2 flow (0.8 L min-1) at 70°C.22 From these measurements, information such as permeability of the membranes and activation energy of water permeation were extracted.
In order to understand and to correlate these individually studied ex situ and in situ experimental studies, numerical modeling of the water transport processes have been undertaken. Concepts underpinning the modeling of heat and mass transport within a fuel cell have been extensively reviewed.23 Springer et al., in a highly cited piece of work, proposed a model for water transport through a PEM8 in which they took the membrane’s state of hydration into account in order to predict the rates of water transport across the PEM. Despite the material properties of the components not being particularly well understood at the time, their empirical and systematic application of physical chemistry principles to fuel cell operation enabled them to construct a simplistic model that has guided many recent studies in this area. Together with other studies, a generalized understanding of water transport processes in an operating fuel cell has emerged, as illustrated in Fig. 1. Different models are often distinguished in the way they describe each of the water fluxes illustrated in Fig. 1. Eikerling et al., for example, proposed that hydraulic permeation to be a significant factor determining JWP,24 whereas Weber combined hydraulic permeation and diffusive permeation in the JWP term.25 The nature and magnitude of JWP is clearly an important factor in any realistic model. Thus, a requirement of implementing numerical models to explain and predict actual permeation fluxes is the availability of accurate values of water transport parameters. However, the experimental techniques used to obtain these parameters are often technique-specific and may not always be transferable to the simulation of fuel cell polarization data, leading to inaccurate conclusions. The conditions under which water transport parameters are obtained may be quite different from the conditions under which fuel cell polarization curves are obtained, thus making numerical simulation even more suspect.
In this work, we attempt to obtain water permeability measurements obtained ex situ and compare the data to fuel cell water balance measurements obtained in situ, under comparable conditions of temperature and relative humidity, with the specific purpose of revealing the role of back transport of water on fuel cell performance. More specifically, this paper describes the comparison of water transport data obtained when a Nafion NRE211 membrane is exposed to either liquid or vapor phases of water, and wherein a chemical potential gradient is developed across the membrane by either controlling the differential humidity in the case of water vapor or hydraulic pressure in the case of liquid water. Accordingly, three types of water permeation are defined as follows:
1. Vapor-vapor permeation (VVP), wherein both sides of the membrane are exposed to water vapor and the driving force for water permeation is created by off-setting the humidity on both sides of the membrane. This method is similar to what it is described as “Standard test methods of water vapor transmission of materials” in ASTM.26
2. Liquid-vapor permeation (LVP), wherein one side of the membrane is in contact with liquid water and the other side is exposed to water vapor. The driving force for water permeation is controlled by varying the relative humidity of the vapor.
3. Liquid-liquid permeation (LLP), wherein both sides of the membrane are in contact with liquid water and the driving force for water permeation is created by applying hydraulic pressure.
Using in situ, net water balance measurements on fuel cells, the ex situ permeability data are used to determine which mode of water transport (VVP, LVP, and LLP) applies for an operational PEM for a given set of conditions. These studies provide specific information related to water transport properties of dispersion-cast, Nafion NRE211 membranes and lead to a better understanding of the complex water transport phenomenon occurring in PEM fuel cells.
Figure 1. Water transport within an operational MEA.
Experimental
Materials.— Nafion membrane (NRE211, 25 μm, DuPont) in its H+ form was used as received.27 Membranes boiled at 80°C in 3 wt % H2O2 solution for 2 h, rinsed in deionized Milli-Q water (Millipore) at room temperature several times, and stored in deionized water for 24 h prior to use, exhibited identical hydration and permeability characteristics as as-received membranes.
CCM-MEAs.— Carbon-supported Pt was dispersed in 50 wt % methanol in water by sonication for 30 min and 5 wt % Nafion ionomer solution (DuPont) was added to provide 30 wt % Nafion content, based on the solids content, and the mixture was homogenized by sonication for 1 h more. This catalyst ink was spray deposited using an automated spray coater (EFD, Nordson Company) on both sides of a NRE211 membrane, mounted on a vacuum table. The deposition was controlled to yield 0.35–0.40 mg cm-2 Pt on each side of the membrane. Sheets of two-layer gas diffusion layer (GDL) possessing a microporous layer (SIGRACET 24BC, SGL Carbon Group) were used to sandwich the catalyst coated membranes (CCMs). The GDL/CCM/GDL was assembled into a 25 cm2 triple serpentine flow design cell (Fuel Cell Technologies) without hot-pressing. Compressible silicone gaskets, 125 m thick, were used on both sides of the MEA to seal the reactant gases and to provide consistent compression, which was confirmed using pressure sensitive paper (Pressurex, super-low, Sensor Products Inc.).
Ex situ measurement of water transport through Nafion NRE211 membranes.— VVP and LVP.— NRE211 membranes were sandwiched between two polyethylene (PE) sheets with thermal adhesives (HeatSeal, 1.5 mil, GBC). The PE sheets had a punched hole, 34.9–37.1 cm2, through which the membrane was exposed. The sandwich was thermally sealed using the rolling laminator (Creative laminator, 9 in., GBC). In the case of VVP experiments, the PE/ membrane/PE assembly was placed in a leak-free sample holder, as illustrated in Fig. 2a, and docked to a polypropylene container filled with water. The container was placed in an environmental chamber so that the relative humidity (RH) of the head space between the water and membrane was at a saturated point, whereas the RH above the membrane was controlled by the environmental chamber in an isothermal environment. For measurements of LVP, a PE/ membrane/PE assembly was floated on the surface of the water in a stainless steel container and placed in the environmental chamber, so that one side of the membrane was exposed to liquid water, while the other side was exposed to a RH controlled by the environmental chamber, as illustrated in Fig. 2b. All measurements were performed at 70°C.
An Espec Model SH-241 environmental chamber was used for VVP and LVP measurements. The temperature and humidity of this chamber were measured with a calibrated dew-point meter (HMT337, Vaisala Inc.) to confirm its humidity-controlling capability. The temperature was controlled to (0.5°C according to a calib
rated k-type digital thermometer (Omega). Initial LVP and VVP experiments revealed that the water in the container cooled during water permeation due to the endothermicity of water evaporation. In the case of VVP measurements, the temperature of the liquid water dropped by ~1°C from its initial, set temperature of 70°C, which lowered the RH in the head space between the water and the membrane, to ~96% RH from 100%. Because 1°C is similar in magnitude to the error of the digital thermocouple, rather than attempting to maintain the VVP cell at the required temperature through external heating, the 1°C difference was accounted for in the calculated chemical potential gradients, discussed later. In the case of LVP measurements, where rates of water permeation were found to be much greater, and consequently, rates of evaporation to be much greater, the temperature of the liquid water dropped by up to 10°C from its initial temperature of 70°C, which significantly affected the measured rates of water permeation. Hence, the stainless steel container was externally heated to maintain a constant temperature of 70°C using a 100 W flexible heater (Watlow electric Mfg. Co.), thermocouple (K-type TC, Omega Engineering Inc.), and external temperature controller (Model 210, J-KEM Scientific Inc.).
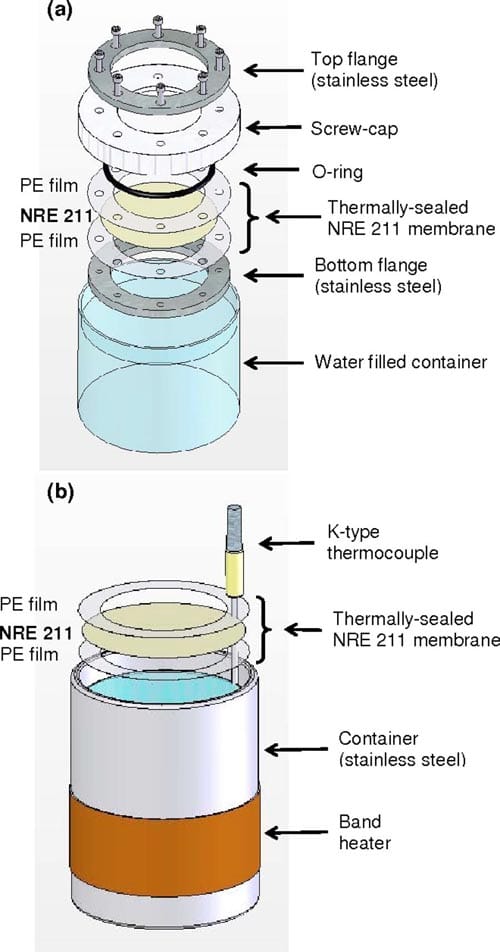
Figure 2. (Color online) Schematic diagram of the (a) VVP and (b) LVP experimental setups.
As Ge et al.,18 Motupally et al.,20 Romero et al.,21 and Majsztrik et al.22 and others18,20-22 have observed, the flow velocity of the carrier gas on the evaporation side of the membrane influences the rate of water permeation in both VVP and LVP measurements because the local concentration of water at the membrane/gas interface varies with flow velocity. In the present experimental setup, the convection fan in the environmental chamber was used to generate a constant gas flow of humidified air on the evaporation side of the membrane. The magnitude of this flow velocity at the membrane/gas interface was investigated by measuring the evaporation rate of water from the container. The obtained data was then compared to Hisatake et al.’s study on the rate of water evaporation versus the convective flow velocity at the surface from which evaporation is taking place.28 From this investigation, the gas-flow velocities at the membrane surface in our setup were estimated to lie between 1.5–3.2 m s-1, depending on where the container was placed in the environmental chamber. These values are much larger than those reportedly required to achieve gas-flow–independent rates of water permeation.18,20,22 For example, Majsztrik et al. observed maximum rates of water permeation when the flow velocity of the dry N2 gas is > ~0.17 and at 0.37 m s-1 at 70°C for vapor/N115/dry gas and liquid/N115/dry gas configurations, respectively.29 Romero et al. reported He gas flow velocities of ~0.008 and ~0.025 m s-1 for flow-independent water permeation through vapor and liquid equilibrated N115 membranes at 70°C.21 Ge et al. observe the maximum flow-independent water permeation through a N112-based MEA to occur for N2 gas flow velocities of 0.13 and 0.81 m s-1 for vapor/ MEA/dry gas and liquid/MEA/dry gas configurations, respectively, at 80°C.18 Thus, the flow velocity at the evaporation interface of the membrane in our VVP and LVP setups are sufficiently high to avoid the formation of stagnant layers of humidified air at the membrane/ gas interface, leading to the important assertion that water permeation is insensitive to small variations in convective velocities that may be present in the environmental chamber.
For VVP and LVP measurements, the container containing water and the PE/membrane/PE assembly was removed from the environmental chamber at regular intervals and weighed. The initial weight of the container was weighed after the temperature of the container was stabilized at 70°C, which was typically 2 h. The mass change of the container was weighed in a typical interval of 2–6 h for both VVP and LVP measurements. Rates of VVP and LVP are calculated as water fluxes through the membrane (JVVP and JLVP, respectively). For LVP measurements, the rate of evaporation from a water-filled container onto which an identically sized PE film, without the punch hole, was measured, in order to determine errors induced by direct evaporation of water from the small gap between the perimeter of the PE film and the container’s wall. This background rate of evaporation (0.13–0.03 mmol s-1 per container, depending on the RH) is ~20–23% of the rate or permeation through the membrane and was subtracted from the measured weight loss of the container. For VVP measurements, the leak rate from the membrane holder and the polypropylene container was ~2.1 x 10⁻⁴ mmol s-1 (<0.5% of the total rate of water permeation) at 70°C and 40% RH condition which we consider to be negligible.
Water fluxes for VVP and LVP (JVVP,JLVP) are expressed below where ΔM/Δt represents the evaporation rate of water, MH2O and A as the molar mass of water and the geometrical area of the membrane fined as the standard deviation. The stability and reproducibility of this setup was found satisfactory. For example, the variation of the measured rates of water permeation through a given membrane VVP and LVP fluxes were determined from four series of measurements taken from two different pieces of membrane. Errors are defined for the largest RH differential (40% RH at 70°C) was accurate to ±0.00051 mol m-2s-1 for VVP measurements, i.e., [±5% range in variance from the averaged value and ±0.0079 mol m-2s-1 (±6% range) for LVP].
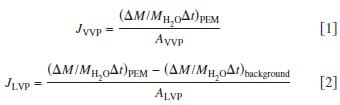
Figure 2. (Color online) Schematic diagram of the (a) VVP and (b) LVP experimental setups.
Measurement of liquid-liquid permeation.— Water permeation through the membrane driven by a hydraulic pressure gradient was measured using the setup illustrated in Fig. 3. A syringe (GASTIGHT no. 1025, Hamilton Co. with PHD2000, Havard Apparatus) filled with deionized water, a mass flowmeter (2.0 and 20 μL/min, μ-FLOW, Bronkhorst HI-TEC), and a pressure transducer (PX302-100GV, Omega Engineering Inc.) were connected in series with 1/8 in. o.d. PTFE tubings. The membrane was installed in a cell made in-house, consisting of a PTFE-coated stainless steel screen to prevent rupture of the membrane and an O-ring. The cell was heated on a mantle and maintained at 70°C. A constant flow of water throughout the system was maintained until the desired temperature and pressure was reached. Measurements were taken when the upstream pressure indicated by the pressure transducer deviated by <1% of the measured pressure. This was repeated at least 10 times in the pressure range of 0–1.2 atm. The apparatus was controlled and monitored using Labview software.
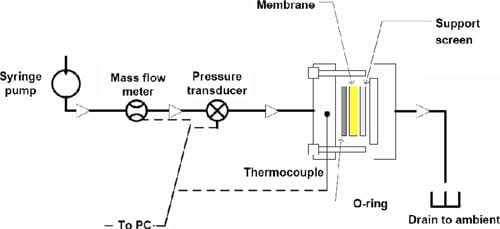
Figure 3. (Color online) Schematic of the LLP setup. Syringe, liquid mass flowmeter, and the pressure transducer were placed in an isothermal environment of 20°C. The cell was heated separately at 70°C.
In situ measurement of water transport through a fuel cell.— A fuel cell test station (850C, Scribner Associates) was used to control and supply gases to the 25 cm2 triple serpentine flow design, single cell (Fuel Cell Technologies). Values of vapor pressure used to calculate the relative humidity were taken from a literature source.30 The cell tempe
rature was 70°C. Water-cooled condensers (~0.6 m long for the anode and ~1 m long for the cathode) were installed at the exhaust manifolds of the cell to collect the water.
When the open-circuit voltage reached 0.95 V, 0.4–0.6 A cm-2 was applied to maintain a cell potential of 0.5–0.7 V. The flow rate of the H2 and air were supplied in the stoichiometric ratio of 2.0 and 3.0. To avoid reactant starvation, minimum flow rates of the gases were set to be 0.25 L min-1. This corresponds to the fuel cell operated at constant flow mode up to 0.4 and 0.05 A cm-2 for anode and cathode, respectively. Polarization curves were recorded in 50 mV increments, stabilized for 3 min at each point. Eight polarization curves were recorded for each operating condition.
The net water flux was measured by collecting the water from anode outlet, subtracting the amount of water introduced as humidified gas. The conditioned cell was operated at the desired constant current for at least 60 min before the first measurement and 20 min for the subsequent measurements. After steady state was achieved, water was directed to the condensers for collection until >3.0 g of water was collected.
The net water flux through the PEM was determined from the amount of water collected at the anode. In this case, the loss or gain of water at the anode outlet was normalized to the MEA’s geometrical active area to determine the flux. In this case, JaNET is given by:
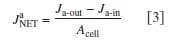
where Ja-in is the flux of water introduced and determined from calibration measurements, while Ja-out is the measured amount of water collected from the anode.
The triple serpentine flow channel design used in this work was suited to the nature of this type of water balance measurement. This flow channel design allowed the set gas flow rates to be relatively small that kept the ratio of JaNET and Ja-in to be in the range of 0.3–0.5 and 1.4–1.6 for the tested conditions (i) and (ii), which are defined later. However, it has to be noted that the disadvantage of this design is the inhomogeneity of the humidity along the channel under high current density. For instance, humidity of the saturated anode stream was found to decrease to 80% RH at the outlet and humidity of the relatively dry (40% RH) anode stream was found to increase close to saturation at the outlet at the highest current densities.
Results and Discussion
Ex situ measurements of water permeation.— The rates for VVP and LVP of water through NRE211 membrane are given in Fig. 4. For VVP measurements, one side of the membrane was exposed to air humidified at 96% RH, while the RH of the opposite side was varied between 38% and 85% according to our calibration. For LVP measurements, the membrane was exposed to liquid water on one side while the RH of the other side was varied. For both types of measurements, a water concentration gradient is developed across the membrane, which serves to transport water to the side where the chemical activity of water is lower )i.e., the side exposed to lower RH). The flux of water is observed to increase linearly with a reduction in relative humidity of the “drier” side. The rate of water permeation for the case of LVP is much greater than for VVP. The corresponding water fluxes through NRE211 membrane corresponding to LLP, in which transport is induced by application of hydraulic pressure, are shown in Fig. 5. The permeance was determined from the linear slope of this plot to be 8.83 x 10⁻¹² m Pa-1s-1. The thickness-normalized permeability is 2.43 x 10⁻¹⁶ m2 Pa-1 s-1, which is similar in value to other reports for Nafion membranes.31,32
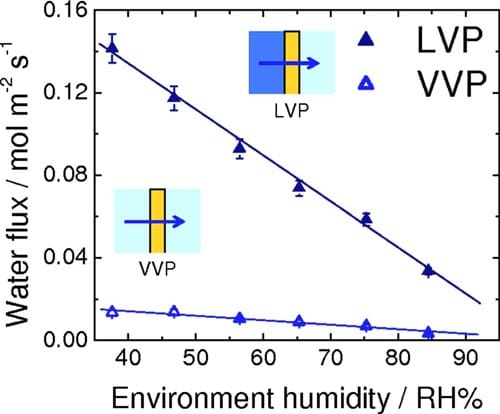
Figure 4. (Color online) Rate of water permeation through NRE211 at 70°C as a function of relative humidity of the drier side of the membrane. LVP configuration: liquid water/membrane/variable RH; VVP configuration: 96% RH/membrane/variable RH.
In order to quantitatively compare VVP, LVP, and LLP, and to compare the different water-transport properties among various PEMs for fuel cell applications, the differential chemical potential of water across the membranes was calculated, as described below.
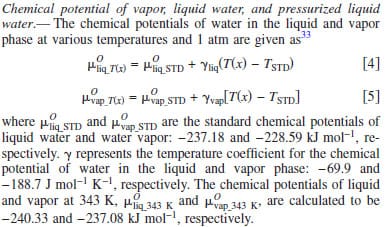
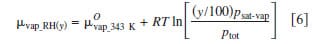
From the standard chemical potential of water vapor at 70°C, the chemical potentials of water vapor at various relative humidities were calculated according to Eq. 6, where y indicates the relative humidity (expressed as percent) and R, T, psat-vap, and ptot correspond to the universal gas constant, temperature of the environment, saturated vapor pressure at that temperature, and ambient pressure, respectively.34 The chemical potentials of water vapor at various humidities at 70°C calculated from Eq. 6 are plotted in Fig. 6a. As the relative humidity is increased toward saturation, the chemical potential of water vapor approaches that of liquid water
The chemical potential of liquid water under pressure was estimated using Eq. 7, where p(z), pSTD, and δ indicate the applied pressure, standard pressure, and the pressure coefficient for water. Here, the standard pressure is 1 atm and the coefficient, δ, is 1.990 J mol-1 atm-1.33 The calculated chemical potentials of liquid water as a function of pressure are plotted in Fig. 6b

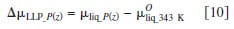
As illustrated in Fig. 6, the chemical potential of water vapor increases nonlinearly with relative humidity, whereas the chemical potential of liquid water increases linearly with pressure. Moreover, the variation in chemical potential of the latter is much smaller in magnitude. Equations 8 and 9 define the difference in chemical potentials of water for VVP and LVP measurements, where y corresponds to percent RH. Similarly, Eq. 10 describes the difference in chemical potential created for LLP measurements
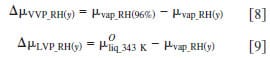
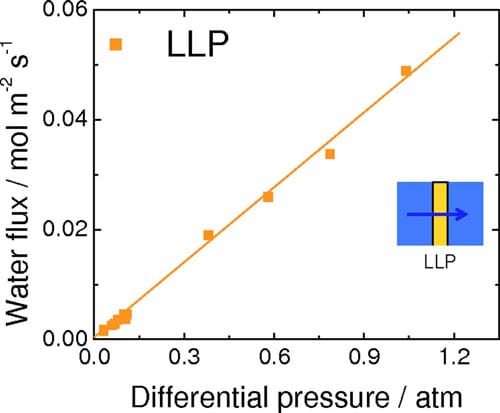
Figure 5. (Color online) Rate of water permeation through NRE211 at 70°C as a function of differential hydraulic pressure (LLP).
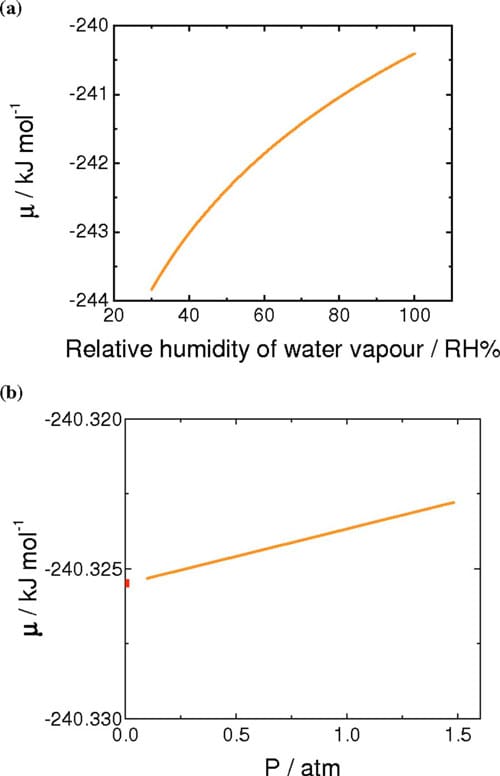
Figure 6. (Color online) (a) Calculated chemical potential of water vapor for the range of 30–100 %RH at 70°C. (b) Calculated chemical potentials of pressurized liquid water for the range of 0–1.5 atm above ambient pressure at 70°C.
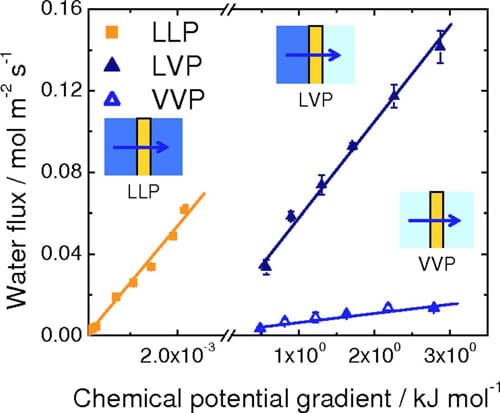
Figure 7. (Color online) Rates of water permeation at 70°C as a function of chemical potential differential.
The differential chemical potential across the membrane constitutes the driving force responsible for water permeation th
rough the membrane. The water fluxes reported in Fig. 4 and 5 are thus replotted in Fig. 7 against the difference in chemical potentials of water on the other side of the membrane. The break in the axis is necessary because of the wide range of Δμ values generated in the LLP and LVP/VVP experiments. For all three types of water permeation measurements, the water flux was observed to increase linearly with increasing Δμ. Values of permeation coefficient (permeance), expressed as a function of chemical potential, were obtained from the slopes of the plots to be 0.0059 (±4.6 x 10⁻⁴), 0.052 (±1.7 x 10⁻³), and 26 (±0.80) mol2 m-2 s-1 kJ-1 for VVP, LVP, and LLP measurements, respectively. Normalizing these values to the thickness of the hydrated membrane (28 μm) provided water permeability values of 1.6 x 10⁻¹² (±1.3 x 10⁻¹³), 1.5 x 10⁻¹¹ (±4.8 x 10⁻¹³), and 7.4 x 10⁻⁹ (±2.2 x 10⁻¹⁰) mol2 cm-1 s-1 J-1, for VVP, LVP, and LLP measurements, respectively.
The largest of the water permeation coefficients is obtained when liquid water is in contact with both sides of the membrane (LLP), the next largest when liquid is in contact with one side (LVP), and the smallest when both sides are exposed only to water vapor (VVP). LLP permeability coefficients are ~500 and 5000 times greater than LVP and VVP permeability coefficients, respectively. Two explanations are provided to account for this trend. The hydration state of the membrane is known to be an influential factor for water transport through the membrane, with larger water contents leading to higher degrees of swelling and more facile water transport. As shown by numerical simulations and experimental measurements, and described by Kreuer and Paddison, “pores” of Nafion expand on hydration. In our measurements, membranes exposed to liquid water on both sides (LL) are expected to contain a higher content of water than those exposed to vapor on one side (LV), which in turn, is expected to contain more water than those exposed to vapor on both sides (VV). The second explanation involves consideration of interfacial water transport (adsorption and desorption of water), which is known to play a significant role in the overall permeation of water, as discussed by Majsztrik,29 Romero,21 and recently quantified by Monroe et al.35 and Aotani et al.36 In the LLP case, the formation of a liquid-membrane interface and a membraneliquid interface is expected to facilitate ingress and egress of water into and out of the membrane, relative to the LVP case, for which water from the membrane must egress into the vapor phase, and relative to the VVP case, for which water must ingress from, and egress to, the vapor phase.
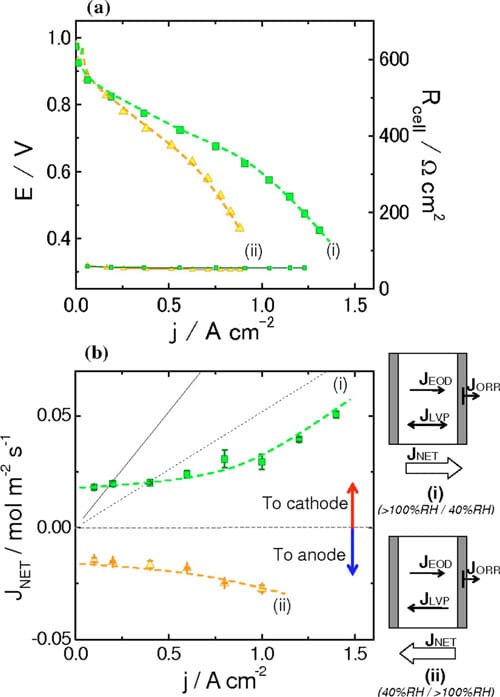
Figure 8. (Color online) (a) Polarization curves for NRE211-based MEAs obtained under different conditions. (b) Net water flux as a function of current density obtained under different conditions. Dashed and solid lines indicate the estimated EOD flux for Nd = 0.5 and 1.0, respectively. (i) RHanode > 100%, RHcathode = 40%, RHanode = 40%, RHcathode > 100%. Cell temperature, 70°C. H2 and air were supplied in a stoichiometric ratio 2.0: 3.0 at ambient pressure.
Despite the fact that the formation of liquid/membrane interfaces leads to a high permeability coefficient for water, the absolute permeability of water is observed to be largest for the LVP measurements (see Fig. 7). This is because the presence of vapor on one side of the membrane creates a much larger chemical potential driving force (three to four orders of magnitude greater than for the LLP system). Δμ is relatively small for all reasonable hydraulic pressures used in the LLP measurement, because pressure is an ineffective method for raising the chemical potential of a liquid. The presence of a liquid-membrane interface, however, is noticeable when comparing the absolute permeability of water under LVP conditions relative to VVP conditions. The absolute permeability of water for the LVP measurements is much greater than for VVP measurements, even though Δμ is similar for both. Clearly, interfacial phenomenon (i.e., a liquid/membrane interface vs a vapor/membrane interface) is of great importance to the permeability of water. A similar conclusion is stated by Majsztrik22 and others.21,36
In situ measurements of water permeation.— Polarization curves and water transport through the MEA.— Polarization curves for NRE211-based MEAs at 70°C and under two different operating conditions are presented in Fig. 8a. The operating conditions are: (i) wet anode (>100% RH, TDP = 75°C) and dry cathode (40% RH) and (ii) dry anode (40% RH) and wet cathode (>100% RH, TDP = 75°C).
The highest current was observed for case (i), when the anode was fully humidified and the cathode was operated with air introduced at lower humidity. Under these conditions, 0.97 A cm-2 was generated at 0.6 V. When the anode was fed with gases at a lower humidity and the cathode was fully humidified, the single-cell performance reduced to 0.67 A cm-2 at 0.6 V. The correlations of performance with the different operating conditions is not unexpected: For case (i), reducing the humidity at the cathode reduces the likelihood of its flooding, while fully humidifying the anode reduces its propensity to dehydrate; case (ii) promotes flooding at the cathode and dehydration of the anode, relative to case (i). The performance under these conditions is discussed later.
Water transport through NRE 211 MEAs.— Net water fluxes at the anode were measured for fuel cells operated under the same conditions described above. These fluxes are plotted in Fig. 8b as a function of current density. In case (i), a positive water flux (anode to cathode) was observed. This is because both the chemical potential gradient, Δμ, formed by application of the differentially humidified gases, and the EOD flux act in concert to direct water from the anode to the cathode. For current densities up to ~0.4 A cm-2, the flux of water is ~0.020 mol m-2 s-1. In this regime, where the flux of water due to EOD is not significant with respect to the measured flux, the concentration gradient driven fluxes (i.e., VVP or LVP), is the major contributor to the net water flux. At higher current densities (i.e., >0.6 A cm-2), the EOD flux plays a more significant role in the net water transport and the water flux is observed to increase steadily as more current is drawn.
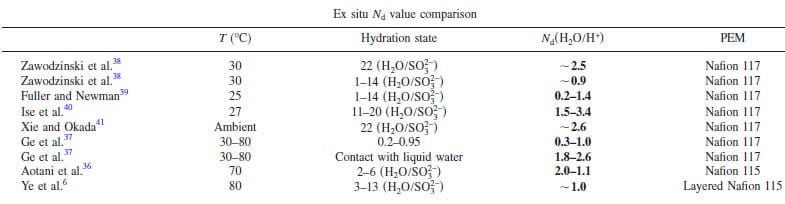
Table I. Comparison of reported Nd values (electro-osmotic drag coefficient value) for Nafion membranes.
In case (ii), a negative water flux (cathode to anode) is observed. For low current densities (<0.4 A cm-2), the net water flux is ~0.015 mol m-2 s-1. As in case (i), EOD is negligible in this region and, thus, the net water flux is due to the permeation of water resulting from the chemical potential gradient that is formed from a fully humidified cathode and partially humidified anode. As the current density is increased (above 0.6 A cm-2), the net water flux toward the anode increases, despite the fact that EOD brings water from the anode to the cathode.
The fluxes of water, shown in Fig. 8b, when extrapolated to zero current are 0.018 and 0.014 mol m-2 s-1 for case (i) and (ii), respectively. The membrane is expected to be exposed to satur
ated water vapor on one side and 40% RH, i.e., they can be described falling under the category VVP according to the terminology of ex situ measurements (see Fig. 4, VVP plot). The similarity of the in situ and ex situ water permeability data are consistent with this. Thus at OCV, the PEM appears to be exposed to water vapor on both sides despite one of the gases being oversaturated with moisture.
When current is drawn from the cell, water is generated at the cathode and the flux of protons creates an EOD that draws additional water to the cathode. The EOD is a nebulous parameter to measure or quantify, because the coefficient, Nd, is highly dependent on the water content of the membrane, as illustrated in Table I, and can vary largely with current density and the net direction of water transport in the membrane. In the context of our work, we consider the scenarios where Nd = 0.5 and 1.0, as Ge et al. have reported EOD coefficients to lie in this range for 0.3–1.0 for vapor equilibrated MEAs.37 Estimates of EOD, ignoring forward or back transport of water, for Nd values of 0.5 and 1.0 are plotted in Fig. 8b as a function of current density.
EOD for Nd = 0.5 is particularly significant in this work as the plot is near parallel to the net water flux vs current for fuel cells operated under conditions described as case (i). At these current densities (1.0–1.4 A cm-2), the measured net water flux increases linearly with current, which is an expected observation when the rate of back transport has reached a limiting value and where further increases in water flux are caused simply by a linear increase in EOD with current.
For fuel cells operated under conditions described as case (i), the measured net water fluxes lie well below those estimated from the EOD flux for Nd = 0.5, except for very low current densities, where the flux of water is dominated by simple permeation. This estimation of Nd = 0.5 is a conservative estimation according to other literature values. Comparing the net water flux of water at 1.0, 1.2, and 1.4 A cm-2 with the flux theoretically generated by EOD (Ndd = 0.5), it is deduced that the actual net water flux of water is consistently 0.022 mol m-2 s-1 lower than the estimated EOD at each current density. This suggests that back diffusion of water to the anode plays a significant role in determining the water balance. This raises the question as to which mode of permeation is operating: LLP, LVP, or VVP? LLP can be quickly discounted because the differential pressure generated in the cell would have to be unreasonably high to achieve this rate of permeation. For instance, ex situ LLP measurements indicate that it requires 0.46 atm differential pressure to support a water flux of 0.022 mol m-2 s-1, as can be derived from Fig. 5, but no such pressure is applied to the fuel cell and it is unlikely the cell would generate this pressure internally. Furthermore, it is highly unlikely that the PEM at the anode is saturated at liquid water; given that it is exposed only to water vapor and that the net flow of water occurs from anode to cathode. Similarly, VVP can be eliminated as a mode for water transport because permeabilities in excess of 0.014 mol m-2 s-1 are only achievable, according to Fig. 4, when the RH on the drier side <38%. Recall that in case (i) the anode is fed with 100% RH hydrogen while the cathode is fed with 40% RH, but water is produced at the cathode and accumulated at the cathode by EOD, so that the effective RH at the cathode at high current is expected to be substantially higher than 40%. Of the three scenarios for water permeation, only LVP is capable of sustaining the rate of water permeation required to account for back transport. As a substantial amount of water is generated/accumulates at the cathode under high current it is not unreasonable to consider that the PEM on the cathode side is exposed to liquid water. The RH of the hydrogen at the anode inlet is at saturation, but the outlet humidities are calculated to be decreased to 99–85 % RH, based on the amount of water introduced and transported, which could generate a chemical potential gradient and may explain why water is transported toward the anode. Figure 4 (LVP) indicates that the water permeability is 0.034 mol m-2 s-1 when the membrane is exposed to liquid water on one side and ~84% RH vapor on the other, which is capable of sustaining the level of back transport calculated above (0.022 mol m-2 s-1). In summary, the back transport of water for fuel cells operated at high current under case (i) [wet anode (>100% RH) and dry cathode (40% RH)] is explained by LVP, wherein the membrane on the cathode side is exposed to liquid water while the anode side is exposed to vapor.
The influence of EOD and back transport on the net water flux for MEAs operated under conditions described by case (ii) [dry anode (40% RH) and wet cathode (>100% RH)] can be reasoned using similar arguments, but taking into account that the initial humidities are reversed. Assuming for sake of discussion that Nd = 0.5, the EOD flux is 0.052 mol m-2 s-1 toward the cathode at 1.0 A cm-2, as given in Fig. 8b. The actual net flux of water is -0.027 mol m-2 s-1, toward the anode, at 1.0 A cm-2. Clearly, back transport of water offsets EOD. The difference in water fluxes indicates that back transport is ~0.079 mol m-2 s-1. If the cathode side of the membrane is considered as being wet and the anode side exposed to 40% RH, then it is reasonable to assume from Fig. 4, that LVP is capable of sustaining the level of back transport.
Conclusion
Liquid-liquid permeation (LLP), liquid-vapor permeation (LVP), and vapor-vapor permeation (VVP) fluxes were measured for dispersion cast, 25 μm, NRE211 membrane at 70°C. Water fluxes increased with increase in chemical potential gradient across the membrane for all three types of permeations. Water permeation coefficients (i.e., water flux values normalized to the chemical potential gradient of water and membrane thickness) were determined for each scenario of water-permeations. The largest water permeation coefficient was obtained for LLP due to the high hydration state of the membrane as well as favorable water sorption and desorption processes at the membrane-bulk water interface. However, the difference in chemical potential of water across the membrane created by application of reasonable hydraulic pressure gradients are calculated to three orders of magnitude smaller than those generated by scenarios described by VVP and LVP. The significance of the chemical potential gradient of water across the membrane is significant in determining the water flux in operating fuel cells.
The water flux through this thin Nafion membrane is largest when the membrane is exposed to liquid on one side and vapor on the other. LVP water transport is largely responsible for regulating water balance within the operating MEA. This leads to a conclusion that formation of a chemical potential gradient for water and good hydration at the interface and across the membrane allows the membrane to self-regulate water content across the operating MEA. When both these factors work together, in the cases of LVP, the water permeation flux is large enough to offset the substantial EOD flux in an operating fuel cell. Learning from this, we believe this experimental approach and the results obtained will serve to enhance our understanding of the interaction between water and PFSA-based PEMs. For example, water balance across NRE211- based MEAs may be designed and optimized for a particular set of operating conditions, and the permeation coefficients reported here may be useful in determining r
equired water permeability criteria for membranes in order that they self-regulate water balances in operating fuel cells.
Acknowledgments
The authors gratefully acknowledge financial support from the NRC-National Hydrogen and Fuel Cell Program. The authors thank Dr. Ken Shi, Dr. Xinsheng Zhao, Dr. Michael Eikerling, Dr. Kourosh Malek, Dr. Marc Secanell, Dr. Tatiana Romero, and Dr. Walter Mérida for fruitful discussions. The authors also thank SFU machine shop and NRC-IFCI design studio for fabrication of the LLP cell and VVP/LVP cells.
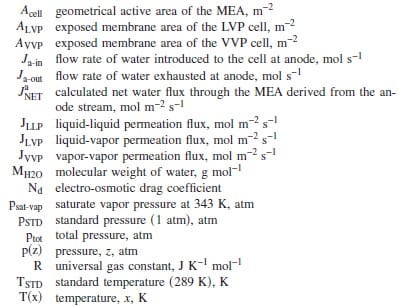
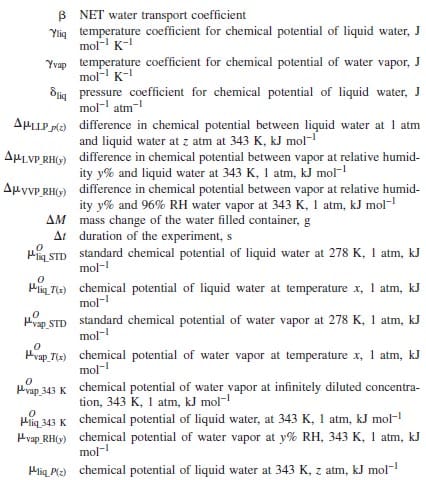
List of Symbols
References
- T. A. Zawodzinski, C. Derouin, S. Adzinski, R. J. Sherman, V. T. Smith, T. E. Springer, and S. Gottesfeld, J. Electrochem. Soc., 140, 1041 (1993).
- K. H. Choi, D. H. Peck, C. S. Kim, D. R. Shin, and T. H. Lee, J. Power Sources, 86, 197 (2000).
- X. Ren and S. Gottesfeld, J. Electrochem. Soc., 148, A87 (2001).
- T. Murahashi, M. Naiki, and E. Nishiyama, J. Power Sources, 162, 1130 (2006).
- F. Liu, G. Lu, and C. Y. Wang, J. Membr. Sci., 287, 126 (2007).
- X. Ye and C. Y. Wang, J. Electrochem. Soc., 154, B676 (2007).
- X. Ye and C. Y. Wang, J. Electrochem. Soc., 154, B683 (2007).
- T. E. Springer, T. A. Zawodzinski, and S. Gottesfeld, J. Electrochem. Soc., 138, 2334 (1991).
- G. J. M. Janssen and M. L. J. Overvelde, J. Power Sources, 101, 117 (2001).
- Q. Yan, H. Toghiani, and J. Wu, J. Power Sources, 158, 316 (2006).
- Y. Cai, J. Hu, H. Ma, B. Yi, and H. Zhang, Electrochim. Acta, 51, 6361 (2006).
- W. R. Vieth, Diffusion In and Through Polymers, p. 5, Oxford University Press, New York (1979).
- D. Rivin, C. E. Kendrick, P. W. Gibson, and N. S. Schneider, Polymer, 42, 623 (2000).
- D. R. Morris and X. Sun, J. Appl. Polym. Sci., 50, 1445 (1993).
- K. K. Pushpa, D. Nandan, and R. M. Iyer, J. Chem. Soc., Faraday Trans. 1, 84, 2047 (1998).
- P. Krtil, A. Trojanek, and Z. Samec, J. Phys. Chem. B, 105, 7979 (2001).
- D. J. Burnett, A. R. Armando, and F. Thielmann, J. Power Sources, 160, 426 (2006).
- S. Ge, X. Li, B. Li, and I. M. Hsing, J. Electrochem. Soc., 152, A1149 (2005).
- J. P. G. Villaluenga, B. Seoane, V. M. Barragan, and C. Ruiz-Bauza, J. Colloid Interface Sci., 268, 476 (2003).
- S. Motupally, A. J. Becker, and J. W. Weidner, J. Electrochem. Soc., 147, 3171 (2000).
- T. Romero, Ph.D. Dissertation, University of British Columbia (2008).
- P. W. Majsztrik, M. W. Satterfield, A. B. Bocarsly, and J. B. Benzinger, J. Membr. Sci., 301, 93 (2007).
- A. Z. Weber and J. Newman, Chem. Rev. (Washington, D.C.), 104, 4679 (2004).
- M. Eikerling, Y. Kharkats, A. A. Kornyshev, and Y. Volfkovich, J. Electrochem. Soc., 145, 2684 (1998).
- A. Z. Weber, Ph.D. Dissertation, University of California, Berkeley (1999).
- ASTM Standard E96-94, Standard Test Methods for Water Vapor Transmission of Materials, p. 696, ASTM, Philadelphia (1994).
- For further information, obtain technical product data sheet DuPont, Nafion PFSA Membranes NRE-211 by DuPont on Nafion PFSA Membranes NRE-212.
- K. Hisatake, S. Tanaka, and Y. Aizawa, J. Appl. Phys., 73, 7395 (1993).
- P. W. Majsztrik, Ph.D. Dissertation, Princeton University (2008).
- D. R. Lide, Handbook of Chemistry and Physics, Vol. 78, pp. 6–8, CRC Press, Boca Raton (1997).
- C. E. Evans, R. D. Noble, S. Nazeri-Thompson, B. Nazeri, and C. A. Koval, J. Membr. Sci., 279, 521 (2006).
- T. Okada, H. Satou, M. Okuno, and M. Yuasa, J. Phys. Chem. B, 106, 1267 (2002).
- G. Job and H. Herrmann, Eur. J. Phys., 27, 353 (2006).
- H. A. J. Oonk and M. T. Calvet, Equilibrium between Phases of Matter, p. 77, Springer, The Netherlands (2008).
- C. W. Monroe, T. Romero, W. Rida, and M. Eikerling, J. Membr. Sci., 324, 1 (2008).
- K. Aotani, S. Miyazaki, N. Kubo, and M. Katsuta, ECS Trans., 16(2), 341 (2008).
- S. Ge, B. Yi, and P. Ming, J. Electrochem. Soc., 153, A1443 (2006).
- J. Zawodzinski, T. E. Springer, F. Uribe, and S. Gottesfeld, Solid State Ionics, 60, 199 (1993).
- T. F. Fuller and J. Newman, J. Electrochem. Soc., 139, 1332 (1992).
- M. Ise, K. D. Kreuer, and J. Maier, Solid State Ionics, 125, 213 (1999).
- G. Xie and T. Okada, J. Electrochem. Soc., 142, 3057 (1995).