

Article
Related Links
Zhong Xie,1 Xinsheng Zhao,1 Makoto Adachi,1,2 Shi Ken,1 Tetsuya Mashio,3 Atsushi, Ohma,3 Kazuhiko Shinohara,3 Steven Holdcroft,1,2 Titichai Navessin,1
1: Institute for Fuel Cell Innovation, National Research Council Canada, 4250 Wesbrook Mall, Vancouver, BC, Canada, V6T 1W5
2: Department of Chemistry, Simon Fraser University, 8888 University Drive, Burnaby, BC, Canada, V5A 1S6
3: Nissan Research Center, Nissan Motor Co.,Ltd., 1, Natsushima, Yokosuka, Kanagawa 237-8523, Japan
2. Experimental (Detailed)
2. Experimental (Detailed)
Both cathode and anode catalyst layers consisted of Pt/C catalyst (46.5 wt% Pt, TEC10E50E, Tanaka Kikinzoku Kogyo) (0.40 mg/cm2 Pt) and 30 wt% Nafion ionomer (5 wt% solution, EW1000, Aldrich). Catalyst inks were prepared using the same physical procedure but employing different dispersion media: 3:1 (w/w) nPA:H2O (Ink-p) and water (Ink-w), where nPA represents n-propanol. For ease of discussion, Ink-p and Ink-w represent propanol- and water-based inks. The ink compositions are summarized in Table 1. Cathode catalyst layers prepared from these inks are correspondingly termed CCL-p and CCL-w; and the corresponding membrane electrode assemblies are termed MEA-p and MEA–w, respectively.
Pt/C catalyst was first wetted with a small amount of water and mixed with the required amount of dispersion medium. The mixture was stirred using a magnetic stir bar for 5 min and sonicated in a water bath (Branson, model 1510) for 30 min at room temperature. Nafion solution was added drop-wise to the dispersion during sonication. The solids content of the ink, i.e., the ratio of Pt/C and Nafion to dispersion media, was controlled to be 1.0 wt%. The catalyst ink mixture was transferred to a shear mixing probe (Misolvix Sonicator 3000) and homogenized for 90 min using on/off cycles of 1 and 0.5 min, respectively, and a power of ~42 W. The on/off cycles were selected to minimize increases in temperature during homogenization.
Nafion membranes (1 mil. thick, NRE-211, DuPont) were used as-received. The anode catalyst layer for all MEAs was prepared from a catalyst ink based on 1:1 (w/w) MeOH:H2O; the cathode catalyst layers were prepared from inks based on different dispersion media. Catalyst-coated membranes (CCMs) having an electrode geometrical surface area of 25 cm2 were fabricated by direct, automated spray coating (EFD-Ultra TT Series). The membrane was secured on a vacuum table heated to 90oC. The anode catalyst layer was first deposited on one side of the membrane, and turned over in order to deposit the cathode. After deposition, CCMs were dried at 80oC for 30 min. Careful measures were taken to ensure a high reproducibility of Pt loading and homogeneity of catalyst distribution. The amount of catalyst deposited was controlled by adjusting the spray parameters and verified by control experiments in which catalyst ink was sprayed onto an inert substrate (Al foil or carbon paper) and the mass deposited weighed. Control experiments were performed prior to, and after, CCM fabrication in order to confirm that the flux remained constant throughout the deposition process. The precise loading of catalyst was also verified by the thermal gravimetric analysis of half-CCM samples obtained from different locations of the CCM. The variation of Pt loading was < 3% over the entire area of the CCM, i.e., < ± 0.01 mg Pt/cm2 for a 0.40 mg Pt/cm2 loading. The batch-to-batch reproducibility of fabricated CCMs was also verified to be > 97%, and the reproducibility of the measured electrochemical surface area (ESA) and fuel cell performance were also validated (see Figure S1 and S2).
2.2. Physical characterization of cathode catalyst Layers (CCL)
2.2.1. SEM
Images of catalyst coated membranes (CCM) were obtained using a scanning electron microscope (Hitachi S4700), by fracturing the CCMs after immersing in liquid nitrogen. The fractured samples were deposited with gold/palladium coating by sputtering. High resolution images were taken at multiple locations for each CCM sample, and analyzed individually.
2.2.2. Hg Porosimetry
Pore size and pore size distribution of catalyst layers were measured on half- CCMs using a Hg porosimeter (Micromeritics, Auto Pore IV9500,) using an applied pressure range of 177 to 33,000 psi, which corresponds to pores 1 µm to 3 nm in diameter. The measurement is based on capillary pressures laws governing liquid penetration into small pores. In the case of a non-wetting liquid, such as mercury, and assuming the pores are cylindrical in shape, the relation of pore diameter to pressure is described by equation (1):
where d is the pore diameter, P is the applied pressure, σ is the surface tension, and θ is the contact angle. The value of σ and θ adopted here are 485 dyn/cm and 130o, respectively. The porosity was calculated according to the measured accumulative pore volume in the catalyst layer, and defined as:
where Vbulk and Vpore are the bulk and pore volume of the catalyst layer. As porosimetric data were collected on half-CCMs, porosimetric data pertaining to the Nafion membrane (NRE-211) was subtracted.
2.3. MEAs and Single Cell
CCMs were 25 cm2 in active geometric area. The perimeter of the CCM was laminated with an inert adhesive film (10 µm thick) that functioned as a sub-gasket, preventing over-compression of the catalyst layer. Non-compressible FEP films (100-200 µm) were used as spacers to obtain optimal compression of the GDLs (carbon paper coated with a microporous layer, SGL, 24BC) with the CCM. The area of the GDL was designed to be larger than the active area of the CCM so that compression of the catalyst layer and the GDL were controlled independently. The latter was adjusted by varying the thickness of the FEP spacers. The CCM was sandwiched between two GDLs and assembled into the single cell possessing straight flow-through channels. The uniformity of cell compression was verified using pressure sensitive film (Pressurex®-Super Low, Sensor Products Inc.).
The single cell was evaluated in a fuel cell test station (800W, Hydrogenics). In order to ensure consistency in the humidification of gases, the inlet lines were fitted with heating tape, thermal couples, and thermally-insulated. The temperature of the cathode and the anode inlet lines were maintained 3o< /sup>C higher than the cell temperature to prevent condensation. The single cell and the gas outlets were thermally insulated. The gases were passed through water condensers and water traps to prevent water from blocking the vent lines, which could cause a build up of back pressure. The gas pressure at the inlets and outlets were monitored to ensure that there was no backpressure across the cell. Humidification of gases was controlled by the temperature of the humidification tanks. The humidified gases were calibrated using the wet/dry bulb method. The gas flow rates were calibrated using a digital flow meter (Alicat Scientific). In order to verify the accuracy of the electrical output data, the cell current and potential were monitored using a 1 mΩ shunt and a high-resolution multi-meter (Agilent 34401A). The high frequency resistance (HFR) of the cell was measured at 1 kHz using a digital resistance meter (Digital AC m-ohm tester 3566-01, Tsuruga Electric Corporation).
2.4. MEA testing protocol
The single cell was connected to the test station and heated to 80oC without gas being supplied to the cell; the anode and the cathode humidifiers were heated to 80oC; and the gas supply inlet lines were heated to 83oC. After the set temperatures of cell and lines were achieved, the anode was electrically shorted to the cathode for a few minutes to deplete traces of hydrogen, hydrogen gas was then supplied to the anode. After removal of the shorting leads, humidified O2 was introduced to the cathode. When an open circuit potential (OCP) of ~ 1.0 V was reached, a DC load was applied to the cell and 1 A cm-2 drawn from the cell for 6 h. The potential stabilized after ~3 hours. At the end of the conditioning period, the variation in the steady state potential was < ± 1 mV.
2.4.2. Electrochemical Surface area (ESA)
ESA was measured by cyclic voltammetry (CV) using a potentiostat (1287A, Solartron Analytical). The anode and cathode were purged with humidified H2 (0.50 SLPM, 80oC) and N2, (0.50 SLPM, 80oC), respectively. Just prior to cyclic voltammetry, the N2 flow was stopped in order to maintain consistent humidification and to minimize gas fluctuations at the catalyst/gas/liquid interface. Voltammograms were recorded using a 50 mV s-1 scan rate between 0.90 to 0.04 V vs. the anode, which served as the standard hydrogen electrode. The electrochemically active area was determined by integration of the voltammetric peak for hydrogen desorption and adsorption using 210 µC cm-2 as the conversion factor for charge to area[22].
2.4.3. H2 Cross-Over
The H2 crossover current density (iHX) was measured by potential step voltammetry under operating conditions similar to those described in the cyclic voltammetric measurements, except that H2 and N2 gases were continuously supplied to the cell during the measurement. The anode served as the reference standard hydrogen electrode. The cathode (working electrode) potential was stepped from 0.2 to 0.5 V in 0.1 V increments and 3 min equilibration times. Traces of H2 that crossed over from the anode were oxidized at the cathode. At a potential > 0.20 V, the working electrode is mass transport limited for the hydrogen oxidation reaction (HOR), and thus the steady state current density corresponds to the H2 crossover current density (iHX).
2.4.4. Protonic conductivity of the catalyst layer
The protonic conductivity in the catalyst layer was characterized using electrochemical impedance spectroscopy (EIS). EIS was conducted on MEAs using the same operating conditions as the potential step voltammetry measurements described above. In addition, the potentiostat was connected to a frequency response analyzer (1260A FRA, Solartron Analytical). The amplitude of sinusoidal current signal for AC impedance was set at 10 mV (root mean square) over a frequency range 20 kHz to 0.1 Hz. For determining the ionic conductivity of the cathode catalyst layer, the cathode was purged with humidified N2, and the anode was fed with humidified H2 at flow rate of 500 ml/min. EIS spectra were measured under a DC bias potential of 0.45 V vs SHE (the anode).
2.4.5. ORR Kinetics
The single cell was maintained at 80oC and high flow rates of reactant gases were supplied: 4 SLPM of H2 and 8 SLPM of O2. After holding the cell at OCP for two min, the current load was increased to ~1 A cm-2. The current load was gradually decreased from 1.0 to 0.2, 0.1, 0.08, 0.06, 0.04 and to 0.024 A cm-2, and equilibrated for 15 min. at each current density to reach a steady state. The cell potential was plotted against the log of current density, and the Tafel slope was extracted.
2.4.6. Polarization Curves
The beginning of life (BOL) performance of the MEAs were evaluated at 80oC under different relative humidities (70 and 30 % RH for both anode and cathode) and back pressure (ambient pressure and 200 kPa absolute). The cell was supplied with 4.0 SLPM of H2 and 8.0 SLPM of air to the anode and cathode, respectively. After the OCP (>0.90V) was achieved and the variation was <5 mv over 10 min., i.e., stable ocp, the polarization curve was obtained galvanostatically. current density increased from 0.0 to 0.008, 0.024. 0.04, 0.06, 0.1, 0.2, 0.4, 0.6, 0.8, 1.0, 1.2, 1.4, 1.6, 1.8 and finally 2.0 a cm2. Within the current density range, 0 ~ 0.1 A cm-2, the current was held at each point for 3 min to allow the potential to reach steady state; whereas in the range, 0.1 – 1.0 A cm-2, the potential was measured after 5 minutes.
Reproducibility of fabricated membrane electrode assemblies
The reproducibility of MEAs were validated by evaluating five batches of MEA samples fabricated using the same physical processes and the same catalyst layer specification for the anode and the cathode. The cyclic voltammograms of the MEAs are shown in Figure S1. The average ESAs determined from hydrogen adsorption and desorption regions are 59.3 ± 2.5 and 58.2 ± 0.9 m2/g, respectively. The H2/air fuel cell performances at 70%/70% relative humidify of anode and cathode and 80oC of the MEAs are reported in Figure S2 At 1.0 A/cm2, the cell potential is 0.55 ± 0.01V. This variation is considerably lower than the differences in performance caused by different dispersion media.
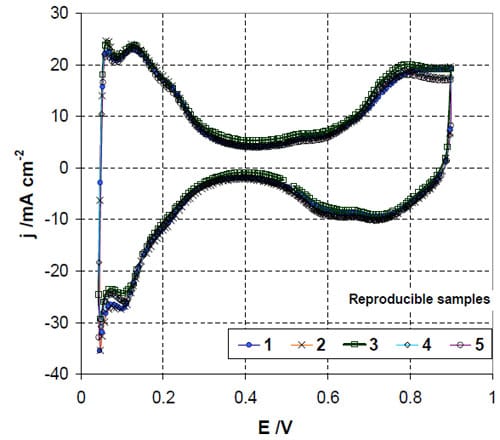
Figure S1: Cyclic voltammograms of five batches of baseline MEA-p: 80oC, RH 100 %, 50 mV/s.
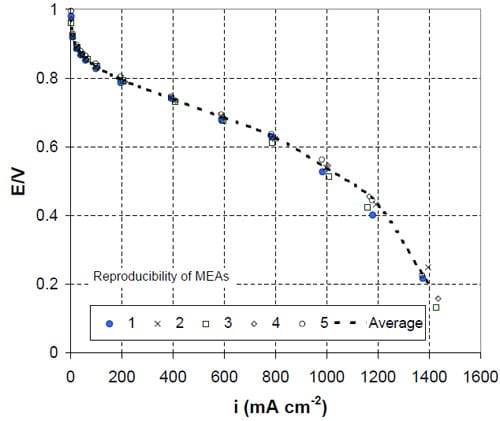
Figure S2: Reproducibility of fuel cell performance of five MEA-p: 80oC, RH 70%/70% anode/cathode, H2/air.
![]()