

Article
Related Links
F. Pérez-Rodri´guez a,*, A. Valeroa, E.C.D. Todd b, E. Carrasco a, R.M. Garcéa-Gimeno a, G. Zureraa
a Department of Food Science and Technology, University of Co´ rdoba, Campus de Rabanales, C-1, 14014 Co´ rdoba, Spain
b National Food Safety and Toxicology Center, 165 Food Safety and Toxicology Building, Michigan State University, East Lansing, MI 48824-1314, USA
Abstract
Cross contamination is one of the most important contributing factors in foodborne illnesses originating in household environments. The objective of this research was to determine the transfer coefficients between a contaminated domestic slicing machine and a cooked meat product, during slicing. The microorganisms tested were Staphylococcus aureus (Gram positive) and Escherichia coli O157:H7 (Gram negative). The results showed that both microorganisms were able to transfer to all slices examined (20 successively sliced) and at different inoculum levels on the blade (108, 106 and 104 cfu/blade). The results also showed that the number of log cfu transferred per slice, during slicing, decreased logarithmically for both microorganisms at inoculum levels of 8 and 6 log cfu/blade. The type of microorganism significantly influenced transfer coefficients (p < 0.05) and there was an interaction between inoculum level and transfer coefficient for S. aureus (p < 0.05), but not E. coli O157:H7. Finally, to describe bacterial transfer during slicing, two models (log-linear and Weibull) were fitted to concentration on slice data for both microorganisms (at 6 and 8 log cfu/blade), obtaining a good fit to data (R2 P0.73). © 2007 Elsevier Ltd. All rights reserved.
1. Introduction
In Spain, from 1993 to 1998, 49% of foodborne outbreaks occurred in the household environment, Salmonella being the main pathogen (~60%) followed by Staphylococcus spp. (BgVV-FAO/WHO, 2000; Hernandez et al., 1998). These data showed that consumers often failed to store, handle and prepare food in a hygienic and safe manner. Moreover, studies such as those of Gorman, Bloomfield, and Adley (2002), Mattick et al. (2003) and Bloomfield (2003) have demonstrated the ability of pathogens such as Staphylococcus aureus, Escherichia coli, Salmonella and Campylobacter to be transferred from contaminated food to hand and food contact surfaces in the kitchen. Thus, Beumer and Kusumaningrum (2003) and Bloomfield and Scott (1997) stated that cross contamination in the kitchen environment can be a significant factor in the household outbreaks.
Reij, Den Aantrekker, and ILSI Europe Risk Analysis in Microbiology Task Force (2004) reviewed scientific literature on recontamination routes and sources (e.g. raw materials, food contact surfaces, food handlers, etc.) and demonstrated their relevance to foodborne disease outbreaks. They also suggested that such knowledge on recontamination should be incorporated into exposure assessments of quantitative microbiological risk assessments (QMRA) to help in determining mitigation strategies to reduce foodborne disease. Thus, the importance of performing QMRA (Codex Alimentarius Commission, 1999) has led to researchers to try and quantify cross contamination events. For instance, Zhao, Zhao, Doyle, Rubino, and Meng (1998), Chen, Jackson, Chea, and Schaffner (2001), Montville, Chen, and Schaffner (2001) determined the transfer coefficient of Enterobacter aerogenes as a surrogate microorganism for Salmonella through different handling scenarios. The transfer coefficient is the proportion of cells that is transferred between surfaces (food, equipments, tools, hands, etc.) under one or more operations. The study provided probability distributions of transfer coefficients associated with different handling tasks, and also demonstrated that the microorganism could be transferred from hands to food even with the use of gloves. In addition, Kusumaningrum, Riboldi, Hazeleger, and Beumer (2002) noted that the transfer ability of S. aureus, Campylobacter jejuni and Salmonella enteritidis between cutting board and foods at different pressure levels was not dependent on the type of microorganism.
Recent outbreaks caused by E. coli O157:H7 associated with cross contamination between raw meat and raw vegetables prompted Wachtel, Mcevoy, Luo, William Campbell, and Solomon (2003) to quantify the transfer of E. coli O157:H7 from raw contaminated meat to hands and cutting surfaces, and then to iceberg lettuce by contaminated hands and cutting boards. They studied the effect of successive contacts (cutting lettuce leaves with a contaminated knife) on whether or not and how much was transferred. The result revealed the random nature of cross contamination events when they used low inoculum. This fact was also pointed out by Vorst, Todd, and Ryser (2006) when slicing deli meats with a blade inoculated with 103 cfu of Listeria monocytogenes. Also, in previous studies, we simulated the transfer of S. aureus and L. monocytogenes to a cooked meat product through a slicing machine; the results indicated that bacteria were transferred logarithmically to slices during slicing (Pe´rez-Rodri´- guez et al., 2004; Vorst, Todd, Pe´rez-Rodri´guez, McMasters, & Ryser, 2004).
In the present work, we determined the transfer coefficients at different inoculum levels of two pathogens, one Gram positive (S. aureus) and the other Gram negative (E. coli O157:H7), between a contaminated slicing machine and a cooked meat product. Finally, two mathematical models were fitted to concentration on slice data to enable its inclusion in QMRA.
2. Materials and methods
2.1. Inoculum preparation
Five strains of S. aureus (CCM 1484, ATCC 13565, CCTM La 2812, ATCC 19095, ATCC 23235) and four of E. coli O157:H7 (CCUG 20570, ATCC 35150, ATCC 43894, ATCC 43895) were obtained from the Spanish Type Culture Collection (CECT). All strains were maintained at -18 °C in cryovials containing beads and cryopreservative (Microbanktm). Three days before the experiment, a bead of each strain was transferred to a tube containing 10 ml of Tryptone Soya Broth (TSB, Oxoid, UK) and incubated at 37 °C for 24 h. Then, 1 ml of the initial subculture was pipetted into a tube containing 10 ml of TSB, and incubated at 37 °C for 24 h. Finally, a third subculture was obtained in the same way, incubating 1 ml of inoculum in a flask of 100 ml of TSB until the early stationary phase was reached (16 and 18 h for E. coli O157:H7 and S. aureus, respectively). Cocktails of strains for each pathogen were generated by mixing 10-ml aliquots containing similar numbers of each strain, diluted in TSB to approximately 104, 106 and 108 cfu/ml.
2.2. Slicing machine and artificial contamination
Before use, a domestic
slicer and a polished stainless steel blade (Demoka®, M-381 Zeta Plus Ø) were disinfected with 70% (v/v) ethanol for 10 min. Then, both were washed with hot water with anionic-active detergent and rinsed with distilled water. The slicing machine surfaces and the blade were sprayed with 70% (v/v) ethanol which was allowed to evaporate prior to any contamination step. The blade was inoculated at the different concentrations (104, 106 and 108 cfu) with a pipette containing 0.5 ml of TSB of the appropriate cocktail. The TSB medium was used to simulate soiled conditions on the blade (Moore, Sheldon, & Jaykus, 2003). The inoculum was allowed to dry in a laminar flow cabinet for 50 min at 25 °C and 50% relative humidity.
2.3. Transfer of S. aureus and E. coli O157:H7 from contaminated blade at different inoculum levels via the slicer to uninoculated cooked meat product by slicing
Large pieces of pork were used to simulate a delicatessen meat product that could be contaminated with the inoculated blade. Each piece of pork was trimmed to be uniform so that all slices had a similar area and weight, and have a plain and uniform surface for slicing. After drying, the inoculated blade was placed in the slicer, and then a pork piece was sliced up to 21 times to yield slices (7–10 g each). Each slice was picked up as it came off the machine using a pair of sterilized pincers and placed in sterile stomacher bags. Three repetitions for each inoculum level were performed. The pressure applied on the pork piece was assumed to be similar to that occurring on household slicing.
2.4. Estimation of the force or pressure applied during slicing
A sensor film provided by Sensor Products Inc was utilized to estimate the force level applied during slicing. The type of sensor film was Ultra Low Pressurex®, intended for a pressure range of ~2–6 kg/cm2. The sensor film was placed between the pork piece and the guard area of the slicer. Next, the pork piece was pushed against the blade simulating a normal slicing process in a retail delicatessen. Then, the sensor film was removed and prepared according to manufacture’s instructions to be sent for exhaustive image analysis; this analysis revealed the pressure distribution applied to the pork surface.
2.5. Microbiological analysis
2.5.1. Efficacy of the disinfection process
To prove the effectiveness of the disinfection process, Plate Count Agar (PCA, Oxoid, UK), MacConkey Agar (MCA, Oxoid, UK) and Baird Parker agar/medium (BP, Oxoid, UK) with tellurite egg yolk supplement (Oxoid, UK) Rodac plates were pressed on three different zones in the slicing machine, including the blade, and incubated at 30 °C for PCA and 37 °C for MCA and BP.
2.5.2. Chopped pork piece control
Before each experiment, two samples (10 g) of pork were placed into sterile stomacher bags with peptone buffer 1% and homogenized in a Stomacher (Seward Stomacher 400 Colworth House, England) for 2 min and tested for the presence of S. aureus and E. coli O157:H7 using the enrichment methods described below.
2.5.3. Quantification of transfer
To estimate the number of viable cells transferred during the slicing process (up to 21 slices), slices were placed independently into sterile stomacher bags and filled with 90 ml of peptone buffer 1% and then homogenized in the Stomacher for 2 min. Serial decimal dilutions were prepared in 0.85% saline solution, cultured on agar plates and the colonies were enumerated. The selective medium and conditions for S. aureus were BP with tellurite egg yolk supplement incubated at 37 °C for 48 h and for E. coli O157:H7, MCA incubated at 37 °C for 24 h was used. As required, the samples giving no detectable counts by direct plating were enriched by incubating the flasks containing homogenized samples at 37 °C for 24 h. In the case of the S. aureus assay, the flasks were supplemented with NaCl and sodium pyruvate to reach a concentration of 20% and 1%, respectively. In the case of E. coli, the flasks were supplemented with cefixime and vancomycin (Dodd et al., 2003). Then, the enriched samples were examined for presence/ absence by spreading 10 ll of enriched samples on BP tellurite egg yolk in the case of S. aureus and Sorbitol Mac- Conkey with potasium tellurite and cefixime for E. coli O157:H7 (SMAC, Oxoid, UK) (37 °C for 24 h). Any growth on the SMAC plates which had shown characteristic colonies of E. coli O157:H7 was considered to have been transferred from the blade to the slices.
2.6. Data and statistical analysis
The detection limit of the microbiological analysis varied depending on the slice weight, but was on average around 30 cfu/slice for both pathogens. For data analysis, we used this limit on those slices in which counting was not possible, but were positive in the enrichment analysis.
The concentration of pathogen on the slices was expressed per cm2 of slice and logarithmically transformed (log cfu/cm2) in Excel (Microsoft Corporation) spreadsheet. Two different mathematical models were fitted to the data to describe the concentration variation on the slice as a function of the number of the slice taken (Nslice = 1, 2, . . ., 20).
In this study, transfer coefficient is the logarithm of the proportion (%) of bacterial cells transferred from the blade to each slice (expressed per cm2) (1). The transfer coefficients were tested by analysis of variance (ANOVA), and Duncan’s multiple-range tests using SPSS 12.0 software (SPSS Inc., NC) for the factors, type of microorganism and inoculum level on the blade
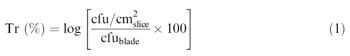
equation 1
where Tr (%) is the transfer coefficient; cfu=cm 2 slice is the concentration on each slice; and cfublade is the initial concentration on the blade.
2.7. Mathematical models
A log-linear model (log(B) = log(A) – k Æ N) has been used in previous studies to describe attachment strength of bacteria on surfaces (ease of removal) (Midelet & Carpentier, 2002; Veulemans, Jacqmain, & Jacqmain, 1970). The model assumes first-order kinetics. Such a model was fitted to experimental data consisting of the number of colonies transferred to successive plates by contact or swabbing (Eginton, Gibson, Holah, Handley, & Gilbert, 1995; Eginton, Holah, Allison, Handley, & Gilbert, 1998; Richard & Piton, 1986). The steeper the slope, the weaker the microorganisms’ attachment strength. Based on this approach, we propose to use the log-linear model (semilogarithmic model) described by Eq. (2) to determine the bacterial concentration on the successive slices:
![]()
equation 2
where Nslice is the number of slice (Nslice = 1,2,. . ., 20); Islice is the concentration (log cfu/cm2) on the slice Nslice; Iblade is a regression parameter (the intercept); and k/ln (10) is a regression parameter related to the slope through the calculation.
We decided to also use a non-linear model to model the data. We chose the Weibull model because the underlying principles of this model allows modeling of the processes occurring during bacterial transfer between surfaces. Weibull distributions are usually applied to objects with a large number of links, each of which has a certain probability of breaking. In many cases, when only one link breaks, the object can experience failure (Olkin, Gleser, & Derman, 1980). For this reason, Weibull distributions are widely used to model lifetime or failure time events (e.g. bulbs lifetime, fatigue of materials, etc.). Furthermore, Weibull distributions are often used to model the time interval between successive, random, independent events that occur at a variable r
ate (Cullen & Frey, 1999; Vose, 2000). In predictive microbiology, Weibull models have been applied to represent the logarithmic process of bacterial inactivation (Ferna´ndez, Collado, Cunha, Ocio, & Marti´nez, 2002; Peleg & Cole, 1998). In cross contamination events, the initial bacterial population on a surface includes a complex net of interactions between the bacteria and the contact substrate through attachment, in which each component has a certain probability of breaking. To enable bacterial transfer between surfaces it is necessary that these interactions fail (attachment structures), and bacteria can travel from one surface to another (Dickson, 1990). Therefore, based on this hypothesis, contamination or recontamination between surfaces by contact could be described by means of a probability curve of breaking probabilities, i.e. the Weibull distributions. The other advantage of using Weibull distributions, compared to others such as exponential or gamma distributions, is its high flexibility to fit to many types of data (Vose, 2000). The Weibull model used to fit the data is shown in Eq. (3), which has two parameters, a and b. The parameter a is considered as a reaction rate constant and b as a behaviour index. This model reduces to a linear model when b = 1
![]()
equation 3
3. Results and discussion
The analysis of the control samples performed on the pork pieces confirmed the absence of E. coli O157:H7 and S. aureus. The first slice of every assay was discarded since the contaminated side of the blade did not come into contact with this slice, and it was therefore not contaminated.
The image analysis obtained by Ultra Low Pressurex® showed that pressure was variable along the slice surface (Fig. 1). The highest pressure was around 6.75 kg/cm2, but more typical values showed pressure on the slices around 2.50 kg/cm2.

Fig. 1. Distribution of pressures along the slice area observed during simulation of slicing obtained by using Ultra Low Pressurex®.
3.1. Low transfer ability
The summary of the experimental data are shown in Table 1. The transfer values expressed as Tr (%) ranged between 1.11 and – 4.34 log, values corresponding to S. aureus at 8 log cfu/blade and E. coli O157:H7 at 6 log cfu/blade, respectively. The magnitude of transfer data was much lower than the levels found by Kusumaningrum et al. (2002), who showed that 25–100% (expressed arithmetically and per cm2) of S. aureus, Campylobacter jejuni and S. Enteritidis on stainless steel boards was transferred to roast chicken and cucumber. Similarly, Scott and Bloomfield (1990) reported transfer coefficients of approximately 20% and 21% for E. coli and S. aureus, respectively, from contaminated laminate surfaces to stainless steel bowl with low initial inoculum levels. This is consistent with the findings of Moore et al. (2003) who demonstrated that the mean transfer coefficients from contaminated stainless steel to lettuce ranged from 2.3% to 66% for Salmonella and from 16.3% to 38.4% for Campylobacter. In contrast, lower transfer coefficients generally occur with non-uniform or porous surfaces such as faucets, sponges and hands. An example is the transfer of only 0.47% E. coli from a damp cloth (inoculated with 107 cfu/cm2) to the human hand (Mackintosh & Hoffman, 1984). Similar transfer levels were reported by Chen et al. (2001) for E. aerogenes transfer between chicken, hands and spigots and by Wachtel et al. (2003) for E. coli O157:H7 through fingers. Rusin, Maxwell, and Gerba (2002) reported transfer coefficients between 28% and 65% for non-porous surfaces such as faucets or phone receivers with a high initial inoculum level of 108 cfu/fomite, but <0.01% when porous surfaces were used, e.g. sponge, dishcloth, laundry. This is understandable since most of the inoculum is no longer in contact with the surface of the transfer material. Even though our data indicated low transfer rates, this can be explained because a slicing machine is different from the static contact experiments in the other studies. Transfer during slicing involves horizontal movement between surfaces when cooked meat surface runs over the blade, and at the same time the latter revolves rapidly. Thus, food particles with the inoculum would tend to be spun off during the slicing process onto other parts of the slicing machine and also into the environment. This is what Vorst et al. (2006) found for Listeria monocytogenes in deli meats on a similar slicing machine.

Table 1
Summary of the transfer data for S. aureus and E. coli O157:H7 from an inoculated slicing machine blade to pork pieces at inoculum levels of 8, 6 and 4 log cfu/blade
3.2. Logarithmic decrease during slicing
In Fig. 2, the transfer results for S. aureus expressed as cells transferred per slice (log cfu/cm2) are represented against number of slice. At inoculum levels of 8 and 6 log cfu/blade, cells transferred per slice decreased logarithmically from the first documented slice to the last slice in increments of 1.68 and 1.74 log cfu/cm2, respectively. In the case of 4 log cfu/blade, the results showed a high degree of variability as shown in Fig. 2, where bars representing the standard deviation were larger. Moreover, transferred cells per slice did not seem to follow a clear trend, probably due to the low precision of the microbiological method at low concentrations. Nevertheless, cells transferred per slice decreased logarithmically from the first documented slice to the last slice at 0.80 log cfu/cm2 which might be considered within the experimental error range (Mossel, Corry, Struijk, & Baird, 2005).
The results for E. coli O157:H7 in Fig. 3 show that for 8 and 6 log cfu/blade, the cells transferred per slice decreased logarithmically from the first documented slice to the last slice at 1.44 and 2.03 log cfu/cm2, respectively, showing a linear-logarithmic trend as in the case of S. aureus. For the lowest inoculum of 4 log cfu/blade, no counts were obtained in any of the slices in the three repetitions. However, the analysis by enrichment demonstrated that the 20 slices were contaminated by E. coli O157:H7.
The highest quantity of cells transferred per slice did not always correspond to the first slice. For example, at 6 log cfu/blade, although the first slice had 3.71 ± 0.27 log cfu/ cm2, the highest concentration was marginally higher for the second and third slices, 3.87 ± 0.26 and 3.80 ± 0.41 log cfu/cm2, respectively. This same observation can be observed for E. coli O157:H7 at 8 log cfu/blade, in which the first and second slice had 3.97 ± 1.10 and 4.66 ± 0.72 log cfu/cm2, respectively. These facts can be seen visually in Figs. 2 and 3.
 of S. aureus from an inoculated slicer blade")
Fig. 2. Transfer (log cfu/cm2) of S. aureus from an inoculated slicer blade with 8 (Diamond), 6 (Triangle) and 4 (Square) log cfu/blade. Data reported are means ± standard deviation for three replicates. The log-linear (- – – -) model and Weibull (—-) models fitted to transfer data at 8 and 6 log cfu/blade.
 of E. coli O157:H7")
Fig. 3. Transfer (log cfu/cm2) of E. c
oli O157:H7 from an inoculated slicer blade at 8 (Diamond) and 6 (Triangle) log cfu/blade. Data reported are means ± standard deviation for three replicates. The log-linear (- – – -) model and Weibull (—-) models are fitted to transfer data at 8 and 6 log cfu/blade.
3.3. Influence of microorganism type and inoculum size on transfer coefficients
The analysis of variance of the transfer coefficients (Tr (%)) at 8 and 6 log cfu/blade, according to Eq. (1), showed significant differences between both microorganisms (p = 0.014). Also, the analysis of variance of the TrT (%) in 20 slices (log [cfu transferred in 20 slices/cfu initially on blade] · 100) at 8 and 6 log cfu/blade revealed significant differences for the type of microorganism (p = 0.003). A possible explanation for this is the different susceptibility of both microorganisms to stressful environmental conditions, which is higher for E. coli O157:H7. Kusumaningrum et al. (2002) reported no significant differences in transfer coefficients among their inoculated strains (S. aureus, C. jejuni and S. Enteritidis) when roasted chicken and cucumber were contaminated under pressure. However, without pressure, the analysis of variance did indicate significant differences for the three organisms. In this scenario, in addition to the absence of pressure, the shorter drying time prior to contact (≤15 min), and relatively high resistance under stressful conditions for the test microorganisms (the most susceptible microorganism to slow-air-drying, C. jejuni, was detectable on contaminated surface until 4 h) could explain the divergence in results between the studies. Moreover, Eginton et al. (1995) did not find significant differences in the degree of attachment to surfaces between the microorganisms, which may affect their transfer ability.
In respect to the inoculum level effect, the analysis of variance and Duncan’s test performed on the first six slices (with the highest transfer coefficients) showed significant differences for S. aureus (p = 0.027) but not for E. coli O157:H7 (p = 0.894). The analysis of variance including 20 slices gave the same result. Thus, for S. aureus, there was significant difference (p = 0.034) and Duncan’s test indicated the existence of two homogeneous groups, the first one formed by the transfer data of 4 and 6 log cfu/ blade and the second one formed by 6 and 8 log cfu/blade (Table 1).
Other variance analysis performed by comparing the TrT (%) indicated no significant difference between inoculum levels for S. aureus and E. coli O157:H7 (p = 0.327 and 0.982, respectively) (Table 2). Therefore, it can be concluded, for S. aureus, the 8 and 6 log cfu/blade inoculum level group exerted a statistically different effect on Tr (%) from the 6 and 4 log cfu/blade group. However, in the case of E. coli O157:H7 it was clear that the inoculum size did not influence the transfer capability of the microorganism. These conclusions did not agree with those reported by Montville and Schaffner (2003) who stated that ‘‘When the population of bacteria on the source surface was high, the log 10% transfer was relatively low. Where the population on the source surface was lower, the log 10% transfer tended to be higher’’. Our results are more consistent with the findings of Kusumaningrum et al. (2002) who did not find significant differences between different inoculum levels for S. aureus, C. jejuni and S. Enteritidis, and of Dickson (1990), who worked with L. monocytogenes and Salmonella typhimurium.

Table 2
Regression parameters and goodness-of-fit indices for both semi-logarithmic and Weibull models obtained from transfer data of S. aureus and E. coli O157:H7 at 8 and 6 log cfu/blade
3.4. An example of modeling transfer data for the QMRA
Transfer data obtained for the levels 6 and 8 log cfu/ blade were used to fit the two mathematical models described previously, which could be applied in QMRA to describe cross contamination scenarios. We only used the data at high inoculum levels for S. aureus and E. coli (log 6 and 8 cfu/blade), because the transfer trends at 4 log cfu/blade were not obvious and much of the transfer data were generated through enrichment. To perform the model, we preferred to use, as transfer unit, the concentration transferred onto the slice (log cfu/cm2) since this could be easily interpreted and used by modelers in QMRA. Nevertheless, the models represented by Eqs. (2) and (3) could be log-back-transformed easily resulting in Eqs. (4) and (5) for the log-linear and the Weibull model, respectively:
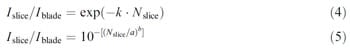
Equation 4 and 5
Eqs. (4) and (5) return the transfer coefficients measured as a fraction of 1, but it could also be expressed as % cfu/cm2 if multiplied by 100.
Parameters and goodness-of-fit indices for the log-linear and Weibull model are shown in Table 2, and the fitting lines are plotted in Figs. 2 and 3. With regard to the log-linear model, S. aureus and E. coli presented a logarithmic trend at 8 and 6 log cfu/blade (R2 = 0.73–0.95), though S. aureus showed the best fit as shown by the values of standard error of prediction (SEP) and R2 (Table 2). These findings agree with the results of Vorst et al. (2006) who reported that with 8 log/blade, the number of L. monocytogenes cells transferred to ready-to-eat turkey and bologna decreased logarithmically during slicing (R2 > 0.92). At 8 and 6 log cfu/blade, the model showed higher slopes for E. coli O157:H7 (k/ln(10) = 0.11 and 0.10, respectively) than for S. aureus (k/ln(10) = 0.08 and 0.09, respectively). Therefore, when using a log-linear model to describe the transfer, these results would indicate that the logarithmic decrease was slightly more rapid for E. coli O157:H7 at 8 log cfu/blade.
Parameters and goodness-of-fit indices for the Weibull model are shown in Table 2 and the fitting lines are plotted in Figs. 2 and 3. In comparison, the Weibull model presented a better fit than the log-linear for both microorganisms (Table 2). In the case of E. coli at 8 log cfu/blade, the Weibull model almost described a log linear model since the value for the parameter b was practically 1. Hence, both curves overlap as can be seen in Fig. 3. Though the goodness- of-fit indices showed little difference between the models, we believe that the Weibull model overall best models the experimental data, especially where the first slices showed much higher concentration than the rest (two phases in the curve), e.g. at 6 log cfu/blade for E. coli O157:H7 (Fig. 3). These values are crucial in risk, so a better fit in this zone would lead to more accurate risk estimation in QMRA. In this respect, the application of the Weibull model would be more relevant for S. aureus due to the fact that production of enterotoxin is mainly associated with relatively high concentrations of pathogen, i.e. >105 cfu/g (Anunciaçäo, Linardi, do Carmo, & Bergdoll, 1995; Rörvik & Granum, 1996). However, for E. coli O157:H7, it is well-recognized that the infectious dose is well under 100 organisms (Tilden et al., 1996).
4. Conclusion
Firstly, the results show that all the pork slices could be contaminated by both pathogens at the inocula of log 4, 6 and 8 log cfu/blade, even though the transfer was lower than in other transfer scenarios. As expected, the first slices had the highest contamination levels, and the risk of illness would be higher after eating these compared to the subsequent slices in a product being sliced. This fact is even more relevant in those pathogens that should be ingested at high dose to produce illness, such as L. monoc
ytogenes or S. aureus (but not E. coli O157:H7). However, the risk of the latter slices causing illness would be increased if growth of the pathogens were allowed during storage. This would be less likely for S. aureus unless the slices were kept at ambient temperatures for several hours to produce enterotoxin; nevertheless this has happened with other foods in causing mass casualities (Do Carmo et al., 2004). Therefore, the stage in slicing where the cross contamination takes place (i.e. first and last slices) could have a significant impact, especially on individual risk. Other factors such as strain persistence in the environment, disinfection practices, storage temperature and times, should also be included in a QMRA. Clearly, the pathogen type does affect Tr (%) and TrT (%). Moreover, the inoculum level on the blade influenced significantly the transfer of S. aureus, but not E. coli O157:H7. An analysis of the most suitable model for incorporating transfer data into QRMAs was not clear since both log-linear and Weibull models fitted the data describing the log-decrease of cells during slicing. However, the Weibull model showed a better fit for the first few slices where the risk of illness upon consumption is greatest. Inoculum levels used here were relatively high compared to the concentrations usually found in reality. Ideally, they should be similar if transfer coefficients are influenced by inoculum level. In this sense, future research should consider the use of microbiological analysis with lower detection limits to better imitate the real world. Besides, other factors like the type of medium used to inoculate the blade or the contaminated area should be investigated as to their effect on the transfer coefficient.
Acknowledgements
This work has been performed in the framework of the collaboration between the National Food Safety and Toxicology Center at Michigan State University and the University of Córdoba, and was partly financed by the MCYT AGL2005-119 and the Research Group AGR-170 HIBRO of the Plan Andaluz de Investigación (PAI).
References
- Anunciac¸a¨o, L. L., Linardi, W. R., do Carmo, L. S., & Bergdoll, M. S. (1995). Production of Staphylococcal enterotoxin A in cream-filled cake. International Journal of Food Microbiology, 26, 259–263.
- Beumer, R. R., & Kusumaningrum, H. (2003). Kitchen hygiene in daily life. International Biodeterioration and Biodegradation, 51(4), 299–302.
- BgVV-FAO/WHO Collaborating Centre for Research and Training in Food Hygiene and Zoonoses. (2000). WHO Surveillance Programme for Control of Foodborne Infections and Intoxications in Europe: Spain. Seventh Report 1993–1998. https://www.bfr.bund.de/internet/ 7threport/CRs/spa.pdf Accessed 20.06.2006.
- Bloomfield, S. F. (2003). Home hygiene: a risk approach. International Journal of Hygiene Environmental Health, 206, 1–8.
- Bloomfield, S. F., & Scott, E. (1997). Cross-contamination and infection in the domestic environment and the role of chemical disinfectants. Journal of Applied Microbiology, 83, 1–9.
- Chen, Y., Jackson, K. M., Chea, F. P., & Schaffner, D. W. (2001). Quantification and variability analysis of bacterial cross contamination rates incommonfoodservice tasks. Journal of Food Protection, 64, 72–80.
- Codex Alimentarius Commission (CAC). (1999). Principles and Guidelines for the Conduct of Microbial Risk Assessment CAC/GL-30. https://www.codexalimentarius.net/download/standards/357/CXG_ 030e.pdf Accessed 25.02.2006.
- Cullen, A. C., & Frey, H. C. (1999). Probabilistic techniques in exposure assessment. New York: Plenum Press, pp. 73–74.
- Dickson, J. S. (1990). Transfer of Listeria monocytogenes and Salmonella typhimurium between beef tissue surfaces. Journal of Food Protection, 53, 51–55.
- DoCarmo, L. S.,Cummings, C., Linardi, V. R., Dias, R. S.,DeSouza, J. M., De Sena, M. J., et al. (2004). A case study of a massive Staphylococcal food poisoning incident. Foodborne Pathogens and Disease, 4, 241–246.
- Dodd, C., Sanderson, M., Sargeant, J., Nagaraja, T., Oberst, R., Smith, R., et al. (2003). Prevalence of Escherichia coli O157 in cattle feeds in Midwestern feedlots. Applied of Environmental Microbiology, 69, 5243–5247.
- Eginton, P. J., Gibson, H., Holah, J., Handley, P., & Gilbert, P. (1995). Quantification of the ease of removal of bacteria from surfaces. Journal of Industrial Microbiology, 15, 305–310.
- Eginton, P. J., Holah, J., Allison, D. G., Handley, P. S., & Gilbert, P. (1998). Changes in the strength of attachment of micro-organisms to surfaces following treatment with disinfectants and cleansing agents. Letters of Applied Microbiology, 27, 101–105.
- Ferna´ndez, A., Collado, J., Cunha, L. M., Ocio, M. J., & Marti´nez, A. (2002). Empirical model builiding based on Weibull distribution to describe the joint effect of pH and temperature on the thermal resistance of Bacillus cereus in vegetable substrate. International Journal of Food Microbiology, 77, 147–153.
- Gorman, R., Bloomfield, S., & Adley, C. C. (2002). A study of crosscontamination of food-borne pathogens in the domestic kitchen in the Republic of Ireland. International Journal of Food Microbiology, 76, 143–150.
- Hernandez, G., Mangas, I., Mateo, S., de Liacer, A., Eiman, M., & Sanchez-Serrano, L. P. (1998). Foodborne disease outbreaks in Spain, 1988–1995: impact of an intervention measure. Proceedings of the 4th world congress foodborne infections and intoxications 7–12 June 1998 (Vol. 1, pp. 279–283). Berlin: Federal Institute for Health Protection of Consumers and Veterinary Medicine.
- Kusumaningrum, H. D., Riboldi, G., Hazeleger, W. C., & Beumer, R. R. (2002). Survival of foodborne pathogens on stainless steel surfaces and cross-contamination to foods. International Journal of Food Microbiology, 85, 227–236.
- Mackintosh, C. A., & Hoffman, P. N. (1984). An extended model of transfer of microorganisms via the hands: differences between organisms and the effect of alcohol disinfection. Journal of Hygiene, Cambridge, 92, 345–355.
- Mattick, K., Durham, K., Domingue, G., Jørgensen, F., Sen, M., Schaffner, D. W., et al. (2003). The survival of foodborne pathogens during domestic washing-up and subsequent transfer onto washing-up sponges, kitchen surfaces and food. International Journal of Food Microbiology, 85, 213–226.
- Midelet, G., & Carpentier, B. (2002). Transfer of microorganims, including Listeria monocytogenes, from various materials to beef. Applied and Environmental Microbiology, 68, 4015–4024.
- Montville, R., & Schaffner, D. W. (2003). Inoculum size influences bacterial cross contamination between surfaces. Applied of Environmental Microbiology, 69, 7188–7193.
- Montville, R., Chen, Y. H., & Schaffner, D. W. (2001). Glove barriers to bacterial cross contamination between hands to food. Journal of Food Protection, 64, 845–849.
- Moore, C. H., Sheldon, B. W., & Jaykus, L. A. (2003). Transfer of Salmonella and Campylobacter from stainless steel to romaine lettuce. Journal of Food Protection, 66, 2231–2236.
- Mossel, D. A. A., Corry, J. E. L., Struijk, C. B., & Baird, R. M. (2005). Essentials of the microbiology of foods. Wiley, p. 241.
- Olkin, I., Gleser, L. J., & Derman, C. (1980). Probability models and applications (pp. 276–285). New York: Macmillan Publishing Co., Inc.
- Peleg, M., & Cole, M. B. (1998). Reinterpretation of microbial survival curves. Criteria Review Food Science, 38, 353–380.
- Pe´rez-Rodri´guez, F., Fuentes, J. M., Valero, A., Carrasco, E., Garci´a- Gimeno, R. M.,&Zurera, G. (2004). Transfer of S. aureus during cooked meat slicing. In Paper presented at the COST 920, Pamplona, Spain.
- Reij, M. W., Den Aan
trekker, E. D., & ILSI Europe Risk Analysis in Microbiology Task Force. (2004). Recontamination as a source of pathogens in processed foods. International Journal of Food Microbiology, 91, 1-11. - Richard, J., & Piton, C. (1986). Semi-log model for interpreting the results of swabbing surfaces naturally contaminated. Journal of Applied Bacteriology, 60, 243–249.
- Ro¨ rvik, L. M., & Granum, P. E. (1996). Staphylococcus aureus. In: Smittsamme sjudkdommer fra mat, Granum PE (Red), Ho¨yskoleforlaget, Kristiansand S, Norge (pp. 166–175) (in Norwegian).
- Rusin, P., Maxwell, S., & Gerba, C. (2002). Comparative surface-to-hand and fingertip-to-mouth transfer efficiency of gram-positive bacteria, gram-negative bacteria, and phage. Journal of Applied Bacteriology, 93, 585–592.
- Scott, E., & Bloomfield, S. F. (1990). The survival and transfer of microbial contamination via cloths, hands, and utensils. Journal of Applied Bacteriology, 68, 271–278.
- Tilden, J. J., Young, W., McNamara, A. M., Custer, C., Boesel, B., Lambert-Fair, M. A., et al. (1996). A new route of transmission for Escherichia coli: infection from dry fermented salami. American Journal of Public Health, 86, 1142–1145.
- Veulemans, A., Jacqmain, E., & Jacqmain, D. (1970). Etude d’une me´thode simple pour la de´termination du degre´ de pollution des surfaces et la comparaison du pouvoir de´sinfectant de divers produits d’entretien. Revue des Fermentations et des Industries Alimentaires, 25, 58–65.
- Vorst, K. L., Todd, E. C., & Ryser, E. T. (2006). Transfer of Listeria monocytogenes during mechanical slicing of turkey breast, bologna, and salami. Journal of Food Protection, 69, 619–626.
- Vorst, K. L., Todd, E. C., Pe´rez-Rodri´guez, F., McMasters, R. L., & Ryser, E.T. (2004). Transfer of Listeria monocytogenes from a delicatessen slicer to ready-to-eat meat products. In Paper presented at the IAFP’s 91st annual meeting, Phoenix, AZ.
- Vose, D. (2000). Risk analysis: A quantitative guide. New York, NY: Wiley, p. 326.
- Wachtel, M. R., Mcevoy, J. L., Luo, Y., William Campbell, A. M., & Solomon, M. B. (2003). Cross-contamination of lettuce by Escherichia coli O157:H7 via contaminated ground beef. Journal of Food Protection, 66, 1176–1183.
- Zhao, P., Zhao, T., Doyle, M. P., Rubino, J. M., & Meng, J. (1998). Development of a model for evaluation of microbial cross-contamination in the kitchen. Journal of Food Protection, 61, 960–963.
![]()