Article
Related Links
Eran Linder-Ganza, Noga Shabshinb, Yacov Itzchakb, Amit Gefena,*
aDepartment of Biomedical Engineering, Faculty of Engineering, Tel Aviv University, Tel Aviv 69978, Israel
bDepartment of Diagnostic Imaging, Chaim Sheba Medical Center, Tel Hashomer 52621, Israel
Accepted 26 June 2006
Abstract
A common but potentially severe malady afflicting permanent wheelchair users is pressure sores caused by elevated soft tissue strains and stresses over a critical prolonged period of time. Presently, there is paucity of information regarding deep soft tissue strains and stresses in the buttocks of humans during sitting. Strain and stress distributions in deep muscle and fat tissues were therefore calculated in six healthy subjects during sitting, in a double-donut Open-MR system, using a ��reverse engineering�� approach. Specifically, finite element (FE) models of the undeformed buttock were built for each subject using MR images taken at the coronal plane in a non-weight-bearing sitting posture. Using a second MR image taken from each subject during weight-bearing sitting we characterized the ischial tuberosity sagging toward the sitting surface in weight-bearing, and used these data as displacement boundary conditions for the FE models. These subject-specific FE analyses showed that maximal tissue strains and stresses occur in the gluteal muscles, not in fat or at the skin near the body�seat interface. Peak principal compressive strain and stress in the gluteus muscle were 74±7% and 32±9 kPa (mean7standard deviation), respectively. Peak principal compressive strain and stress in enveloping fat tissue were 46±7% and 18±4 kPa, respectively. Models were validated by comparing measured peak interface pressures under the ischial tuberosities (17±4 kPa) with those calculated by means of FE (18±3 kPa), for each subject. This is the first study to quantify sub-dermal tissue strain and stress distributions in sitting humans, in vivo. These data are essential for understanding the aetiology of pressure sores, particularly those that were recently termed ��deep tissue injury�� at the US National Pressure Ulcer Advisory Panel (NPUAP) 2005 Consensus Conference. r 2006 Elsevier Ltd. All rights reserved.
Keywords: Pressure sore modeling; Decubitus ulcer; Rehabilitation of wheelchair users; Deep tissue injury; Mechanical properties
1. Introduction
A common but serious malady afflicting wheelchairbound and bedridden immobile patients are pressure sores, particularly at their severe form which involve sub-dermal tissue damage. Pressure sores involving subdermal tissue damage, where damage originates in muscle tissue, were recently termed ��deep tissue injury�� (DTI) by the US National Pressure Ulcer Advisory Panel, and are attracting growing attention by the medical community (Black and National Pressure Ulcer Advisory Panel, 2005). Generally, pressure sores affect about 10% of all hospitalized patients (Whittington et al., 2000) and are straining the budget of the US healthcare system by more than 1.2 billion dollars annually (Injury fact book of the Center for Disease Control and Prevention (CDC), 2001�2002). Moreover, DTI can lead to osteomyelitis, sepsis and even death (Tsokos et al., 2000; Margolis et al., 2003).
Pressure sores generally develop in two separate varieties, superficial and deep (Bouten et al., 2003a). A superficial pressure sore first affects the layers of skin near epidermal tissue and is typically associated with presence of moisture and heat combined with damaging frictional and shear forces (Crenshaw and Vistnes, 1989). Infection may follow, and poor nutrition may exacerbate the injury or delay healing (Vidal and Sarrias, 1991). However, the damage caused by superficial sores is generally reversible with adequate medical treatment, since it is contained within the top layers of a regenerative tissue. Deep pressure sores, or DTI, unfortunately stand in stark contrast to their superficial brethren both in their mechanisms and nature of damage (Bliss, 1992). This is a decidedly more serious medical complication (Bliss, 1992), which had motivated the present study. Many researchers agree that the cause for a DTI is prolonged mechanical loads that interfere with the flow of blood and clearance of metabolic byproducts in vascularized soft tissues (Kosiak, 1959; Knight et al., 2001). However, excessive local deformation of tissues, not necessarily coupled with ischemia, was also indicated to be involved in DTI aetiology (Bouten et al., 2003b; Breuls et al., 2003). The ischemia and peak deformation or mechanical stress in tissues typically occur in vicinity of bony prominences of the pelvis in the sitting position, i.e. the ischial tuberosities, the greater trochanter of the femurs and the sacrum (Kosiak, 1959; Brienza et al., 2001; Bouten et al., 2003b; Linder-Ganz and Gefen, 2004; Gefen et al., 2005). Immobilization was identified as a key risk factor for DTI as it suppresses the ability of patients to timely relieve the mechanical loads on soft vascularized tissues, particularly those in muscles under bony prominences (Allman, 1989).
The seriousness level of pressure sores is clinically classified into 4 different categories, from stage 1 which is mildest to stage 4 that is most severe, and this classification attempts to describe the extent and depth of tissue damage (Shea, 1975). In terms of the time course of injury, DTI are thought to initiate adjacent to bony prominences, and to erode the local soft tissue surrounding the bony prominence�typically muscle tissue first (Nola and Vistnes, 1980; Daniel et al., 1981; Salcido et al., 1995; Linder-Ganz and Gefen, 2004; Gefen et al., 2005). Computational simulations indicated that as this deep muscle tissue necroses, it also stiffens and subsequently, projects mechanical stresses to the more superficial tissues, which then bear the mechanical burden (Linder-Ganz and Gefen, 2004; Gefen et al., 2005). Subsequently, the more superficial layer necroses, thus creating a positive-feedback detrimental cycle, which may continue until the lesion finally breaks through the epidermal layer (Linder-Ganz and Gefen, 2004; Gefen et al., 2005). This process may initiate in less than 30 min of immobilization, and widespread DTI may develop within ~4 h of lying or wheelchair sitting (Linder-Ganz and Gefen, 2004; Gefen et al., 2005; Linder-Ganz et al., 2006). According to current clinical practice, a developing DTI may be misdiagnosed as a mild (stages 1�2) sore since the true extent of tissue damage is not visible until breakdown of the skin (Wound, Ostomy and Continence Nurses Society (WOCN), 2005;
Black et al., 2005). Hence, the frontier in biomechanical research of pressure sores focuses on understanding the aetiology of DTI (Bouten et al., 2003a). A basic, first step for such investigations is to characterize the mechanical conditions in muscle and fat tissues during supported postures such as sitting. To this end, not only that data from sitting patients on the deformations, strains and stresses in deep soft tissues are missing in the literature, but there is also paucity in information on normative mechanical conditions in muscle and fat tissues during sitting.
Some indications on the intramuscular mechanical conditions during sitting are provided by means of computer simulations and physical models. Specifically, Brosh and Arcan (2000) developed a two-dimensional (2D) finite element (FE) model of the buttock during sitting in a chair. Their model included the pelvic bone and a homogeneous surrounding soft tissue. They found that the internal principal compressive stresses in soft tissues under the ischial tuberosities exceeded the peak interface pressure between the buttock and seat. An axisymmetric 3D FE model of the buttock was developed by Ragan et al. (2002), to evaluate the efficiency of different cushions during sitting. Similarly, maximal intramuscular compressive stress of 37 kPa was found under the ischial tuberosities corresponding to peak interface pressure of 10 kPa. Oomens et al. (2003) presented a more detailed 3D axisymmetrical non-linear FE model of the buttock, which distinguished between muscle, fat and skin tissues. Again, peak compressive stress in muscles under the ischial tuberosities was 2.4- fold (~120 kPa) the interface pressure (~50 kPa). Gefen et al. (2005) recently studied muscle stresses around the sacrum using a 3D FE model of a slice through the buttock during wheelchair sitting. Consistently with all previous literature, they found that peak principal compressive stress in deep muscle tissue under the sacrum is 266-fold greater (4MPa) than the interface pressures at that site (15 kPa). The most recently published 3D FE model of the buttock during sitting was developed by Sun et al. (2005) based on (nonsitting) MRI images. They found that the maximal compressive stress is located in deep muscles under the ischial tuberosities of the pelvis (~76 kPa), corresponding to an interface pressure of ~21 kPa. They also found maximal tissue deformations to occur in muscle and fat. The physical models (phantoms) of the buttock by Reddy et al. (1982) and later by Candadai and Reddy (1992) agree very well with computational findings, that interface pressures are substantially lower than peak stresses in deep muscles. In these phantoms, internal deformations were measured in a polyvinyl chloride gel (PVC) layer under a wooden core representing the ischia. Round- and flat-base of the bone core were tested separately, but elevated deformations reflecting stress concentrations under the bones were shown in both. In addition, Le et al. (1984) measured the stress distributions in real tissue near bony prominences in vitro (in meat) and in vivo (in anesthetized pigs). Like in all other literature, they found that peak deep tissue stress is 3�5- fold higher than the interface pressure at the skin.
The literature reviewed above comprehensively characterized deep tissue strains and stresses under bony prominences in models�computational, physical or animal models. However, there is still paucity of information on deep tissue (particularly muscle and fat) strain and stress distributions in sitting humans, in ��real-world�� conditions. In fact, only one study, by Reger et al. (1990), determined deep tissue deformations in living humans as related to DTI. They used MRI to measure the thickness of muscle and fat tissues under the ischial tuberosities and greater trochanter in four normals and one paraplegic subject in a supine position. In some of their trials, artificial weights were added to body weight to test the effect of body load on tissue deformation. They found that in all loading modes, muscle tissue deformed more than fat and skin, but unfortunately, internal tissue strain and stress distributions were not studied. Accordingly, our goal in this study was to determine the strain and stress distributions in deep muscles (gluteus) and fat under the ischial tuberosities in vivo, in humans during sitting in a double donut Open-MRI. The MR images were processed offline by an FE solver in order to obtain the 3D local strain and stress tensors in muscle and fat using a ��reverse engineering�� approach, as detailed further. These data are essential for understanding the aetiology of DTI. In particular, the data can be useful for design of biomechanical models of DTI at the organ, tissue and cellular scales, as they provide, in the first time, the peaks, means and variations of local strains and stresses in the human gluteus muscle and underlying fat during sitting.
2. Methods
Strain and stress distributions in deep buttock muscle (gluteus) and its enveloping fat tissues were calculated in six normal subjects during sitting using a ��reverse engineering�� approach depicted in Fig. 1. A 3D FE model (slice) of the undeformed buttock tissues was built for each subject using an MR image taken at the coronal plane (Fig. 2a) in a non-weight-bearing sitting posture. With the aid of a second, comparable MR image taken from each subject during weight-bearing sitting, the subject-specific FE models were used to evaluate mechanical conditions in sub-dermal tissues during actual sitting, by means of non-linear FE analyses. Specifically, we used the weight-bearing MR image, taken with the same scan parameters as those used to obtain the non-weight-bearing image (as detailed below), in order to characterize displacement boundary conditions of ischial tuberosity bone sagging toward the sitting surface. Strain and stress distributions in internal tissues were then calculated, by comparing the FE solution of deformed tissues to the corresponding MR image of weight-bearing, and by fine-tuning tissue mechanical properties to obtain the best agreement between MR-observed and FE-calculated tissue deformations during sitting. The subject-specific FE models were further validated by comparing measured with calculated interface pressures under the ischial tuberosities, for each subject. This ��reverse engineering�� process is detailed below.

Fig. 1. A schematic description of our ��reverse engineering�� approach to study internal tissue strains and stresses.
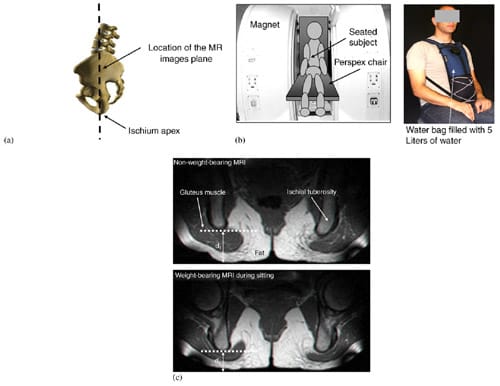
Fig. 2. MRI studies: (a) a drawing of a subject sitting in the Open-MRI space. The MR images were performed in the coronal plane (coronal to the body), and subsequently, strain and stress calculations were made. (b) Scheme of the imaging configuration (left frame) and the water bag for adding 5 kg extra weight on the trunk (right frame). Subjects sat on a chair (with a semi-rigid buttock support: 2-cm-thick foam) between the Open-MRI magnets. (c) Examples of coronal MRI images of the buttock from a healthy 29-year-old female (subject #4, Table 1) at a non-weight-bearing posture (top frame) and during weight-bearing sitting (bottom frame).
Table 1
Body characteristics of subjects
| Parameter | Subject #1 | Subject #2 | Subject #3 | Subject #4 | Subject #5 | Subject #6 |
| Gender | Male | Female | Male | Female | Male | Female |
| Body weight (kg) | 85 | 60 | 78 | 55 | 90 | 55 |
| Age (years) | 28 | 27 | 27 | 29 | 27 | 26 |
| Horizontal distance between ITs (mm) | 120 | 130 | 108 | 142 | 102 | 128 |
| Right IT radius of curvature (mm) | 12 | 7 | 11 | 13 | 14 | 14 |
| Left IT radius of curvature (mm) | 10 | 10 | 13 | 10 | 15 | 15 |
| Gluteus thickness under the right IT (mm) | 20 | 19 | 20 | 27 | 18 | 19 |
| Gluteus thickness under the left IT (mm) | 26 | 17 | 19 | 21 | 23 | 19 |
| Fat thickness under the right IT (mm) | 21 | 15 | 10 | 13 | 11 | 9 |
| Fat thickness under the left IT (mm) | 16 | 13 | 12 | 14 | 7 | 7 |
IT = ischial tuberosity.
Three male and three female healthy subjects (Table 1) were recruited for this study. Imaging was performed in an open configuration, double donut 0.5 T MR system (signa horizon, GE medical systems, Milwaukee, WI, USA) utilizing T1 weighted images (TR/TE = 440/28, field of view 240 mm, slice thickness 4 mm). The unique double donut configuration of this open MR system allowed successful imaging in the sitting position during non-weight-bearing as well as weight-bearing conditions. After obtaining informed consent, each subject was asked to sit comfortably, on the MR table: first, on a rubber tire placed on the sitting surface of the MR system (non-weight-bearing sitting) and second, directly on the sitting surface (weightbearing sitting) (Fig. 2b). Sitting on the rubber tire allowed acquisition of geometry of muscle and fat tissues under the ischial tuberosities when they are in their undeformed configuration, i.e. not distorted by the body-weight. The rubber tire was then removed for acquiring the deformed tissue configuration in weightbearing sitting on a 2-cm-thick semi-rigid flat foam (Fig. 2b). Interface pressures were also measured during weight-bearing sitting using a pressure mat (30×30 cm containing 256 flexible sensors, accuracy: ±10%, capacity per sensor: ~200mmHg, ��Tactilus��, Sensor Products Co., NJ, USA) positioned under the buttock of each subject. In addition, distributed extra weight of 5 kg was added on the trunk of subject #5 (male) and subject #6 (female), by means of a specially designed water bag (Fig. 2b), in order to study the effect of bodyweight on peak internal tissue strains and stresses in these individuals. For each MRI acquisition phase, the ischial tuberosities with their surrounding and underlying soft tissues were scanned at 4mm intervals and 2D coronal images were produced (Fig. 2c).
 (a), and an example of the fit between MRImeasured (gray areas) and FE-calculated (meshed areas) gluteal muscle contours during weight-bearing sitting (b). The right and left frames show data for the gluteus muscles at the right and left body sides, respectively.")
Fig. 3. Mesh of the three-dimensional subject-specific FE model (for subject #4, Table 1) (a), and an example of the fit between MRImeasured (gray areas) and FE-calculated (meshed areas) gluteal muscle contours during weight-bearing sitting (b). The right and left frames show data for the gluteus muscles at the right and left body sides, respectively.
Next, a 3D FE model (with thickness of 4 mm, Fig. 3a) of the non-weight-bearing buttock geometry was developed from the non-weight-bearing MRI for each subject, by segmenting tissue types in a commercial solid modeling software (SolidWorks, 2005) and importing the contour data to an FE solver (MSC MARC, 2005). The specific MRI section from which tissue contours were constructed was selected as that in which the distance measured between the ischial apex and the external boundary of the buttock was minimal (i.e. plane of minimal d1 in top frame of Fig. 2c). Each subject-specific model was meshed using hexahedron eight-nodes elements that represented muscles (skeletal and smooth), bone, fat and skin (considered together) (Table 2). Mechanical properties of these tissues were adopted from previous studies. Specifically, bone tissue was assumed to be rigid.Muscle tissue, as well as fat and skin tissues (taken together), were assumed to be incompressible, non-linear materials which undergo stress relaxation under the constant deformation caused by bone compression. In order to represent non-linear incompressible material behavior, we used a Neo- Hookean material model, with an energy function (Ogden, 2001):
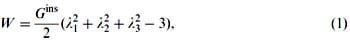
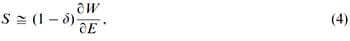
where λi are the principal stretch ratios, and Gins is the instantaneous shear modulus. For muscle tissue, Gins was taken as 8.5 kPa based on the recent measurements of Palevski et al. (2006) in fresh porcine gluteal muscles subjected to compression in the transverse direction (i.e. perpendicularly to the direction of muscle fibers). For fat and skin (together), Gins was taken as 31.9 kPa based on the indentation measurements of Brosh and Arcan (2000). Viscoelasticity was considered in the material models of muscle, as well as fat and skin (together), by means of a Prony series expansion, similarly to the approach of Bosboom et al. (2001a):
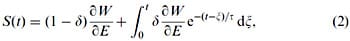
where S is the second Piola Kirchhoff stress, E is the Green Lagrange strain, τ is the relaxation time constant and δ is the percentage difference between tissue shear moduli at the instant of deformation Gins and at the asymptotic response G∞:
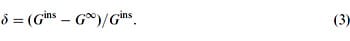
In this study, we did not account for the transient tissue response (i.e. the integral part of Eq. (2)). We analyzed only the tissue strain and stress distributions at long-terms, considering that DTI develop over time scales of minutes to hours but most stress relaxation in gluteal muscle tissue (subjected to constant deformation in the transverse direction) already occurs within ~20 s (Palevski et al., 2006). Hence, at long-terms (i.e. after more than 20 s), tissue stresses can be approximated as
Table 2
Element and node numbers (range) in the subject-specific finite element models of the buttock
| Tissue | Number of elements (8-node hexahedrons) | Number of nodes |
| Smooth muscle | 212�488 | 411�840 |
| Skeletal muscle | 1595�2894 | 2638�4698 |
| Fat and skin (taken together) | 2316�3688 | 3993�6213 |
Table 3
Sagging of the ischial tuberosities and the interface pressures at the skin under the ischial tuberosity projections during sitting
| Parameter | Subject #1 | Subject #2 | Subject #3 | Subject #4 | Subject #5 | Subject #6 |
| Sagging of right IT (mm) | 13 | 14 | 13 | 11 | 11 | 10 |
| Sagging of left IT (mm) | 15 | 16 | 13 | 12 | 13 | 11 |
| Interface pressure at right IT (kPa)�measured | 17 | 20 | 24 | 14 | 21 | 13 |
| Interface pressure at right IT (kPa)�calculated | 16 | 22 | 21 | 15 | 20 | 14 |
| Interface pressure at left IT (kPa)�measured | 18 | 22 | 21 | 16 | 18 | 13 |
| Interface pressure at left IT (kPa)�calculated | 15 | 23 | 20 | 17 | 19 | 13 |
IT = ischial tuberosity. ��measured��: mean pressure over a period of 5 min, measured using a 256-sensor pressure mat (��Tactilus��, Sensor Products Co., NJ, USA). ��calculated��: calculated from subject-specific finite element analysis.
where δ was taken as 0.5, within the range measured by Bosboom et al. (2001a, b) and Palevski et al. (2006). Last, the Cauchy stresses s were calculated from the second Piola Kirchoff stresses, using
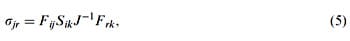
where F is the mapping tensor and J � det(F).
Vertical sagging of the ischial tuberosities toward the sitting surface in a weight-bearing posture (with respect to a non-weight-bearing posture) was digitally measured in each subject by comparing the two corresponding MR images. A sagging displacement Δ=d1-d2 (d1, d2 are defined in Fig. 2c) was obtained from the MR images separately for the left and right ischial tuberosities (Table 3). Subsequently, we used these bone sagging measurements as displacement boundary conditions for the subject-specific FE models. Additionally, external (skin) nodes that are in contact with the sitting surface were displaced according to the weight-bearing posture. We solved each FE model for these boundary conditions in the non-linear analysis mode of MARC (2005), accounting for large tissue deformations as well as the non-linear material models detailed above. Next, we compared the contours of the deformed gluteus muscles and enveloping fat, separately for each subject (or model), with the corresponding contours seen in the weight-bearing MR image using the least-square method (Fig. 3b). We evaluated the goodness of agreement between MRI and FE-predicted deformations by fitting polynomial functions (order: 4�5) separately to the superior and inferior muscle boundaries. We then calculated a correlation coefficient R2 for each pair of MRI-measured and FE-predicted muscle contours, and a corresponding two-tailed probability value p. The correlation coefficient R2 was found to be greater than 0.89 for all pairs of contours and in all subject-specific FE models, with p-values that were always lower than 0.05. After obtaining this fit, the FE solutions also provided the distributions of strains and stresses in the gluteus muscles and underlying fat for each subject. In particular, we calculated the principal compressive strain and stress distributions (Cauchy) along two central paths in the gluteus muscle (curves Mm and Nm, in Figs. 4a and 5a), and in additional two central paths in fat tissue (curves Mf and Nf, in Figs. 4a and 5a), in order to obtain characteristic values for the strain and stress distributions. For the two subjects who also carried extra weight of 5 kg (subjects #5 and #6), we compared the peak principal compressive strain and stress values with the extra weight on and off, separately for the muscle and fat tissue layers.
3. Results
Vertical sagging of the ischial tuberosities during sitting (Table 3) did not differ significantly between the left and right body sides (in a paired 2-tails t-test) and was 13±2mm (mean±standard deviation). Consistently with sagging of the ischial tuberosities, peak interface pressures under the ischial tuberosities did not differ significantly between the left and right body sides, and were 17±4 kPa. Peak interface pressures calculated from the subject-specific FE models overlapped with experimental data (18±3 kPa) and were statistically similar per subject, as evident from paired t-tests ran separately for the left and right body sides. The maximal predictive error between measured and FE-predicted interface pressure peaks was smaller than 1 kPa and the mean of absolute errors across subjects was 0.5 kPa. We conclude that our subjects sat symmetrically in the MRI and that this was reflected in their FE models.
Using the ��reverse engineering�� approach described in the Methods section (Fig. 1) we were able to calculate the distributions of strains and stresses in muscle and fat under the ischial tuberosities during sitting (Table 4). Peak principal compressive strain and stress in the gluteus were 7477% and 3279 kPa, respectively, across subjects (left and right body sides pooled, Table 4). Peak principal compressive strain and stress in the fat tissue were lower, 4677% and 1874 kPa, respectively (Table 4).
 |  |  |
| Fig. 4. Principal compressive strains in deep tissues (fat and muscle) under the ischial tuberosities of a healthy 29-year-old female (subject #4, Table 1): (a) strain distribution, (b) strain distributions along paths Mm and Nm in the right gluteus muscle, and (c) strain distributions long paths Mf and Nf in fat tissue under the right gluteus muscle. | ||
Fig. 4a demonstrates the distributions of principal compression strains in the muscle and fat tissues of subject #4, a healthy female (age: 29, weight: 55 kg). Principal compressive strains in the gluteus muscle along path Mm peaked under the ischial tuberosity and decreased medially and laterally (Fig. 4b). Strains in the gluteus muscle along path Nm peaked at the bone� muscle interface, then decreased moderately before a second peak, which appeared 5�10mm (subject-dependent) distally from the bone�muscle interface (i.e. within the superior half of muscle thickness, Fig. 4a, b). Around the muscle�fat layer interface, strains decayed again to a minimum, which occurred at the muscle�fat interface. Similarly, principal compressive strains in the fat layer along path Mf peaked under the ischial tuberosity and decreased medially and laterally (Fig. 4c). Strains along path Nf in fat tissue gradually decreased from the muscle�fat interface until reaching a minimum 1�3mm subdermally (subject-dependent). From that region to the body surface, fat tissue strains slightly increased (Fig. 4c). Generally, muscle strains were higher and less homogeneous than fat strains (Fig. 4). The strain distribution patterns shown in Fig. 4b, c were generally similar across subjects, i.e. the peak strain in gluteal muscles (Table 4) occurred under the ischial tuberosity, and a second, moderately lower peak muscle strain appeared at the superior
half of the muscle layer (Fig. 4).
| Parameter | Subject #1 | Subject #2 | Subject #3 | Subject #4 | Subject #5 | Subject #6 |
| Gluteus muscle | ||||||
| Maximal principal compressive strain (%) | 73 | 84 | 73 | 76 | 76 | 70 |
| Maximal principal tensile strain (%) | 68 | 83 | 71 | 83 | 70 | 72 |
| Maximal principal compressive stress (kPa) | 25 | 50 | 30 | 32 | 31 | 24 |
| Maximal principal tensile stress (kPa) | 15 | 28 | 23 | 17 | 14 | 14 |
| Maximal von Mises stress (kPa) | 30 | 53 | 45 | 48 | 30 | 20 |
| Maximal shear stress (kPa) | 16 | 30 | 25 | 27 | 18 | 12 |
| Enveloping fat | ||||||
| Maximal principal compressive strain (%) | 50 | 55 | 45 | 39 | 50 | 36 |
| Maximal principal tensile strain (%) | 24 | 40 | 32 | 27 | 32 | 30 |
| Maximal principal compressive stress (kPa) | 14 | 24 | 20 | 16 | 20 | 14 |
| Maximal von Mises stress (kPa) 18 14 | 14 | 25 | 18 | 14 | 18 | 14 |
| Maximal shear stress (kPa) 7 13 9 9 10 8 | 7 | 13 | 9 | 9 | 10 | 8 |
Maximal principal tensile stress for fat tissue was nearly zero under the ischial tuberosities.
 |  |  |
| Fig. 5. Principal compressive stresses in deep tissues (fat and muscle) under the ischial tuberosities of a healthy 29-year-old female (subject #4, Table 1): (a) stress distribution, (b) stress distributions along paths Mm and Nm in the right gluteus muscle, and (c) stress distributions along paths Mf and Nf in fat tissue under the right gluteus muscle. | ||
Fig. 5a demonstrates the distributions of principal compression stresses in muscle and fat tissues in the same subject (subject #4). Principal compressive stresses in the gluteus muscle along path Mm peaked under the ischial tuberosity and decreased medially and laterally (Fig. 5b). Maximal principal compression stresses in the gluteus muscle along path Nm occurred at the bone� muscle interface, where corresponding strains also peaked. Gluteal stresses rapidly decreased distally from this point, before a second peak, at about 5�10mm distally from the bone�muscle interface (subject-dependent). In the fat layer, the maximal principal compressive stress was located under the ischial tuberosity projection, and decreased medially and laterally along path Mf (Fig 5c). Stresses along path Nf in fat tissue peaked 1�3mm distally from the muscle�fat interface (subject-dependent), and decreased away from this region. Consistently with the strain distributions, stress distributions showed similar patterns across subjects, and muscle tissue stresses were higher and less homogeneous than fat stresses (Fig. 5). Interestingly, muscle tissue was subjected to considerable tension (mean of peak tension stress across subjects ~19 kPa) but fat tissue showed negligible tension stresses (less than 0.5 kPa) under the ischial tuberosity projections (Table 4).
 Fig. 6. The effect of extra 5 kg weight (added on the trunk) on principal compressive strains (a), and stresses (b) in muscle and fat tissues of two subjects (#5 and #6).”/>
Fig. 6. The effect of extra 5 kg weight (added on the trunk) on principal compressive strains (a), and stresses (b) in muscle and fat tissues of two subjects (#5 and #6).
Fig. 6 shows the effect of extra 5 kg weight on principal strain and stress peaks in muscle and fat tissues of subject #5 (male, body-weight 90 kg) and subject #6 (female, body-weight 55 kg). We found that the additional weight caused substantial increases in peak principal compression strains (in the order of 1.5-fold) and stresses (in the order of 2.5-fold) in muscle and fat tissues, of both subjects (Fig. 6).
4. Discussion
In this study we used a ��reverse engineering�� approach which coupled Open-MR imaging and FE modeling to calculate subject-specific deep muscle and fat strain and stress distributions in sitting (healthy) human subjects, in vivo (Fig. 1). We found that compression strains and stresses occurring in the superior part of gluteal muscle tissue under the ischial tuberosities during sitting are inhomogeneous and substantially exceed those in more superficial tissue layers. Specifically, compression strains in deep muscle tissue under the ischial tuberosities are large (peak ~74%), and were ~3-fold the tissue strains around the body�seat interface (~25% in fat/skin, Tables 3, 4, Fig. 4a). Intramuscular peak compression strains were also ~1.6-fold greater than corresponding peak fat strains, and intramuscular peak tensile strains were ~2.4-fold greater than corresponding peak fat strains (mean across subjects, Table 4). Intramuscular peak compressive stresses were ~1.7-fold greater than peak interface pressures under the ischial tuberosity projections, and were ~1.8-fold greater than corresponding peak fat stresses (Tables 3, 4). We also noted that peak compressive stresses in fat were similar to peak interface pressures under the ischial tuberosity projections. We conclude that maximal tissue strains and stresses occur in the gluteal muscles at the bone interface (Figs. 4, 5), not in fat or at the skin near the body�seat interface. Interestingly, subject #2 who had the sharpest ischial tuberosities (smallest radii of curvature of the bony prominences, Table 1) showed the highest tissue strains and stresses in all the parameters considered in the analysis (Table 4). It is therefore likely that sharpness of the ischial tuberosities has an important effect on internal tissue loading. Similarly, an increase of the trunk weight in two subjects (simulated by means of the water bag shown in Fig. 2b) caused substantial rise in muscle and fat strain and stress peaks. We also noted that in subject #6, for whom 5 kg extra weight are 9% additional body-weight, strains and stresses in fat tissue increased more pronouncedly with the extra weight on, compared with fat strains and stresses in subject #5, for whom 5 kg extra weight are 5.5% additional bodyweight (Fig. 6).
Interface pressure measurements in patients to predict pressure sore risk were previously claimed to be inaccurate and irrepeatable (Allen et al., 1993; Sprigle et al., 2003). Using a novel MRI-based method of quantification of sub-dermal tissue strains and stresses in sitting human subjects, in vivo, we indicate here that interface-sitting pressures are very problematic as a measure for the risk of DTI. Namely, we demonstrated, for the first time in si
tting humans, that interface pressure measurements only evaluate loading at the least-loaded tissue-skin�and the most highly loaded tissues�muscle and fat�are ignored. Hence, it is unlikely that interface pressure measurements alone can be used to prevent a DTI. For example, considering subject #2 whose interface pressures were similar to those of other subjects, but her peak muscle strains and stresses were considerably higher than the others, it is unlikely that deep tissue loading conditions can be predicted from interface pressures. Interface pressure measurements therefore appear to be insufficient for predicting the risk of an individual to develop a DTI.
In this study we focused on mechanical conditions in tissues of normal healthy subjects. It was previously published that muscle properties (mass, cross-sectional area (CSA), titanic and twitch forces, fatigue resistance) change with chronic immobilization, e.g. in spinal cord injury (SCI) patients (Castro et al., 1999a, b; Talmadge et al., 2002). For example, Diffee et al. (1991) showed a weight-loss of 45% in the soleus muscle of rats 28 days post-hindlimb suspension. A significant decrease of 32% was measured in the soleus muscle mass of 86 mice, 7 days after spinal cord transection (Landry et al., 2004). Castro et al. (1999a) took biopsies from the right vastus lateralis muscle in a group of 12 SCI patients, 11 and 24 weeks post-injury, and found 27�56% atrophy that occurred during the first 24 weeks after injury. Recently, Modlesky et al. (2004) used MRI to measure the skeletal muscle mass around the thigh among 8 SCI patients (more than 2 years post-injury) versus 8 normal healthy subjects. They found that muscle mass was lower by 44% among SCI patients. This was consistent with a previous MRI study in 14 SCI patients (6 months postinjury) and 7 healthy subjects in which skeletal muscle CSA was measured and was shown to decrease by 24% and 12% in the gastrocnemius and soleus, respectively (Castro et al., 1999b). In the long-term post injury, the decrease in CSA can be as much as 70% of the thigh muscles, as shown in women with SCI, 20 years postinjury (Giangregorio et al., 2005).
Fat layer thickness and its mechanical properties are also expected to change with chronic immobilization. Several studies evaluated obesity among SCI patients (Buchholz and Bugaresti, 2005). Buchholz et al. (2003) measured the fat-mass percentage using deuterium dilution in 32 SCI patients and 34 normals, and found that among SCI patients, the fat-mass is greater by 35% than in normals. Jeon et al. (2003) used dual energy X-ray absorptiometry (DXA) and showed that the fat percentage among 7 SCI patients was greater by 42% compared to 7 body-abled subject. Maggioni et al. (2003) also used DXA, and found that the fat-mass percentage among 13 SCI patients was greater by 50% compared with 13 body-abled subjects. Similar DXA results were obtained by Jones et al. (2003). Modlesky et al. (2004) reported an even worse condition, in which the fat-mass percentage among 8 SCI patients was more than 2-fold the fat-mass percentage of 8 normals. Taking the literature reviewed above together, geometrical and mechanical properties of the gluteus muscles and the enveloping fat layer are very likely to change among permanent wheelchair users and affect internal tissue strains and stresses. Hence, the intramuscular/fat mechanical conditions in such patients should be the topic of separate future studies.
In animal models of pressure sores that were reported in the literature, authors delivered pressures between 4 and 250 kPa to muscle tissue in order to test its tolerance to different loading regimes (Kosiak, 1961; Daniel et al., 1981; Bosboom et al., 2001b; Linder-Ganz and Gefen, 2004; Gefen et al., 2005; Linder-Ganz et al., 2006; Stekelenburg et al., 2006a, b). Based on our present findings, the design of animal models of DTI can be improved, as more realistic loading modes can be used. The design of experimental compression protocols at the cellular level can also be supported. For example, Bouten et al. (2001) applied compression strains of up to 20% to muscle cells, and Breuls et al. (2003) delivered compression strains of 30�50% to engineered skeletal muscle tissue in order to quantify cell viability in response to these loadings. Our data supports these protocols and further indicates that even greater strains (of up to ~74%: mean of peaks of gluteal muscle strain across subjects), should be considered in such studies.
In this study we did not take into account a tonus in the gluteus muscles during sitting, and only passive mechanical behavior was considered. This assumption is supported by several electromyographic (EMG) studies, which reported a nearly zero EMG activity in the gluteal muscles during quiet sitting (Soderberg and Dostal, 1978; Snijders et al., 1995). Another assumption was that the maximal strains and stresses occur in the coronal plane of the ischial tuberosities and accordingly, we developed a thin (4 mm) 3D subject-specific slice models (Fig. 3a). It is difficult to quantify the contribution of out-of-plane force components to the intramuscular loading state during sitting in our models, however, previous 3D models (Oomens et al., 2003; Sun et al., 2005) showed that the maximally loaded sites in sitting are found in tissues located under the ischial tuberosities, i.e. within our plane of interest. In closure, this is the first study to quantify
In closure, this is the first study to quantify subdermal tissue strain and stress distributions in sitting humans, in vivo. These data are essential for understanding the aetiology of pressure sores, particularly those that were recently termed ��deep tissue injury�� at the US National Pressure Ulcer Advisory Panel (NPUAP) 2005 Consensus Conference (Black et al., 2005). It will be extremely useful to extend the present study and test the effect of special mattresses and wheelchair cushions on strain and stress distributions in deep muscle and fat tissues during recumbency and sitting, and this will be one of our future research directions.
Acknowledgements
Funding was provided by the Internal Research Fund of Tel Aviv University (AG).
References
- Allen, V., Ryan, D.W., Murray, A., 1993. Repeatability of subject/bed interface pressure measurements. Journal of Biomedical Engineering 15, 329�332.
- Allman, R.M., 1989. Pressure ulcers among the elderly. New England Journal of Medicine 320, 850�853.
- Black, J.M., National Pressure Ulcer Advisory Panel, 2005. Moving toward consensus on deep tissue injury and pressure ulcer staging. Advanced Skin Wound Care 18, 415�416, 418, 420�421.
- Bliss, M.R., 1992. Acute pressure area care: Sir James Paget�s legacy. Lancet 339, 221�223.
- Bosboom, E.M.H., Hesselink, M.K.C., Oomens, C.W.J., Bouten, C.V.C., Drost, M.R., Baaijens, F.P.T., 2001a. Passive transverse mechanical properties of skeletal muscle under in vivo compression. Journal of Biomechanics 34, 1365�1368.
- Bosboom, E.M., Bouten, C.V., Oomens, C.W., van Straaten, H.W., Baaijens, F.P., Kuipers, H., 2001b. Quantification and localisation of damage in rat muscles after controlled loading; a new approach to study the aetiology of pressure sores. Medical Engineering and Physics 23, 195�200.
- Bouten, C.V., Knight, M.M., Lee, D.A., Bader, D.L., 2001. Compressive deformation and damage of muscle cell subpopulations in a model system. Annals of Biomedical Engineering 29, 153�163.
- Bouten, C.V., Oomens, C.W., Baaijens, F.P., Bader, D.L., 2003a. The etiology of pressure ulcers: skin deep or muscle bound? Archives of Physical Medicine and Rehabilitation 84, 616�619.
- Bouten, C.V.C., Breuls, R.G.M., Peeters, E.A.G., Oomens, C.W.J., Baaijens, F.P.T., 2003b. In vitro models to study compre
ssive strain-induced muscle cell damage. Biorheology 40, 383�388. - Breuls, R.G., Bouten, C.V., Oomens, C.W., Bader, D.L., Baaijens, F.P., 2003. Compression induced cell damage in engineered muscle tissue: an in vitro model to study pressure ulcer aetiology. Annals of Biomedical Engineering 31, 1357�1364.
- Brienza, D.M., Karg, P.E., Geyer, M.J., Kelsey, S., Trefler, E., 2001. The relationship between pressure ulcer incidence and buttock-seat cushion interface pressure in at-risk elderly wheelchair users. Archives of Physical Medicine and Rehabilitation 82, 529�533.
- Brosh, T., Arcan, M., 2000. Modeling the body/chair interaction�an integrative experimental-numerical approach. Clinical Biomechanics 15, 217�219.
- Buchholz, A.C., Bugaresti, J.M., 2005. A review of body mass index and waist circumference as markers of obesity and coronary heart disease risk in persons with chronic spinal cord injury. Spinal Cord 43, 513�518.
- Buchholz, A.C., McGillivray, C.F., Pencharz, P.B., 2003. Differences in resting metabolic rate between paraplegic and able-bodied subjects are explained by differences in body composition. American Journal of Clinical Nutrition 77, 371�378.
- Candadai, R.S., Reddy, N.P., 1992. Stress distribution in a physical buttock model: effect of simulated bone geometry. Journal of Biomechanics 25, 1403�1411.
- Castro, M.J., Apple Jr., D.F., Staron, R.S., Campos, G.E., Dudley, G.A., 1999a. Influence of complete spinal cord injury on skeletal muscle within 6 months of injury. Journal of Applied Physiology 86, 350�358.
- Castro, M.J., Apple Jr., D.F., Hillegass, E.A., Dudley, G.A., 1999b. Influence of complete spinal cord injury on skeletal muscle cross-sectional area within the first 6 months of injury. European Journal of Applied Physiology and Occupational Physiology 80, 373�378.
- Crenshaw, R.P., Vistnes, L.M.A., 1989. A decade of pressure sore research: 1977�1987. Journal of Rehabilitation Research and Development 26, 63�74.
- Daniel, K., Priest, D., Wheatley, D., 1981. Etiologic factors in PS: an experimental model. Archives of Physical Medicine and Rehabilitation 64, 492�498.
- Diffee, G.M., Caiozzo, V.J., Herrick, R.E., Baldwin, K.M., 1991. Contractile and biochemical properties of rat soleus and plantaris after hindlimb suspension. American Journal of Physiology 260, C528�C534.
- Gefen, A., Gefen, N., Linder-Ganz, E., Margulies, S.S., 2005. In vivo muscle stiffening under bone compression promotes deep pressure sores. ASME Journal of Biomechanical Engineering 127, 512�524.
- Giangregorio, L.M., Craven, B.C., Webber, C.E., 2005. Musculoskeletal changes in women with spinal cord injury: a twin study. Journal of Clinical Densitometry 8, 347�351.
- Injury fact book of the Center for Disease Control and Prevention (CDC), 2001�2002. The National Center for Injury Prevention and Control.
- Jeon, J.Y., Steadward, R.D., Wheeler, G.D., Bell, G., McCargar, L., Harber, V., 2003. Intact sympathetic nervous system is required for leptin effects on resting metabolic rate in people with spinal cord injury. Journal of Clinical Endocrinology and Metabolism 88, 402�407.
- Jones, L.M., Legge, M., Goulding, A., 2003. Healthy body mass index values often underestimate body fat in men with spinal cord injury. Archives of Physical Medicine and Rehabilitation 84, 1068�1071.
- Knight, S.L., Taylor, R.P., Polliack, A.A., Bader, D.L., 2001. Establishing predictive indicators for the status of loaded soft tissues. Journal of Applied Physiology 90, 2231�2237.
- Kosiak, M., 1959. Etiology and pathology of ischemic ulcers. Archives of Physical Medicine and Rehabilitation 40, 62�69.
- Kosiak, M., 1961. Etiology of decubitus ulcers. Archives of Physical Medicine and Rehabilitation 42, 19�29.
- Landry, E., Frenette, J., Guertin, P.A., 2004. Body weight, limb size, and muscular properties of early paraplegic mice. Journal of Neurotrauma 21, 1008�1016.
- Le, K.M., Madsen, B.L., Barth, P.W., Ksander, G.A., Angell, J.B., Vistnes, L.M., 1984. An in-depth look at pressure sores using monolithic silicon pressure sensors. Plastic and Reconstructive Surgery 74, 745�756.
- Linder-Ganz, E., Gefen, A., 2004. Mechanical compressioninduced PS in rat hind-limb: muscle stiffness, histology and computational methods. Journal of Applied Physiology 96, 2034�2049.
- Linder-Ganz, E., Engelberg, S., Scheinowitz, M., Gefen, A., 2006. Pressure-time cell death threshold for albino rat skeletal muscles as related to pressure sore biomechanics. Journal of Biomechanics, in press, doi:10.1006/j.jbiomech.2005.08.010.
- Maggioni, M., Bertoli, S., Margonato, V., Merati, G., Veicsteinas, A., Testolin, G., 2003. Body composition assessment in spinal cord injury subjects. Acta Diabetologica 40, S183�S186.
- Margolis, D.J., Knauss, J., Bilker, W., Baumgarten, M., 2003. Medical conditions as risk factors for pressure ulcers in an outpatient setting. Age Ageing 32, 259�264.
- Modlesky, C.M., Bickel, C.S., Slade, J.M., Meyer, R.A., Cureton, K.J., Dudley, G.A., 2004. Assessment of skeletal muscle mass in men with spinal cord injury using dual-energy X-ray absorptiometry and magnetic resonance imaging. Journal of Applied Physiology 96, 561�565.
- Nola, G.T., Vistnes, L.M., 1980. Differential response of skin and muscle in the experimental production of pressure sores. Plastic and Reconstructive Surgery 66, 728�733.
- Ogden, R.W., 2001. Elements of the theory of finite elasticity. In: Fu, Y.B., Ogden, R.W. (Eds.), Nonlinear Elasticity: Theory and Applications, London Mathematical Society Lecture Note Series, vol. 283. Cambridge University Press, Cambridge, UK (p. 20).
- Oomens, C.W.J., Bressers, O.F.J.T., Bosboom, E.M.H., Bouten, C.V.C., Bader, D.L., 2003. Can loaded interface characteristics influence strain distributions in muscle adjacent to bony prominences? Computer Methods in Biomechanics and Biomedical Engineering 3, 171�180.
- Palevski, A., Glaich, I., Portnoy, S., Linder-Ganz, E., Gefen, A., 2006. Stress relaxation of porcine gluteus muscle subjected to sudden transverse deformation as related to pressure sore modeling. Journal of Biomechanical Engineering accepted.
- Ragan, R., Kernozek, T.W., Bidar, M., Matheson, J.W., 2002. Seatinterface pressures on various thicknesses of foam wheelchair cushions: a finite modeling approach. Archives of Physical Medicine and Rehabilitation 83, 872�875.
- Reddy, N.P., Patel, H., Cochran, G.V., Brunski, J.B., 1982. Model experiments to study the stress distributions in a seated buttock. Journal of Biomechanics 15, 493�504.
- Reger, S.I., McGovern, T.F., Chi-Chung, K., 1990. Biomechanics of tissue distortion and stiffness by magnetic resonance imaging. In: Bader, D.L. (Ed.), Pressure Sores: Clinical Practice and Scientific Approach. Macmillan Press, New York, pp. 177�190.
- Salcido, R., Fisher, S.B., Donofrio, J.C., Bieschke, M., Knapp, C., Liang, R., LeGrand, E.K., Carney, J.M., 1995. An animal model and computer-controlled surface pressure delivery system for the production of pressure ulcers. Journal of Rehabilitation Research and Development 32, 149�161.
- Shea, J.D., 1975. Pressure sores: classification and management. Clinical Orthopaedics 112, 89�100.
- Snijders, C.J., Bakker, M.P., Vleeming, A., Stoeckart, R., Stam, H.J., 1995. Oblique abdominal muscle activity in standing and in sitting on hard and soft seats. Clinical Biomechanics (Bristol, Avon) 10, 73�78.
- Soderberg, G.L., Dostal, W.F., 1978. Electromyographic study of three parts of the gluteus medius muscle during functional activities. Physical Therapy 58, 691�696.
- Sprigle, S., Dunlop, W., Press, L., 2003. Reliability of bench tests of inte
rface pressure. Assistive Technology 15, 49�57. - Stekelenburg, A., Oomens, C.W., Strijkers, G.J., de Graaf, L., Bader, D.L., Nicolay, K., 2006a. A new MR-compatible loading device to study in vivo muscle damage development in rats due to compressive loading. Medical Engineering & Physics 28, 331�338.
- Stekelenburg, A., Oomens, C.W., Strijkers, G.J., Nicolay, K., Bader, D.L., 2006b. Compression-induced deep tissue injury examined with magnetic resonance imaging and histology. Journal of Applied Physiology 100, 1946�1954.
- Sun, Q., Lin, F., Al-Saeede, S., Ruberte, L., Nam, E., Hendrix, R., Makhsous, M., 2005. Finite element modeling of human buttockthigh tissue in a seated posture. 2005 Summer Bioengineering Conference, June 22�26, Vail, Colorado.
- Talmadge, R.J., Roy, R.R., Caiozzo, V.J., Edgerton, V.R., 2002. Mechanical properties of rat soleus after long-term spinal cord transection. Journal of Applied Physiology 93, 1487�1497.
- Tsokos, M., Heinemann, A., Puschel, K., 2000. Pressure sores: epidemiology, medico-legal implications and forensic argumentation concerning causality. International Journal of Legal Medicine 113, 283�287.
- Vidal, J., Sarrias, M., 1991. An analysis of the diverse factors concerned with the development of pressure sores in spinal cord injured patients. Paraplegia 29, 261�267.
- Whittington, K., Patrick, M., Roberts, J.L., 2000. A national study of pressure ulcer prevalence and incidence in acute care hospitals. Journal of Wound and Ostomy Continence Nurses 27, 209�215.
- Wound, Ostomy and Continence Nurses Society (WOCN). 2005. Response to NPUAP White Papers: deep tissue injury, stage I pressure ulcers, and stage II pressure ulcers. In: The Ninth National NPUAP Conference, February 25�26.