Ramanathan Ramnarayanan1, Ramakrishnan Rajagopalan2, Thomas E. Mallouk1 and Henry C. Foley2
1Department of Chemistry and 2Department of Chemical Engineering, The Pennsylvania State University, University Park, PA 16802
ABSTRACT
We have synthesized nanoporous carbon membranes that have monodisperse pores of 4-5 Å. These membranes have excellent size and shape selectivity that makes them an ideal candidate for use as separators in fuel cells. The selectivity of these membranes to gases such as N2, O2 and water gas [carbon monoxide and hydrogen] were measured using a permeation testing unit. These membranes were then tested as separators in fuel cells.
INTRODUCTION
We are interested in coupling reaction and separation in chemical and electrochemical systems. Advantages in doing this include shifting the equilibrium position of the reaction and increased selectivity to a given molecule, a theme broadly classified as process intensification. Carbon with pores in the range of 4-5 Å possess excellent size and shape selective properties, helping them preferentially separate gases based on their size and molecular weight. These forms of carbon are typically derived from polymers like polyfurfuryl alcohol (PFA), polyvinylidene chloride (PVDC) and Polyvinylchloride (PVC). The ease of synthesis of these materials in powder form and thin membranes on supports provides the flexibility to process these materials for different applications including catalysis and gas separation [1-4]. Reforming oxygenated hydrocarbons using air or steam generates H2, CO and CO2. In polymer electrolyte fuel cells that operate at low temperatures [50 -120 0C], CO concentrations as low as 100ppm is a significant poison and CO2 dilutes the anode stream, causing sluggish anode kinetics and power losses [5].
There are many ways of minimizing this effect. We could envision raising the temperature to about 150 0C and desorb these poisons preferentially [6,7]. Other options include looking at electrocatalyst clusters such as Pt-Ru and Pt-Mo that improve anode kinetics [5], or, selectively oxidize CO to CO2 in the presence of water [CO + H2O → CO2 + H2] using catalysts based on Cu-ZnO-Al2O3 and Pt-CeO2 [9], or use catalytic filters [6,7] that may also function as adsorbents for CO. Other options may include designing cells having compartments for regenerating electrolytes [8]. The routes described above are based on thermal and or catalytic solutions to the poison problem. We are interested in using nanoporous carbon as a selective separator for fuel cell poisons.
EXPERIMENTAL DETAILS
Synthesis of Carbon Membranes
A known concentration of polyfurfuryl alcohol (Polymer & Dajac Laboratories Inc., Feasterville, PA) was dissolved in acetone to form the polymer solution. This polymer solution was coated onto a 0.2-micron porous stainless steel disc (1.8” diameter, Chand Metallurgical, Worcester, Massachusetts) using a home-built spin coater. The porous stainless steel support was mounted on the shaft of a hand-drilling machine. 2 ml of polymer solution was applied on the rotating stainless steel discs very slowly until uniform film of the polymer was formed on the support. This process was repeated after every pyrolysis. The coated stainless steel support was then pyrolyzed under argon in a tube furnace at 600 0C for 4 hours. The sample was weighed before and after each pyrolysis and the amount of carbon deposited on the substrate was calculated. This process was repeated until a supported carbon membrane was obtained. The same procedure was followed to coat carbon from PFA on a carbon web [B-1 carbon cloth from E-Tek®].
Synthesis of Membrane Electrode Assemblies [MEA]
Membrane electrode assemblies are layers containing a proton conducting polymer membrane sandwiched between cathode and anode electrocatalysts dispersed on a gas distributor [typically carbon cloth or paper]. Nafion 117 TM from Dupont was cut into 6cm2 strips and boiled in 50% by volume H2O2, followed by DI water, followed by concentrated H2SO4 and DI water at 80 0C for 1 hour each. This chemical treatment was carried out 3 times and the membranes were stored in distilled DI water prior to use. Catalyst inks were prepared using the method developed by Wilson [10]. 100mg of commercial catalyst [Pt 30%/C, Johnson Matthey Inc.] was mixed with 0.4g DI water and 762µl of 15% Nafion solution [Aldrich] in a dram vial and stirred for 2 days. Catalyst inks were dispersed onto carbon cloth [5 cm2 geometric area, A-7 ELAT ® from E-Tek] by painting the ink contained in vials using a hair brush till a desired loading [0.5mg Pt/ cm2] was achieved. The cloth was dried at 120 °C for 1hr between each coat. To assemble the final MEA, anode and cathode carbon cloths were hot-pressed at 120 °C at 88 kg cm-2 [based on MEA geometric area] for 5 minutes in a heated Carver press, by sandwiching Nafion between the two carbon cloths, followed by cool-down to room temperature. During the hot-press step, the MEA was held between Aluminum plates and teflonized fiber glass [McMaster Carr]. The MEA was sandwiched between graphite blocks [Poco Graphite Inc., Decatur, Texas] containing interdigitated flowfields that function both as a current collector and gas distributor at 2 Newtonmetre torque. A Pressurex ® sensor [Sensor Products Inc., East Hanover, NJ] was used to check for uniform pressure throughout the MEA. The same procedure was followed for the nanoporous carbon membranes with the stainless steel plates or PFA coated carbon web replacing the carbon cloth.
Permeance Experiments
The permeance of various gases through the nanoporous carbon membranes was measured using a testing unit described elsewhere [1].
Fuel cell testing
Testing was carried out by placing the fuel cell assembly in a modified Lynntech test stand [Lynntech Industries, College Station, TX] that consisted of a gas distributor manifold, a humidifier and a loadbank. The anode and cathode gases were humidified enroute to the fuel cell by mixing the gases with a controlled flow of water [0.3mlpm] in a humidifier at 160 °C. The inlet temperatures at the anode and cathode were typically 10 °C above the cell temperature under these conditions. Fuel cell current-voltage curves were collected by controlling the current through a loadbank and data was recorded after the potential stabilized by tracking the potential and current with time for atleast 30 minutes.
RESULTS AND DISCUSSION
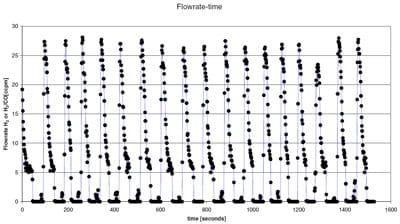
We experimented with two ways of testing the separation and reaction hypothesis. The first involved sandwiching a stainless steel supported carbon membrane between the two flanges used in the permeation experiment and placing it close to the gas cylinders. This led to very low flux of gases through the carbon coated stainless steel membrane. Figure 1 shows the results from a typical experiment. The results indicated that these membranes are insufficient in providing constant flux of gases in fuel cells, unless the separator system is redesigned.

Figure 1 Flow rate of fuel [H2 or H2/CO as a function of time with the membrane held between the gas cylinder and inlet to the flow meter.
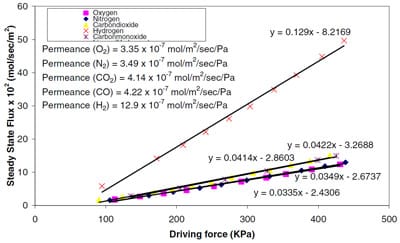
We also measured the flux of pure gases through the membranes using a permeation unit described earlier [1,4]. Figure 2 shows the results of this study. The data indicated a separation factor of 3 for H2/CO, characteristic of a Knudsen type diffusion behavior. The linear dependence of steady state flux on driving force also suggests that adsorption on these membranes are in the regime of Henry’s law. We plan to use gas mixtures in future experiments to check for selectivity of these membranes to mixtures rather than pure gases.

Figure 2 Steady state flux of carbon membranes to different gases a) H2 b) CO and CO2 c) O2 and N2
We then sought to use the carbon coated membranes as the gas diffuser and separator, by reducing the diffusion distance between the source of the fuel and the fuel cell. We cut the carbon coated stainless steel disks used in permeation experiments to 5 cm2 strips, and used the same as the anode gas distributor. This led to poor electrical contact with the graphite plates and no current. We then tested PFA coated carbon web as the anode carbon cloth. As a comparison, Pt/C MEAs were also tested in the fuel cell assembly. Figures 3 and 4 show the current-voltage data obtained as a function of fuel and oxidizer flow rates for the different MEAs. Current voltage curves were collected at a pressure of 33psig across the cell for the PFA carbon MEA and at 20psig across the standard Pt/C. This was essential to increase the flux through the PFA carbon MEA.
The figures indicate a lack of the separation effect based on current-voltage on Pt-based MEAs, to nanoporous carbon [having Knudsen selectivity] as the backing layer. We plan to analyze the anode exhaust to check to see the effect of using a carbon layer with small pores and to correlate the same to permeation tests involving mixtures of gases.
![Figure 3 Current- Voltage curves for Pt on Carbon MEAs tested in fuel cells as a function of different flow rates of H2 and H2/CO [in slpm] figure 3](https://www.sensorprod.com/wp-content/uploads/2023/09/figure-3-26.jpg)
Figure 3 Current- Voltage curves for Pt on Carbon MEAs tested in fuel cells as a function of different flow rates of H2 and H2/CO [in slpm]
![Figure 4 Current- Voltage curves for Pt on PFA-Carbon MEAs tested in fuel cells as a function of different flow rates of H2 and H2/CO [in slpm] figure 4](https://www.sensorprod.com/wp-content/uploads/2023/09/figure-4-57.jpg)
Figure 4 Current- Voltage curves for Pt on PFA-Carbon MEAs tested in fuel cells as a function of different flow rates of H2 and H2/CO [in slpm]
CONCLUSIONS
Carbon membranes with pores of 4-5 Å were tested in working fuel cells for separation of small amounts of CO [100ppm] in H2. These were compared to traditional Pt/C membrane-electrode assemblies. Current-voltage results indicate a lack of any advantage for using carbon membranes having Knudsen selectivity in Pt based MEAs. We are currently synthesizing membranes with higher selectivity to check for tolerance of these assemblies to low amounts of CO and check the anode and cathode exhausts for CO/H2 ratio at the exit.
REFERENCES
- M.S. Strano and H.C. Foley , AIChe Journal, 47, 66 (2001).
- M.B. Shiflett and H.C. Foley , J.Membr. Sci., 179, 275 (2000).
- M.B. Shiflett M.B and H.C. Foley , Carbon, 39, 1421 (2001).
- R.Rajagopalan and H. C. Foley, Mat. Res. Soc. Symp. Proc., 752, 225 (2003)
- S. J. Lee, S. Mukherjee, E. A. Ticanelli and J. McBreen, Electrochimica Acta, 44, 3283 (1999) and references therein.
- L. Balasubramanian, W. Huang and Weidner J. W., Electrochemical and Solid-State Letters, 5(12), A267 (2002) and references therein.
- Adcock, P. A., Brosha E. L., Garzon F. H., Uribe F. A., Mat. Res. Soc. Symp. Proc., 756, 365 (2003).
- Simons E. L., Cairns E. J., Materials Protection, 6(9), 51 (1967).
- Handbook of heterogeneous catalysis, Vol 4, p1801-1900, ed. by G Ertl, H Knözinger, and J Weitkamp (VCH, Weinheim, 1997)
- Wilson M. S., Gottesfeld S., J. E. Soc., 139(2), L28 (1992).


