

Article
Related Links
J. M. Desantes, R. Payri, F. J. Salvador, J. Gimeno. – CMT-Motores Térmicos. Universidad Politécnica de Valencia, Spain
ABSTRACT
In Diesel injection Systems, cavitation often appears in the injection nozzle holes. This paper analyses how cavitation affects the Diesel spray behavior. For this purpose two spray parameters, mass flux and momentum flux, have been measured at different pressure. We know that cavitation brings about the mass flux choke, but there are few studies about how the cavitation affects the momentum and the outlet velocity. The key of this study is just the measurement of the spray momentum under cavitation conditions.
INTRODUCTION
A very important factor in direct injection diesel engines is the quality of the diesel spray. An improvement in the air fuel mixing leads to better combustion process that results in higher performance and less pollutant emissions [1]. The spray characteristics are strongly influenced by the nature of the flow inside the injection nozzle hole [2]. This internal flow is largely dependent on the presence of the cavitation phenomenon [3, 4]. The objective of this study is to determine the influence of the internal flow behavior on the mass flux, spray momentum and outlet velocity.
Two experimental installations have been used: the first one being a high pressure nitrogen spray momentum test rig where the spray force, or momentum flux, can be measured for each hole, the second one being an injection rate meter which allows the mass flux to be measured.
The momentum flux is a very important parameter, in spite of this there are very few study that uses this measure [5, 6]. Important factors like spray penetration, spray cone angle and air entrainment depend largely on spray momentum [7]. With the simultaneous determination of the momentum and mass flux it is possible to determine the velocity in the outlet section of the nozzle hole.
This paper will be divided into several sections, in the first part a short review of the theoretical problem is presented and in the second part the experimental devices are described. Special attention is given to the spray momentum test rig which was especially built for this research. Finally in the results section, the analysis of the flow for different operating points is presented.
THEORETICAL BACKGROUND
The phase transition from liquid to vapor of a fluid due to low pressure is called cavitation. Cavitation in diesel nozzle appears because of very low pressure at the inlet of the nozzle hole. These low local pressures are due to boundary layer separation near the nozzle inlet hole. In this region, due to the strong change in cross-section and flow direction, the boundary layer tends to separate from the hole wall forming what is known as a “vena contracta”. As a consequence, a recirculation zone appears between the “vena contracta” and the hole wall. In this zone there is a pressure depression due to the acceleration of the fluid. If static pressure falls below vapor pressure then the phenomenon of cavitation will appear [8]. A simplified sketch of this situation can be seen in figure 1.
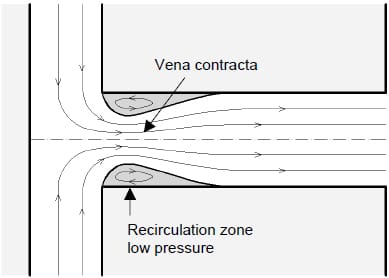
Figure 1. Fluid separation in a nozzle hole.
To study this phenomenon we are going to define several non-dimensional parameters. Because the measured pressures are the injection pressure Pi and the discharge back pressure Pb, these two values will be used to do the calculus and analysis. The pressure drop (ΔP) will be calculated by subtracting Pb from Pi. This statement implies that the loss coefficients used throughout this paper will be representative of all loss between the rail and the discharge chamber. The validity of the results is good since most of the loss is located in the nozzle hole [8].
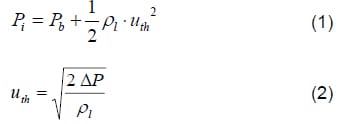
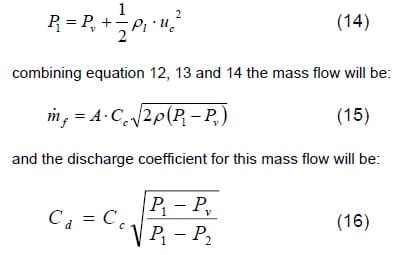
Using Bernoulli’s equation (eq 1) between the inlet and the outlet of the nozzle hole and assuming that the inlet velocity is negligible, it is possible to obtain the theoretical velocity at the outlet section (eq 2).
With the outlet theoretical velocity, the theoretical mass flow is obtained by assuming a constant cross-section and density. The first non-dimensional parameter, discharge coefficient Cd, is obtained by dividing the real mass flow by the theoretical mass flow (eq 3).
With the use of a theoretical momentum flux a new non-dimensional parameter, CM, or “momentum coefficient” is defined (eq 4).
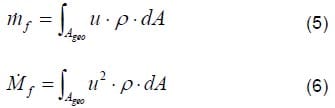
Equation (5) and (6) are the integral form of the mass flow and momentum flux at the outlet section of the hole.
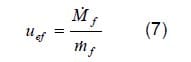
If a turbulent flow without cavitation is considered then the outlet velocity profile could be assume to be uniform along all the outlet area of the hole. This situation is depicted in figure 2a. With this assumption it is possible to estimate the effective outlet velocity by dividing the momentum flux by the mass flow (eq 7). This assumption will be valid for a cavitating flow if we assume the velocity profile depicted in figure 2b. The vapor section is neglected from the integral equation because of the small density in this region. We can now assume that the liquid has the same velocity over the entire liquid section. With these two simplifications it is possible to obtain the effective velocity using expression (eq 7).

Figure 2. Outlet velocity profiles
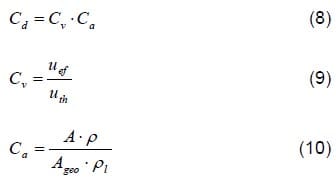
In order to study the discharge coefficient in more detail, the loss included in this coefficient could be divided in two parts (eq 8): the velocity coefficient, Cv, takes into account the loss in the velocity term and the area coefficient, Ca, that incorporates the loss of area due to the flow contraction, the changes in density and the non-uniform velocity profiles at the outlet section of the hole. The velocity coefficient is defined, Cv, as the relationship between eff
ective velocity and theoretical velocity (eq 9). The area flow coefficient is defined as the real section of the flow multiplied by the real density divided by the geometrical section multiplied by the liquid density (eq 10). This area coefficient has two possible meanings; the first one is that the area is equal to the geometrical section, and that with the generation of vapor the density is smaller. The second interpretation is that the vapor density is neglected with respect to the liquid one and that the area coefficient is taking into account the section which the liquid is occupying from the outlet section. In any case the Ca will be calculated from equation 8. These coefficients are similar to the ones defined by Siebers [6].
The relationship between the momentum coefficient and the discharge coefficient is given by equation 11, and was found by combining equations 3,4,7 and 9.
The one-dimensional model
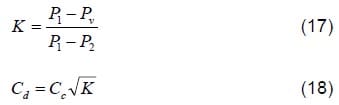
The theoretical model to predict nozzle flow under cavitation was proposed by Nurick in 1976 [9]. All the analyses are based on figure 3. In this figure point 1 corresponds with the upstream point where velocity could be neglected. The outlet point (2) corresponds to the outlet section of the hole. To simplify the analysis a fixed region occupied by the vapor phase such as depicted in figure 3 will be assumed. The cross-section where the vapor is present is reduced as can be seen in figure 3. The area contraction in this section is called contraction coefficient Cc. This coefficient depends on the geometry, and for sharp-edge holes its value is 0.61 [10]. Because of this, the area in the contraction section, could be obtained as is presented in equation 12.
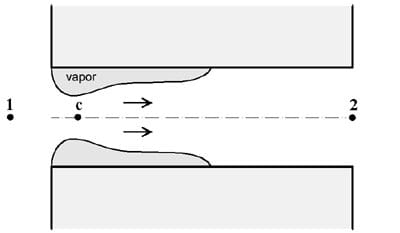
Figure 3. Sketch for Nurick cavitation model
If we make the assumption that there is no radial velocity and that the liquid density is constant, then the mass flow across the hole will be:
Applying Bernoulli’s equation between point 1 and c without loss to this distance, and assuming vapor pressure for section c, since there is vapor and liquid, the pressure in this point could be taken as vapor pressure, Pv.
Now following Nurick´s work, the cavitation number will be defined as K, the value inside the square root in equation 16. This non-dimensional parameter increases when the inlet pressure is decreased or when the outlet pressure is increased. For lower K values there will be important cavitation effects.
When Increasing K there is a moment where cavitation disappears. The value at which cavitation disappears is know as Kcrit. For K values higher than the critical cavitation number, the flow will only be liquid phase depending mainly on the Reynolds number [11]. This phenomenon can be observed in figure 4.
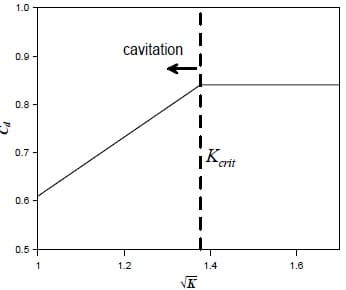
Figure 4. Nurick model
This one-dimensional model, implies that there is a mass flow collapse, like compressible flow in sonic conditions, this means that the flow will be independent of downstream conditions. This behavior has been observed in several experimental studies. [3, 4, 12, 13].
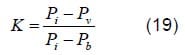
In this paper all plots of the coefficients will be represented versus the cavitation number K, defined as in equation 19. This non-dimensional parameter is obtained with the inlet and outlet pressure. In the present paper, injection and discharge pressure will be used. The lower the value of K, the closer to the cavitation regime.
In order to obtain all the equations of this section, it has been used some assumptions and simplistic illustrations. The flow structure of a real nozzle hole is more complex than these sketches (see [14, 15, 16]), although this does not affect to the potential usefulness of the results.
EXPERIMENTAL EQUIPMENT
To make this study two experimental test rigs have been used, the first one is a new CMT developed rig, while the second one is a standard injection rate meter. In this section a brief description of both experimental systems will be given.
Injection Test Bench
The injection system used was a conventional Common Rail Fuel Injection system [17, 18], which allows fuel injection under high (up to 1500 bar) and relatively constant pressure. The same system has been used for both experimental installations so that the measurements could be compared. The nozzle used in this study has been a VCO cylindrical two-hole nozzle with an outlet diameter of 144 µm.
With the aim of obtaining stabilized conditions without the influence of needle lift a very long energizing time has been used, the value was fixed at five milliseconds.
Spray Momentum test Rig
With this experimental equipment it is possible to determine the impact force of the spray, that is equivalent to the momentum flux that each spray of the nozzle has. In figure 5 there is a sketch of the momentum test rig. The chamber could be pressurized with nitrogen up to 100 bar to simulate discharge conditions in the engine.
The force is measured with a piezo-electric pressure sensor calibrated to measure the force. The sensor is placed at 5 mm from the hole exit. The sensor frontal area is high enough to catch all of the spray’s frontal area. Due to the conservation of momentum we can assume that the force measured by the sensor will be the same as the momentum flux at the hole outlet, since the pressure inside the chamber is constant and surrounds the entire spray. Taking this into account we can say that the density of the chamber fluid does not affect the measurement, so that any chamber pressure could be used without disturbing the results. In figure 6 there is a sketch of the spray and sensor used in the momentum test rig.
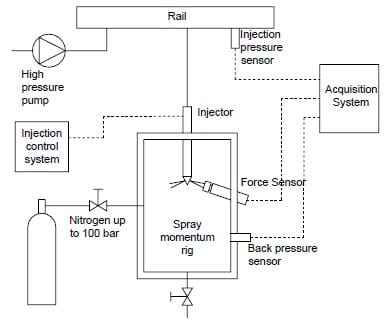
Figure 5. Spray momentum rig
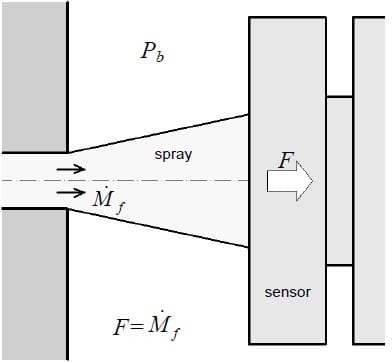
Figure 6. Spray momentum measurement system diagram
Injection Rate Meter
This experimental set-up allows to instantaneously measure the mass flow given by a fuel injection system. A commercially available device was used.[19]
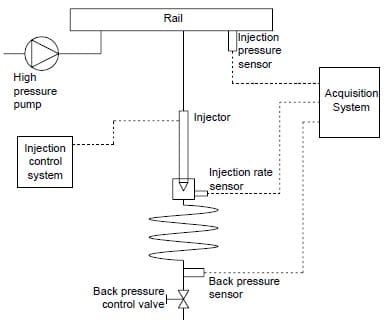
Figure 7. Injection rate meter
Operating points
The nozzle considered has been tested at different injection and discharge pressures. The injection pressure was set at: 300, 500, 800, 11
00 and 1300 bar, and the discharge pressures at: 20, 40, 60 and 80 bar, all the combinations were measured.
EXPERIMENTAL RESULTS
For the analysis of the results presented in this study only the mean values while the needle is fully open are presented. Before performing the analysis of the mean values the instantaneous measurements for a single injection and discharge pressure are presented. In figure 8 the instantaneous momentum flux can be seen, and figure 9 displays the instantaneous mass flux. These graphics belong to the point 500-60 bar of injection pressure and discharge pressure.
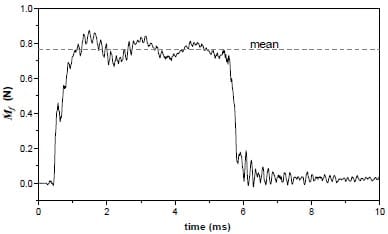
Figure 8. Instantaneous momentum flux.
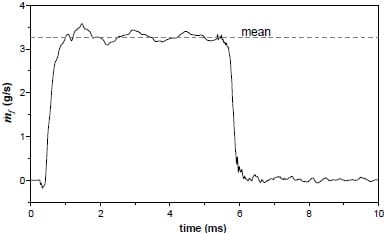
Figure 9. Instantaneous mass flux.
Mean Mass flow values
In figure 10 the mass flow for one hole is depicted. This value was obtained by the maximum mass flow in stabilized conditions and dividing this value by the number of holes (two holes for the present nozzle). In non cavitating conditions the mass flow is proportional to the square root of the pressure drop. Once cavitation appears the mass flow has a collapse and is no longer a function of the pressure drop over the nozzle. At this point the mass flow does not increase further when the discharge pressure is reduced and injection pressure is kept constant.[3, 4, 12, 13].
In figure 10 each group of points corresponds to a characteristic injection pressure. For all the injection pressures the mass flow is choked, except for the points taken at 300 bar.
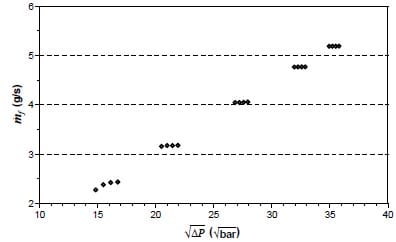
Figure 10. Mass flux of one hole
By plotting the mass flux against the square root of injection pressure minus vapor pressure (figure 11), it is clear which points have cavitation according to Nurick´s theory (eq 15) and which points do not.
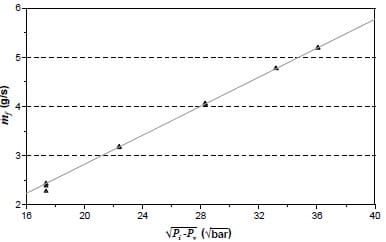
Figure 11. Mass flux versus the injection pressure
Figure 12 displays the discharge coefficient obtained with stabilized mass flow. The discharge coefficient Cd decreases when the cavitation number decreases, (i.e. increase of the cavitation). Each injection pressure follows Nurick´s model but each has a characteristic Cc. The contraction coefficient equals the minimum value of the discharge coefficient when K=1.
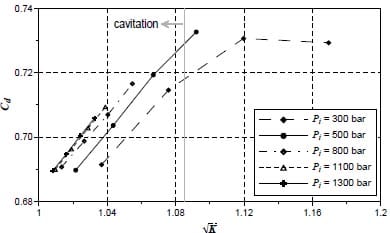
Figure 12. Discharge coefficient
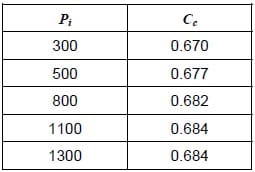
Table 1. Cc for each injection pressure
Observing figure 12 and the previous measurements it could be stated that in only 3 of all the operating points there will be no cavitation: 300-80, 300-60, 500-80.
Spray Momentum results
In figure 13 the momentum flux for a single hole is depicted. This value has been obtained by taking the mean value of the results from both holes of the nozzle used in the experiments. The initial and final period of the experimental signal was not used and only the mean values at maximum needle lift were considered. The first interesting result is that contrary to the behavior of the mass flow the momentum flux does not have any collapse, it is proportional to the pressure drop for any injection and discharge pressure not depending on the cavitation of the holes. It is not possible to state whether with or without cavitation the slope of the curve is the same, because as we know from the mass flow results, only 3 points do not have cavitation.
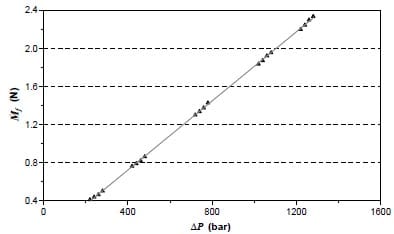
Figure 13. Spray momentum of one hole
The fact that the spray momentum is proportional to the pressure drop implies that the momentum loss inside the nozzle hole is proportional to the pressure drop independently of the cavitation level. In order to explain this, two effects must be considered: The mass flow collapse will imply that the momentum flux will be smaller, (the momentum flux is approximately equal to mass flow multiplied by velocity as can be seen in equation 7) on the other hand, as is proposed by Schmidt [20], it is possible to assume that the appearance of cavitation will make the wall shear in the nozzle hole smaller due to the fact that the vapor phase will be between the liquid phase and the hole wall. So the influence of the mass flow collapse will be compensated by smaller loss due to the wall shear. What is clear is that when cavitation is increased there is an increase in velocity to compensate the mass flow collapse.
In figure 14 the momentum coefficient, CM, is depicted versus the cavitation number K. As can be seen CM is not changing much, since the difference between the maximum and minimum values is only 3% . In any case there is a region around the Kcrit value with a minimum zone. When K is increased the momentum coefficient is increasing but since only 3 points are in this region it is difficult to confirm this phenomenon.
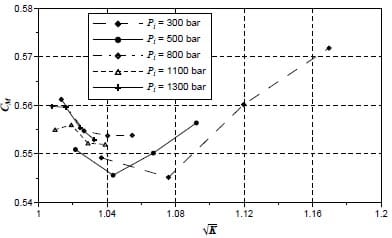
Figure 14. Momentum coefficient
Outlet Velocity
As has been seen in the first part of this paper, it is possible to estimate the outlet velocity by dividing the momentum flux with the mass flux (eq 7). This velocity is only the axial component of real velocity, although we can neglect the other components. In figure 15 the effective velocity is depicted after performing this operation. The first important observation is that there is no collapse in the values as was observed for the mass flow values, this implies that it is not correct to estimate the velocity using mass flow as was done with the bulk mean velocity (equation 20). This assumption is known as slug flow and has been used extensively in literature [21-25].
Theoretically when there is no cavitation the velocity should be linear with square root of pressure drop, this behavior is represented in figure 15 by a straight line. This line has been obtained by doing a fit with the points of no cavitation as it was known that only the liquid phase was present. As can be seen there is an increase in outlet velocity when cavitation appears compared to the situation without cavitation. Chaves [4] wrote about the possibility that the velocity will increase once cavitation is present due to the fact that the outlet section will be smaller because of the vapor formation.
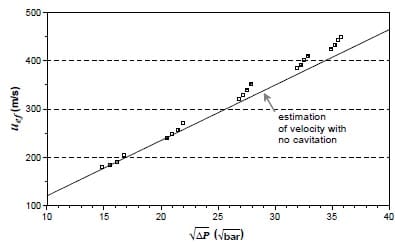
Figure 15. Outlet velocity
When the velocity coefficient is depicted this theory is confirmed. In figure 16 the smaller the value of K, the higher the cavitation intensity and the higher the velocity coefficient, Cv. Closer to the maximum Bernoulli velocity value.
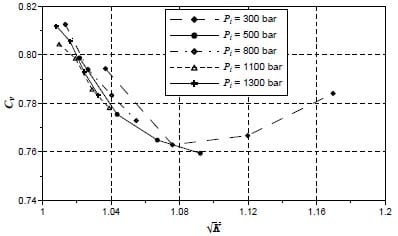
Figure 16. Velocity coefficient
Area Coefficient
With the discharge and velocity coefficient it is possible to obtain the a
rea coefficient, Ca. This parameter is an indicator of the reduction of cross section and/or density in the outlet section of the hole. In figure 17 a representation of this coefficient is plotted. As could be expected the cavitation phenomenon gives an important reduction of the area coefficient (mainly because of the appearance of vapor in the outlet section). The points without cavitation theoretically should have Ca=1, due to the fact that the liquid phase occupies all of the outlet section. Not reproducing this phenomenon is due to the assumption made in the calculus of the velocity. The velocity profile is constant in the entire outlet section of the hole. This assumption is clearly not true as can be seen from figure 17. Notice should be made of how far the area coefficient is from the maximum value 1 for the points without cavitation.
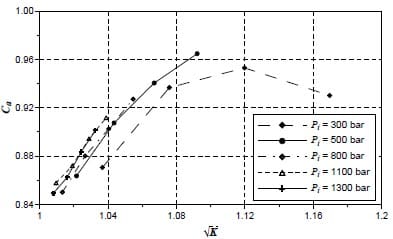
Figure 17. Area coefficient
Summary of the obtained results
In figure 18 it is possible to observe all the coefficients plotted in the same graph versus the cavitation number, K. In the graph it is possible to observe how the different parameters affect each other. Important ideas obtained from this graph are: constant value for momentum coefficient for any type of flow, for no cavitation the discharge and velocity coefficient are close to each other.
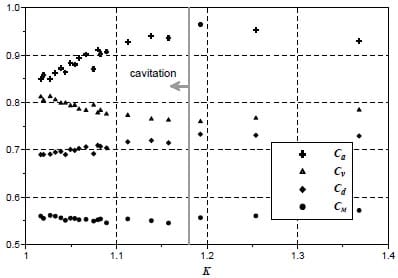
Figure 18. Coefficients
CONCLUSION
A new experimental set-up to measure the momentum flux of a Diesel spray under realistic engine conditions has been constructed. This test rig has been used to characterize the cavitation phenomenon for a real VCO Diesel nozzle.
Different injection and discharge pressures have been used. In these conditions the momentum flux and the mass flow have been characterized. With these two measurements the outlet velocity was calculated.
Several non-dimensional parameters have been used, to study the influence of the cavitation over the outlet flow of the nozzle.
The main results obtained are the following:
- In the mass flow there is a collapse when cavitation occurs. Once the mass flow collapse appears for a given injection pressure the mass flow becomes independent from the discharge pressure. This result implies that the discharge coefficient, Cd, will decrease when the cavitation number K decreases. The mass flow follows the one dimensional theory presented by Nurick [9].
- The momentum flux, on the contrary, compared to the mass flow does not have any collapse. The increase of momentum flux is proportional to the pressure drop. From this result it is deduced that the decrease of momentum produced by the smaller mass flow is compensated by smaller wall shear due to the existence of vapor films along the hole walls. A consequence of this linearity is that the momentum coefficient, CM, is basically independent of the cavitation number.
- The outlet velocity increases when cavitation appears. This phenomenon could be explained by the reduction in the cross section of the liquid phase in the outlet section of the hole. The velocity coefficient, Cv, increases with the decrease of K.
- The last parameter, the area coefficient, Ca, has a pronounced decrease once cavitation appears. This will imply that the increase of the cavitation will increase the vapor phase in the outlet section of the nozzle hole.
NOMENCLATURE
Pi – Injection pressure.
Pb – Discharge back pressure.
PΔ – Drop pressure.
Pv – Vapor pressure.
mf – Mass flux.
Mf – Momentum flux or spray force.
ρl – Liquid density.
ρ – Real density.
Ageo – Geometrical outlet area.
A – Real contracted area.
uth – Theoretical outlet velocity.
u – Real velocity.
uef – Effective outlet velocity.
Π – Bulk mean velocity.
Cd – Discharge coefficient.
Cm – Momentum coefficient.
Cv – Velocity coefficient.
Ca – Area coefficient.
Cc – Nurick contraction coefficient.
Ac – Nurick contraction area.
uc – Nurick velocity in contraction area.
K – Cavitation number.
REFERENCES
- Pierpont, D.A.; Reitz, R.D, “Effects on injection pressure and nozzle geometry on D.I. Diesel emissions and performance”, SAE paper 950604, 1995.
- Su, T.F., Farell, P.V., Nagarajan, R.T., “Nozzle effects on High Pressure Diesel Injection”, SAE Paper 950083, 1995.
- Soteriou, C., Smith, M., Andrews, R., “Direct Injection Diesel Sprays and the Effects of Cavitation and Hydraulic Flip on Atomization”, SAE Paper No. 950080, 1995.
- Chaves, H., Knapp, M., Kubitzek, A, “Experimental study of cavitation in the nozzle hole of diesel injectors using transparent nozzles”. SAE Paper 950290, 1995.
- Kampmann, S., Dittus, B., Mattes, P., Kirner, M., “The influence of Hydro Grinding at VCO Nozzles on the Mixture Preparation in a DI Diesel Engine”, SAE Paper 960867.
- Siebers, D., “Scaling Liquid-Phase Penetration in Diesel Sprays Based on Mixing-Limited Vaporization”, SAE Paper 1999-01-0528.
- Rajaratnam, N., “Turbulent jets”, Elsevier Scientific Company, 1974.
- Bergwerk, W., “Flow Pattern in Diesel Nozzle Spray Holes”, Proceedings of the Institute of Mechanical Engineers, vol. 173, 1959
- Nurick, W. H., “Orifice cavitation and its effect on spray mixing”, Journal of fluids engineering, vol. 98, pp. 681-687, 1976
- Von Mises, R., “Berechnung von Ausfluss und Überfallzahlen.”, Z.Ver. deutscher Ing., 61, 1917.
- Lichtarowicz, A.K., Duggins, R.K., Markland, E., “Discharge coefficients for incompressible non-cavitating flow through long orifices”, J. Mech, Engng Sci., 7 (2), 1965.
- Randall, L.N., “Rocket applications of the cavitating venturi.”, ARS J., January-February pp.28-31, 1952.
- Payri, R., Margot, X., Salvador, F.S., “A Numerical Study of the Influence of Diesel Nozzle Geometry on the Inner Cavitating Flow.” SAE Paper 2002-02P-210.
- Arcoumanis, C., Flora, H., Gavaises, M., “Cavitation in Real Size Multi-Hole Diesel Injector Nozzles”, SAE Paper 2000-01-1249.
- Arcoumanis, C., et al, “Nozzle Flow and Spray Characteristics from VCO Diesel Injector Nozzles”, Thiesel 2002.
- Soteriou et al, “Through the Diesel Nozzle Hole – a Journey of Discovery II “, ILASS Europe 2001.
- Stumpp, G., Ricco, M., “Common Rail – An attractive fuel injection system for passenger car DI diesel engines”, SAE paper 960870, 1996.
- Flaig, U., Polach, W., Ziegler, G., “Common Rail System (CR-System) for passenger car DI diesel engines; Experiences with applications for series production projects”, SAE paper 1999-01-0191, 1991.
- Bosch, W., “The fuel rate indicator: a new instrument for display of the characteristic of individual injection”, SAE paper 660749, 1966.
- Schmidt, D.P., Corradini, M.L., “Analytical prediction of the exit flow of cavitating orifices.” Atomization and Sprays, Vol. 7, No. 6, pp. 603-616, 1997.
- Arai, M., Shimizu, M., Hiroyasu, H., “Similarity between the breakup lengths of a high speed liquid jet in atmospheric and pressurized conditions”. ICLASS-91, Gaithersburg, Maryland, 1991.
- Hiroyasu, H., Arai, M., Shimizu, M., “Break-up length of a liquid jet and internal flow in a nozzle”, ICLASS-91, Gaithersburg, Marylad, July, 1991.
- Ruiz, F., “A few useful relations for cavitating orifices”, ICLASS-91, Maryland, July, 1991.
- Ryan III, T.W., “Measurement of the instantaneous distribution of momentum in diesel injection nozzle fuel jets”. SAE paper 962004, 1996.
- Kayhan, H.G., Corradini, M.L., “Insolated effects of ambient pressure, nozzle cavitation and hole Inlet geometry on diesel injection spray characteristics”, SAE paper 2000-01-2043, 2000.
![]()