

Article
Related Links
Mahesh Murthy,a,* Manuel Esayian,a,* Alex Hobson,a Steve MacKenzie,a Woo-kum Lee,b,* and J. W. Van Zeeb,*,z
aW. L. Gore & Associates, Incorporated, Elkton, Maryland, 21922-1488, USA bDepartment of Chemical Engineering, University of South Carolina, Columbia, South Carolina 29208, USA
The response of Gore’s advanced PRIMEA® Series 5561 membrane electrode assembly ~MEA! exposed to transient concentrations of CO in the anode feed was studied for a 25 cm2 laboratory-scale polymer electrolyte membrane fuel cell ~PEMFC!. The data include relatively high ~500 and 3000 ppm! CO levels at 70°C cell temperature, low reactant stoichiometry, and atmospheric pressure, conditions that may be typical for stationary PEMFC applications. Poisoning and recovery rates are reported for saturated conditions and these rates are compared for two types of gas diffusion media [single-sided ELAT® and CARBELTM CL gas diffusion media (GDM)] and for conditions with and without air-bleed treatments. It is shown that a 5% air bleed provides a current density of 1.0 A/cm2 at 0.6 V for CARBEL CL GDM exposed to 500 ppm CO/H2 mixtures. The data show that the transient performance at 0.6 A/cm2 with this MEA and relatively high concentrations of CO is a result of an interaction of CO kinetics and mass transfer through the GDM. Indirect evidence of electrochemical oxidation of CO during the transient pulses with 3000 ppm CO is presented. The data discussed in this paper are suitable for verifying numerical models of a PEMFC and establishing a baseline for new recovery schemes using new MEAs with enhanced CO tolerance. In addition, the results have implications for the design of reformate fuel processing systems and the use of effective control schemes to prevent CO transients. © 2001 The Electrochemical Society. [DOI: 10.1149/1.1402119# All rights reserved.
The short-term use of polymer electrolyte membrane (PEM) fuel cells in electric vehicles probably will require the use of reformed fuel produced from gasoline or methanol, because liquid fuels have high energy densities and a hydrogen infrastructure does not yet exist. Also for distributed power sources and for residential applications, hydrogen will most likely be derived from natural gas, since an infrastructure for the distribution and consumption of natural gas already exists. The fuel processing unit for both applications typically incorporates a reformer followed by a shift reactor and a selective oxidizer to reduce the level of CO from approximately 1 to 2.5% (10,000 to 25,000 ppm) to less than 50 ppm. Depending on the dynamics of the processor and the control scheme, transient spikes of CO as large as 3000 ppm may be superimposed on steady-state trace amounts of carbon monoxide (in the range of 5 to 50 ppm) in the fuel. The presence of these high CO levels can also be expected during cell start-up or during sudden load changes. While it is relatively well known that these spike levels of CO can poison even the most advanced present-day catalysts, data for the recovery of these catalysts from these transients are limited.1 Here, we present a study showing the interactions of the gas diffusion layer, the CO concentration, and an air-bleed treatment on the recovery and poisoning rates for advanced membrane electrode assemblies (MEAs). The aim is to provide reproducible data suitable for verification of numerical models of transient behavior as well as expand the base of available steady-state and transient data useful to designers of control schemes and processing systems.
Recently, the decay and recovery of fuel cell performance in response to step changes in the level of CO in the anode fuel stream has been studied1 for a 50 cm2 MEA with an anode catalyst loading of 0.2 mg/cm2 of Pt for a single commercial gas diffusion media (GDM). The concentration of CO was limited to 200 ppm (with the exception of one figure for 500 ppm) and the cell was operated at 80°C. Note that the operating pressure was not reported in Ref. 1, but a review of the investigators’ historical results indicates that 30 psig is typically the standard pressure for their experiments. In their paper, the observed current density at constant voltage (0.6 V) was related to the rate of surface dosing and determined primarily by the inlet flow of CO. Recovery of performance in response to a pure hydrogen purge was found to be sluggish and apparently controlled by the rate of thermal desorption of the CO from the catalyst surface. Their data provide a step toward an understanding of the rate controlling steps of recovery and poisoning that should be governed by kinetics and thermodynamics of CO oxidation and physical and chemical adsorption.
A review of the literature concerning electrocatalysis of CO oxidation and these phenomena can be found in Ref. 2. The poisoning of the electrode is a result of preferential adsorption of CO on the catalyst and it results in a decrease in the available catalyst sites for hydrogen oxidation. However, the rate at which the performance decays and recovers will depend on the transport rates though the cell hardware, the design of the membrane (which controls the oxygen permeance from cathode to anode), the catalyst composition and loading, and the concentrations of water and gases at the three-phase interface. Here, data are presented in which we changed the GDM and studied the differences in the poisoning and recovery rates with the same membrane and catalyst loading. We also discuss the effects of GDM on the effectiveness of air bleed as a recovery scheme.
Injection of air or oxygen into the fuel stream ahead of the fuel inlet of the fuel cell has been employed to oxidize the CO from the catalyst surface and to restore the cell performance.1,3 Techniques, other than air bleed, aimed at reducing the poisoning effect of CO on the anode electrocatalyst by thermal and other chemical methods, were not studied here. For example, the operation of a PEM fuel cell (FC) above 100°C will increase reaction kinetics and lower the susceptibility of the anode electrocatalyst to CO poisoning. However, operation at these temperatures with the existing perfluorosulfonic acid membranes will cause the membranes to lose conductivity due to drying. Nonvolatile acidic-electrolyte-impregnated ion-exchange membranes4 and blends of high temperature resistant polymers and inorganic acids5,6 have been evaluated for operation at higher temperatures and lower humidity levels, but data on the long-term stability of these systems have not been reported. Moreover, the presence of liquid water during cell start-up may leach some of the inorganic additives added to the membrane. The introduction of dilute hyd
rogen peroxide to counteract performance degradation due to CO poisoning7 was recently shown to be primarily a method for providing an enriched oxygen stream.8 Another method of maintaining performance when utilizing a fuel stream containing potentially harmful levels of CO employs the adjustment of temperature and pressure to maintain the partial vapor pressure of hydrogen within a predetermined range.9 Still another recovery scheme may involve cycling the current and raising the anode overpotential to enhance the electrochemical oxidation of CO.10 A more recent patent11 claims that starvation of fuel and electrical shorting of the cell can improve performance of a PEMFC exposed to CO. Future publications from our team may study the effect of these techniques on the performance of Gore’s advanced electrodes exposed to relatively high levels of CO. In this paper, we only include data with air bleed as the preferred recovery scheme.
Experimental
The studies focused on quantifying the loss in performance of PEMFCs in the presence of relatively high concentrations of CO (up to 3000 ppm CO) in the anode stream. In addition, the effect of air bleed on the performance was examined in the experiments. The MEAs used were PRIMEA® Series 5561 MEAs, consisting of GORE-SELECT membranes (25 μmm nominal membrane thickness) and catalyst loadings of 0.45 mg/cm2 Pt alloy on the anode and 0.4 mg/cm2 Pt on the cathode. The active area of the membrane was 20 cm2 and the triple-serpentine flow fields consisted of 30 equally spaced channels of 0.1 cm height and 0.08 cm width. The GDM used in the experiment were CARBEL CL GDM (16 mil = 0.406 x 10²³ m) and single-sided ELAT® (0.406 x 10⁻³ m) GDM. The same type of GDM was used for both the anode and the cathode sides of the MEA. This thickness was measured at nine points on the 20 cm2 surface. A compressible material (silicone coated fiberglass) with a measured thickness of 10 mil (0.254 x 10⁻³ m) was used as a gasket. Another thin gasket (1.2 mil = 0.305 x 10⁻³ m) referred to as the subgasket, was placed between the MEA, the GDM, and the gasket to allow for better alignment of the active area of the MEA and GDM during cell assembly. The average internal pressure on the active area was 150 ± 25 psi. This pressure was measured with a pressure indicating film (PRESSUREX®) tactile pressure indicating film, Sensor Products, Inc., NJ), which provided an average between the high pressure zones corresponding to the rib spacing and the low pressure zones corresponding to the flow channel. Eight bolts were lubricated and threaded into tapped holes on one of the end plates, and the cell was compressed by applying a torque of 50 in. lbf/bolt. Note that changes from this torque and internal pressure may affect the ability to reproduce the results presented below.12,13
The experiments consisted of both steady-state and transient measurements. For the steady-state section of the experiments, the current-voltage (I-V) (polarization) behavior was measured in the presence of neat hydrogen and mixtures of CO in H2 (CO/H2) at a stoichiometry of 1.2 for the anode and 2.0 for the cathode. In these polarization experiments, the gases used were 500 and 3000 ppm CO in H2. After recording a polarization curve with neat H2, polarizations in CO/H2 mixtures with and without air bleed were obtained. The technique increased the total anode flow by adding dry, room-temperature air to the required stoichiometric flow until the air comprised the desired fraction. Two levels of air bleed were used, 5 and 15% air for the 500 and 3000 ppm CO, respectively. The cell voltage was randomly set from 0.45 V to open circuit voltage (OCV) and the resulting steady-state currents were measured for a polarization curve. The randomization gave reproducible results and accounted for any hysteresis in the measured current densities. While recording the polarization curve, the flow rates were adjusted manually in an iterative manner to maintain the desired stoichiometry.
After establishing steady-state behavior, the experiments with transient feed conditions for 500 and 3000 ppm CO/H2 mixtures were conducted at a fixed current density of 600 mA/cm2. These transient conditions corresponded to repetitive introductions of a high CO concentration followed by periods with neat H2 or a low CO concentration. The objective of these experiments was to determine the relative rates of poisoning and recovery when the surface was at pseudo-steady-state coverage. For the first set of experiments a baseline with neat hydrogen was established and a cycle of 500 ppm CO/H2 was introduced for 5 min, followed by neat hydrogen for 25 min. This cycle was repeated six times. Then, a 50 ppm CO/H2 gas mixture was introduced as a baseline and a repetitive test for 500 ppm CO/H2 was performed (i.e., 500 ppm CO/H2 was introduced for 5 min and then 50 ppm CO/H2 for 25 min). Our assumption is that the latter condition probably mimics the real dynamics of the reformer. The third and fourth sets of the repetitive cycles were the same as the first and second sets of experiments, but air (5 vol%) was injected on the anode side during the test. For the third set, a neat hydrogen baseline was established, the 500 ppm CO/H2 mixture gas was supplied for 5 min, and then neat H2 was resumed for 25 min while 5% air was continuously injected on the anode side. This cycle (CO/H2 followed by neat hydrogen) was repeated six times. The fourth set was the same as the third except that a 50 ppm CO/H2 mixture was used in place of neat hydrogen as the baseline for 25 min. The fifth through eighth sets of experiments mimicked the first four, with the exception that a 3000 ppm CO/H2 gas mixture and 15% air bleed were used.
We chose the exposure time of 5 min for the high concentrations of CO because preliminary experiments indicated that this interval would yield a reproducible current consistent with the currents observed during steady-state experiments. Again, the objective of this paper was to study the decay and recovery rates when the surface is exposed to equilibrium or pseudo-steady-state coverage. Future work may measure these rates when the coverage is not at an equilibrium value. Future work may also study these rates in the presence of reformate mixtures where the partial pressure of hydrogen interacts with the concentration of CO. We chose CO/H2 mixtures to isolate effects due only to CO poisoning of the surface and without any interactions due to N2 and CO2.
All experiments were performed using test stations made by Fuel Cell Technology, Inc. (Albuquerque, NM). High purity hydrogen (99.997%), premixed high purity hydrogen and CO, and bottled industrial grade air were used as the fuels and reactant, respectively. A three-way valve was used to switch from pure H2 or 50 ppm CO to 500 or 3000 ppm CO. The flow rates were set manually according to the measured current at a fixed stoichiometry. The stoichiometry corresponded to flow rates that were 1.2 times greater than that required (by the measured current) for hydrogen (i.e., 20% excess hydrogen) and 2.0 times greater than that required for air (i.e., 100% excess air). The anode and cathode flows were co-current. Two mass flow controllers that were calibrated using a bubble flow meter were used to control the gas flow rates. Air was bled manually through a calibrated needle valve flowmeter at the anode inlet. The gas temperature and its humidity were controlled by sparging the gases through water in a humidity tank. Humidification calibration measurements14 indicated that sparging the ga
ses through waterfilled tanks provided a controlled temperature and a dew point that changed with flow rate. We calculated the humidification efficiency at 1 atm from gravimetric measurements of condensed water collected by chilling the gases and we used that data to report an estimated dew point temperature within 62°C. The temperature of the cell was fixed at 70°C for all experiments. Also, the pressures of the anode and cathode sides were both 101 kPa, i.e., 0 psig. Each cell was held at 0.6 V for 50 h before the polarization data were obtained.
The humidification temperatures were 75/65°Cc for single-sided ELAT GDM (henceforth referred to as SSE) and 85/75°C for CARBEL™ CL GDM. The estimated dew points for the SSE and CARBEL CL GDM were 70/60 and 80/70°C, respectively, from the humidity calibration data. These humidification temperatures produced optimum polarization curves during preliminary experiments in neat hydrogen. These preliminary experiments consisted of fixing the anode and cathode humidifier temperatures and performing a polarization curve at the predetermined stoichiometric flow. The humidity temperatures were then changed and new polarization curves were obtained. The optimum humidity conditions were those that gave the highest cell voltage between 0.6 and 1.8 A/cm2. For current densities less than 0.6 A/cm2, changes in the dew points did not affect the performance in neat hydrogen indicating a wellhumidified membrane. Since the data presented below for high CO concentrations show current densities less than 0.6 A/cm2, we do not expect the inlet humidity to contribute to the differences in the performance with CO/H2 mixtures as discussed below. Note that we choose to compare the two GDM at these optimal humidity conditions because these conditions insure a well-conditioned MEA/ GDM combination (i.e., a membrane that is not dry and a GDM that is not flooded with liquid water) and that if we had fixed the humidity, we may not have compared the best performance of each GDM. Resistance measurements from either current interrupt or high frequency methods were not available with the test stations used in this study, but assuming the resistance is controlled by the anode relative humidity, we estimate the areal resistance of the membrane to be 0.0705 V cm2 at the optimum humidity for each GDM based on data from ex situ experiments.15
Multiple MEAs were used during the experiments with the 500 and 3000 ppm CO/H2 mixtures. Typically for any MEA, polarization curves were obtained for operation first with neat H2, then with 500 ppm CO, then with and without air bleed, and thus using neat H2 again. No significant differences between the initial neat H2 and the final neat H2 curves were observed. After completing the 500 ppm experiments, the level of CO concentration was increased to 3000 ppm and the sequence was repeated. Again, no significant difference between the initial neat H2 and the final neat H2 curve was observed. The reproducibility between MEAs was confirmed with polarization tests with neat hydrogen. The MEAs typically were operated continuously for 350 to 500 h, and therefore, the data reported here can be considered beginning-of-life (BOL) data.
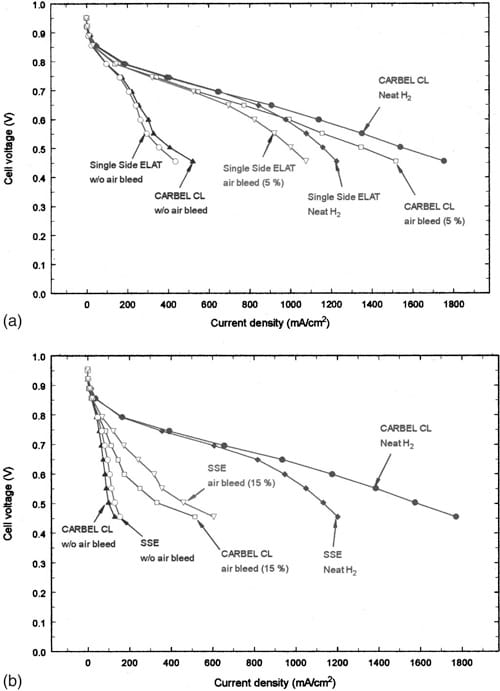
Figure 1. (a) Performance comparison between CARBEL CL and singlesided ELAT GDM for 500 ppm CO. (b) Performance comparison between CARBEL CL and single-sided ELAT GDM for 3000 ppm CO
Results and Discussion
Figure 1 shows the steady-state polarization behavior for both GDM with neat hydrogen and with 500 and 3000 ppm CO in the feed. In addition, the effect of an air-bleed treatment is shown in each figure. The differences between the GDM in neat hydrogen are apparent at cell voltages less than 0.7 V or applied currents higher than 0.6 A/cm2 and they can be attributed to differences in the permeability of the GDM rather than the dew points of the inlet stream, as discussed below. The data in Fig. 1a indicate that with 500 ppm CO, the performance is poor as can be expected at 70°C, but almost complete recovery in cell performance can be observed with 5% air bleed. On the other hand, 5 and 10% air bleed were not sufficient to improve the cell performance in the presence of 3000 ppm CO and, even 15% air bleed yields only partial recovery with 3000 ppm CO as shown in Fig. 1b. During comparison of Fig. 1a and b, note the apparent inconsistent improvement in performance with SSE for 3000 ppm CO (specially at low voltages during air bleed). It may be noted that the differences between SSE and CARBEL CL GDM with air bleed (especially at low cell voltages) are greater than the experimental errors. These differences may be attributable to either differences in the permeability of the GDM (as discussed later) or the humidity in the feed stream.
The differences are probably not due to the differences in inlet humidity that were optimized for each GDM in neat hydrogen. Inlet humidity might affect the membrane resistance, the access to the catalysts through the GDM, the coverage of CO, and the kinetics of CO oxidation. The resistance of the membrane is probably the same at the entrance15 since at these dew points and cell temperature the relative humidity is 100%. However the local resistance is affected by water transport due to electro-osmotic drag and diffusion along the channel length. The increased performance observed with CARBEL CL GDM and this MEA may require additional water (i.e., 80/70°C dew points) to prevent the anode drying. Reference 16 discusses membrane drying on the anode side for thicker membranes than the ones used in this study. We expect membrane drying even with the thin membranes used here at extremely high current densities. The access to the catalyst is affected by the properties of the GDM and the local presence of liquid water that blocks the pores of the GDM. SSE has a lower permeability as discussed below and this can interact with the humidity13,14 to affect the high current polarization. Evidence of this lower permeability is observed in the oxygen mass transfer region with neat hydrogen and in the fact that dew points (70/60°C) lower than those for CARBEL CL GDM were required for optimal performance in the oxygen mass transfer region. With CO/H2 mixtures, where the current densities are typically lower than in pure hydrogen, the permeability rather than the membrane resistance controls the behavior.
Inlet humidity may also affect the CO coverage. Although such a study is beyond the scope of this paper, data from isotherm experiments of CO in the presence of varying partial pressures of water might help explain the transient rates presented below. Again, with the dew points and cell temperature used in these experiments, the entrance of the flow channel is near 100% relative humidity. Thus, one would expect equal adsorption of water on the catalyst of the MEA and that the differences in performance between the GDM at the relatively high concentrations of CO are not a result of inlet humidity affecting the CO coverage. We also do not expect that the kinetics of CO oxidation by direct reaction with oxygen will be slowed significantly because the changes in the relative humidity are small compared to the production of water from 6% of hydrogen consumed with 15% air bleed. One would not expect the electrochemical oxidation kinetics to be slowed at high relative humidity because water (or rather, the hydroxyl group on the alloy) is a reactant.
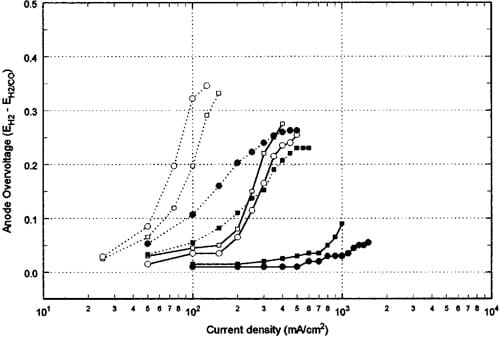
Figure 2. Anode overpotentials ~calculated by difference! due to CO poisoning for CARBEL CL a
nd single-sided ELAT GDM at different conditions: (dashed lines) 3000 ppm CO/H2, (solid lines) 500 ppm CO/H2, SSE GDM with air bleed, SSE GDM without air bleed, CARBEL CL GDM with air bleed, CARBEL CL GDM without air bleed.
Figure 3. (a) Transient performance with 50 and 500 ppm CO at 600 mA/ cm2 with CARBEL CL GDM. (b) Transient performance with 50 and 500 ppm CO at 600 mA/cm2 during air bleed with CARBEL CL GDM.
Another hypothesis for the difference in performance between the two GDM is related to the extent of surface coverage by CO and the permeability of the medium. In general, exposure to CO decreases the electrochemically active area for hydrogen oxidation, and therefore, yields lower currents (and lower current densities based on the geometric area) than neat hydrogen at the same overpotential. For this MEA, 500 ppm CO does not completely cover the anode surface and at sufficiently large overpotentials, the current is limited by the number of active sites available rather than by the adsorption step of H2 on a free site as discussed in Ref. 2. Other measurements indicate that CARBEL CL GDM has a much higher permeability than single-sided ELAT GDM, 9.0 x 10⁻¹² and 9.9 x 10⁻¹⁴ m2, respectively.d This two-order of magnitude increase in the permeability would normally improve the internal limitations of mass transfer at the cathode with neat hydrogen as shown clearly at 0.4 V in Fig. 1b.e However, because the surface is only partially covered by the 500 ppm CO, the larger permeability allows a larger flux of oxygen (from the air bleed) to the poisoned surface, a larger flux of H2 to those sites not poisoned, and hence, a higher current density is observed with CARBEL CL GDM. On the other hand, with the 3000 ppm CO mixture, the surface is sufficiently covered so that only a few sites are available for H2 adsorption and oxidation. At lower cell voltages, the electrochemical oxidation of CO controls the number of available sites for the hydrogen reaction, and with SSE, the flux of CO to these sites is decreased with the lower permeability of this GDM. Note that the effective internal mass transfer resistance of SSE is even more remarkable since the flows in the channels are increased for the SSE data at 3000 ppm to maintain a constant stoichiometry.
Evidence for the electrochemical oxidation of CO may be shown with a graph of anode polarization. That is, it is difficult to compare the CO tolerance between the two GDM since the baseline performances with neat hydrogen for SSE and CARBEL CL GDM are different (as mentioned earlier). This comparison is aided by using the anode overpotential graph of Fig. 2. These overpotentials are calculated from the difference between the cell potential with neat hydrogen and the cell potential with CO/H2 at the same current density. Therefore, to call this an overpotential, it is assumed that the hydrogen overpotential with neat hydrogen is negligible, and that the ohmic contribution to the cell voltage and the cathodic overpotential depend only on the current density. The results shown in Fig. 2 can be compared with Fig. 4 of Ref. 2 where polarization data are shown as a function of temperature for 20 ppm CO in H2. No airbleed data are shown in Ref. 2, but a current density limited due to the availability of active sites of 0.05 and 0.2 A/cm2 was observed at 20 ppm CO and 40°C for the Pt/C and the Pt-Ru/C electrodes, respectively. On the other hand, at 20 ppm and 70°C in Fig. 4 of Ref. 2, a limited current density of 0.4 A/cm2 is obtained with Pt/C while no limiting current is evident from the Pt-Ru/C electrode. In our study, a limiting current density occurs at 0.25 A/cm2 for SSE and 0.30 A/cm2 for CARBEL CL GDM for 500 ppm without air bleed as shown in Fig. 2. Without air bleed, the active site limited current density for 3000 ppm CO is observed in Fig. 2 to be approximately 0.10 and 0.08 A/cm2 for SSE and CARBEL CL GDM, respectively. The fact that the current is changing over this limiting plateau may indicate that over the 20 cm2 area some local overpotentials are large enough to oxidize CO. For SSE, air bleed with 3000 ppm CO yields polarization performance similar to the performance with 500 ppm without air bleed. The air-bleed technique is effective in regenerating enough sites so that this limiting current for SSE at 500 ppm increases from 0.25 A/cm2 to approximately 1.0 A/ cm2.
For the transient experiments, the repetitive tests consisted of measuring decay and recovery rates when a baseline concentration was changed to 500 ppm and 3000 ppm CO/H2 gas mixtures as described in the Experimental section. The objective was to seek the rates of poisoning and recovery of the MEA when the surface had reached equilibrium coverage. Figure 3 shows an example of the results for a combination of this MEA and CARBEL CL GDM when a 500 ppm CO/H2 mixture is pulsed on top of a 50 ppm CO/H2 baseline. In Fig. 3a, one observes a gradual decline in the cell voltage, from 0.69 to 0.62 V over a 2 1/2 h period when the feed is changed from neat hydrogen to the 50 ppm CO/H2 mixture. This decline in cell performance is expected due to the poisoning characteristics of CO. The small abrupt changes in the voltage during this decline are a result of the resolution (65 mV) of the electronic load in the test station. Note that this resolution contributes to the oscillations in voltage after recovery during the first two cycles between 0.605 and 0.615 V. This gradual decline is recovered when 5% air is bled with the 50 ppm CO/H2 mixture as shown in Fig. 3b. The transient performance is best shown in Fig. 3a when 500 ppm CO/H2 is introduced without air bleed. There the decay rate changes from an initial value of 20.323 V/min to a final average rate of 20.409 V/min. This average final rate is obtained after three repetitive exposures. The lowest voltage with 500 ppm CO/H2 without air bleed corresponds to the steady-state value shown in Fig. 1a. After the 5 min exposure to 500 ppm CO/H2 , the recovery rate reaches its final value of 0.055 V/min during the first or second cycle. This rapid stabilization of the recovery rate is consistent with the availability of a large number of sites on this MEA for hydrogen adsorption and the notion of this adsorption being the rate-limiting step for hydrogen oxidation. The final decay and recovery rates are shown in Table I. Table I also indicates that with air bleed and 500 ppm CO/ H2, the rates are so fast that they cannot be measured (not available, N/A) with our equipment. This is consistent with the expectation that air bleed has a dramatic influence on improving the CO tolerance. An example of this performance is shown in Fig. 3b. Note that Table II shows that the decay rates are faster when switching from a neat H2 baseline to 500 ppm CO mixture (as can be expected). Table II also indicates that the decay and recovery rates for SSE are slower than that for CARBEL CL GDM. The poisoning/recovery cyclic behavior for both GDM from a neat hydrogen baseline is similar to that shown in Fig. 3 and the final rates are shown in Table II. Also, the cyclic behavior for SSE from a 50 ppm CO/H2 baseline is similar to that shown for CARBEL CL GDM in Fig. 3.
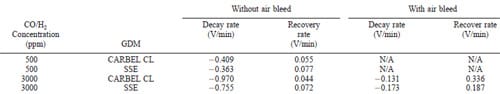
Table I. Dependence of decay and recovery rates on CO/H2 mixture composition at 600 mA/cm2 with 50 ppm CO in hydrogen as the baseline
It may be useful to discuss the procedure for obtain
ing the slopes shown in Tables I and II. The sample rates for the transient data were 5 and 10 s per datum for the 3000 and 500 ppm CO concentrations respectively. The rates of decay were obtained by linear regression of a minimum of 5 points from the voltage/time data that span the maximum and minimum voltages. Thus, the rates were determined over a period of 25 s for the 3000 ppm data and 50 s for the 500 ppm data. Some judgment was necessary to select the points for this span for rapid changes such as those observed with 3000 ppm CO. A R2 of 0.90 was typical for these data points. One should note that faster sampling rates may yield different values for the slopes, and that the signal-to-noise ratio was not quantified for the data shown in Tables I and II. It should be noted that faster sample rates were attempted, but the data seemed to correlate with the voltage resolution of the load cell (65 mV). In contrast, using more points at a given sampling rate resulted in a large variation in the calculated rates. For the 500 ppm CO concentrations, the decay rates were slower, more points could be used, and thus one can have more confidence in the precision of these measurements. For the recovery rates, the R2 was typically 0.95 because the changes were slower and more points could be used in the regression.
Figure 4 shows an example of the behavior for CARBEL CL GDM for changes from neat H2 to 3000 ppm CO/H2. In contrast to Fig. 3a, Fig. 4a shows that the decay rates are much faster with 3000 ppm CO and the cell voltage is lower by about 80 mV. Table II shows that the final decay rate is approximately three times faster than the rate with 500 ppm CO without air bleed. Figure 4a shows that the decay rate increase from 20.971 V/min to the average of 21.427 V/min as also shown in Table II. The final average recovery rate (0.096 V/min) is also slower, albeit not substantially different from that obtained with SSE at 500 ppm CO without air bleed. It is interesting to observe that although the cell voltage at 0.6 A/cm2 (i.e., 0.315 V) with 3000 ppm CO is not shown in Fig. 1b, it can be used to extrapolate the polarization curve in Fig. 2 to infer that electrochemical oxidation is occurring (i.e., 0.37 V anode polarization at 600 mA/cm2). This extrapolation is obtained by subtracting the 0.315 V from the baseline voltage of 0.69 V shown in Fig. 4a. The data for SSE during operation at 0.6 A/cm2 yield a similar graph to Fig. 4a with the exceptions that during the periods of exposure to 3000 ppm CO, oscillations were observed (as discussed below), and that recovery after exposure yielded 0.67 V during the cycles rather than 0.69 V. Table II shows the final decay and recovery rates corresponding to the conditions of Fig. 4a. When 15% air bleed was used during the transient tests with 3000 ppm CO, oscillatory behavior was observed as shown in Fig. 4b. During 15% air bleed, the cell voltage at a current density of 600 mA/cm2 increased from 0.32 V to an average of 0.46 V as shown in Fig. 1b. Note that Fig. 1b was obtained at constant cell voltage rather than constant currents. Again, the small oscillations (65 mV) are due to the resolution of the load cell, but during exposure to the CO there are larger oscillations. We believe this is a result of chemical and electrochemical oxidation of the CO over a fraction of the 20 cm2 MEA area. This oxidation results in some free sites for H2 oxidation that are quickly poisoned again by the 3000 ppm CO. This explanation is consistent with the inability to obtain polarization data corresponding to 600 mA/cm2 for Fig. 1b and the extrapolation of the overpotential curve for 3000 ppm CO without air bleed in Fig. 2.
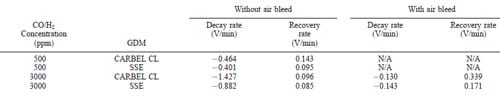
Table II. Dependence of decay and recovery rates on CO/H2 mixture composition at 600 mA/cm2 with neat hydrogen as the baseline.
Figure 4. (a) Transient performance with neat hydrogen and 3000 ppm CO at 600 mA/cm2 with CARBEL CL GDM. (b) Transient performance with neat hydrogen and 3000 ppm CO at 600 mA/cm2 during air bleed with CARBEL CL GDM.
Figure 5. (a) Transient performance with 50 and 3000 ppm CO at 600 mA/ cm2 with single-sided ELAT GDM. (b) Transient performance with 50 and 3000 ppm CO at 600 mA/cm2 during air bleed with single-sided ELAT GDM.
Figure 5 demonstrates the transient performance for SSE due to the repetitive injection of 3000 ppm CO from the 50 ppm CO/H2 baseline. The response of CARBEL CL GDM is similar to that shown in Fig. 5 with the exceptions noted below. One will notice the gradual decline in the voltage during the 1 1/2 h exposure to 50 ppm CO/H2 is consistent with that shown in Fig. 3a. Figure 5a shows that the decay rate increases from 20.729 V/min to the average of 20.755 V/min as also reported in Table I. Note that the value of 0.796 for the sixth cycle illustrates the difficulty associated with calculating these rates when oscillations occur. The final average recovery rate (0.072 V/min) is established by the second cycle although there is some difficulty with a precise calculation of this parameter due to the oscillations. It may be useful to note that the recovery from the 50 ppm baseline is not immediate when the feed is switched to neat hydrogen at 5 1/2 h. This contrasts with the data for CARBEL CL GDM (not shown here) where the recovery to the 0.69 V neat hydrogen baseline occurs within 15 min. This slow recovery is also consistent with that observed in graphs similar to Fig. 4a for SSE in which the baseline of 0.69 V was not obtained after exposure to 3000 ppm CO and a return to neat hydrogen for 25 min during the cycle. Also, the data for CARBEL CL GDM do not exhibit oscillations and the performance decreases to 0.315 V as shown in Fig. 4a. As with the data in Fig. 4b, we believe that the oscillations in Fig. 5a indicate the presence of regions of the 20 cm2 MEA where electrochemical oxidation of CO is occurring on the surface of the electrode. The oscillations are more pronounced with the SSE (see Fig. 5a) because the lower permeability of this media restricts the flux of CO to freshly cleaned sites. We further believe that these oscillations are also a result of the large number of sites available per unit area with this MEA for hydrogen oxidation. Thus, with the restriction of CO and the fast kinetics of the hydrogen adsorption and oxidation, a current density of 600 mA/cm2 forces a fraction of the electrode to be at an overpotential suitable for electrochemical oxidation of CO and the transient exposure of clean surface for H2 oxidation. This explanation is consistent with the understanding that neat hydrogen requires only a fraction of the catalytic sites available with an electrode with 0.45 mg/cm2 catalyst loading. Thus, we believe the oscillatory behavior is a result of the interaction of kinetics and CO mass transfer through the GDM that is most pronounced with an MEA with high degree of electrocatalytic activity.
Comparison of Fig. 5b with Fig. 5a shows a notable difference in the decay and recovery rates during air bleed. Table I summarizes the final rates. When air bleed is used, one observes more oscillations when 50 ppm CO/H2 is resumed after the 5 min of 3000 ppm CO exposure. This may be a result of more sites for hydrogen oxidation being made available by the air oxidizing the CO adsorbed on the surface. The average low voltage with the 3000 ppm CO is consistent
with the steady-state cell voltage of 0.45 V (shown in Fig. 1b). Note that without air bleed, the cell voltage during the 3000 ppm CO exposure is approximately 0.4 V, and a comparison of this value after extrapolating the data in Fig. 1b indicates that electrochemical CO oxidation may be occurring. One will also notice that the original baseline of 0.65 V shown in Fig. 5b is about 40 mV less than that shown in Fig. 5a. This is a reproducible result of using the MEA for previous experiments with 3000 ppm CO and not allowing sufficient time for recovery. It is believed that with sufficient time (.40 h with a neat hydrogen stream or with a short period of air bleed) the baseline should improve to 0.69 V and the data show decay from and recovery to this baseline during 15% air bleed with the same rates shown in Fig. 5b and Table I.
Conclusions
Steady-state and transient performance of advanced MEAs (PRIMEA Series 5561 MEAs from W. L. Gore & Associates, Inc.) during exposure to relatively high concentrations of CO has been presented to establish a well-documented baseline for designers of new MEAs and PEMFC control systems. Rates of decay and recovery are reported for equilibrium coverages of CO at 70°C cell temperature, low reactant stoichiometry, and atmospheric pressure for two types of GDM. Steady-state polarization data also obtained at the above conditions is reported for 500 ppm and 3000 ppm CO with and without air bleed. Injection of 5% air is shown to completely recover the performance of the MEA at 500 ppm CO for current densities less than 0.6 A/cm2. With 3000 ppm CO, complete recovery is not achievable even with 15% air bleed and current densities at 0.6 V averaged around 200 mA/cm2. Differences in the polarization data, especially during the presence of air bleed, are reported for the two GDM. Various hypotheses explaining the reasons for these differences are presented.
Transient measurements in the presence of air bleed indicate that decay rates are substantially lowered. Also, there is a significant improvement in the recovery rates in the presence of air bleed when the feed is changed back to either pure hydrogen or 50 ppm CO/H2 baseline mixture. The transient data without air bleed clearly indicate strong evidence in support of the electrochemical oxidation of CO at 600 mA/cm2. Also, the data show that there is an interaction of CO mass transfer and kinetic effects associated with the transient behavior of this MEA. These interactions are a result of the large number of sites available for the anode reaction.
References
- J. W. Bauman, T. A. Zawodzinski, and S. Gottesfeld, in Proton Conducting Membrane Fuel Cells II, S. Gottesfeld and T. F. Fuller, Editors, PV 98-27, p. 136, The Electrochemical Society Proceedings Series, Pennington, NJ ~1999!.
- S. J. Lee, S. Mukerjee, E. A. Ticianelli, and J. McBreen, Electrochim. Acta, 44, 3283 ~1999!.
- S. Gottesfeld, U.S. Pat. 4,910,099 ~1990!.
- S. Malhotra and R. Datta, J. Electrochem. Soc., 144, L23 ~1997!.
- R. Savinell and M. H. Litt, U.S. Pat. 5,525,436 ~1996!.
- J.-C. Lin, J. M. Fenton, H. R. Kunz, and M. B. Cutlip, Abstract 238, The Electrochemical Society Meeting Abstracts, Phoenix, AZ, Vol. 2000-2, Oct 22-27, 2000.
- V. M. Schmidt, H.-F. Oetjen, and J. Divisek, J. Electrochem. Soc., 144, L237 ~1997!.
- R. J. Bellows, E. Marucchi-Soos, and R. P. Reynolds, Electrochem. Solid-State Lett., 1, 69 ~1998!.
- S. Kawatsu, U.S. Pat. 5,925,476 ~1999!.
- L. P. L. Carrette, K. A. Friedrich, M. Huber, and U. Stimming, Phys. Chem. Chem. Phys., 3, 320 ~2001!.
- D. P. Wilkinson, C. Y. Chow, D. E. Allan, E. P. Johannes, J. A. Roberts, J. St-Pierre, C. J. Longley, and J. K. Chan, U.S. Pat. 6,096,448 ~2000!.
- W-k. Lee, C. Ho, J. W. Van Zee, and M. Murthy, J. Power Sources, 84, 45 ~1999!.
- W-k. Lee, L. Caves, and J. W. Van Zee, J. Power Sources, Submitted.
- W-k. Lee, Ph.D. Dissertation, University of South Carolina, Columbia, SC ~2000!.
- W. Liu, Gore Internal Report No. MA1097 ~Oct 2000!.
- M. S. Wilson, J. A. Valerio, and S. Gottesfeld, Electrochim. Acta, 40, 355 ~1995!.
![]()