

Article
Related Links
Roger E.A. Arndt
Saurav Paul
Christopher R. Ellis
Abstract
This project was initiated as part of a new research and development focus to improve hydropower generation. One aspect of the problem is severe cavitation erosion which is experienced when hydroturbines are operated at best power and in spinning reserve. Air injection has been used successfully to minimize or eliminate cavitation erosion in other applications. Thus, an investigation was initiated to determine whether or not air injection would be an effective solution for turbine erosion problems. A specially instrumented hydrofoil of elliptic planform and a NACA 0015 cross section was tested at flow velocities up to 20 m s-l, at various values of cavitation index. Pitting rate was not measured directly but was inferred from direct measurement of impulsive pressures on the surface of the hydrofoil and by monitoring accelerometers mounted at the base of the hydrofoil. Cavitation noise was also measured by a hydrophone positioned in the water tunnel test section. Air was injected through small holes in the leading edge of the foil. Air injection was found to be very effective in minimizing erosion as inferred from all three cavitation erosion detection teChniques.
1. Introduction
This study is the first phase of a research and development effort to improve hydropower generation within the Pacific Gas and Electric System. Severe erosion bas been experienced in the turbine in the Kerckhoff 2 powerhouse. This unit is operated for a considerable amount of time in spinning reserve as well as being op~rated at power settings above best gate. Leading edge erosion on the runner as well as erosion at the discharge end of the runner has been experienced. The unit is rated at 142 MW under a head of 119 meters. During normal operation the powerhouse sigma, defined in the usual manner,
varies between 0.162 and 0.188.
As illustrated in Figure la, which is H generic schematic for a turbine in this specific speed range (non-dimensional Ns = 1), leading edge cavitation erosion on both the suction Hnd pressme sides of the runner as well as erosion at the trailing edge of the buckets is common. Field inspection indicates that the Kerckhoff 2 runner exhibits similar patterns of erosion, as shown in Figure lb. This erosion occurs in spite of the fact that the plant sigma is adequate according to USBR field experience (c.f. Arndt, 1990).
This issue is part of a larger problem. Hydroelectric generating units encoillpassa wide range of si’zes, types, and ages. Throughout this array, the problem of cavitation pitting damage is present in varying degrees. In some units the damage . results in significant reduction in operating efficiency. In many machines, inpluding those coming on line within the last 10 years, extensive repair outages occur every few years. The increasing cost of ener!:,’Y that has to be generated by non-hydro sources· during hydroplant downtime emphasizes the need to reduce the repair periods both in number and duration by improved operation of existing units.
Arndt et al (1989) studied the extent of the problem under EPRI sponsorship. Their work is based on a field survey of the operational and design characteristics of 729 hydro-turbines installed since 1950 having either a capacity greater than 20 MW or a discharge diameter greater than 3 m. Their data includes approximately,2/3 of the total US hydropower capacity (40,000 MW). Their paper complements studies made prior to 1953 by the Edison Electric Institute, more recent studies made in Canada (Davies 1981, Gordon 1989, Gordon 1992) and in Japan by the Japanese Electrical Engineering Society (1981). US, Canadian and Japanese experiences are similar. Significant cavitation damage is noted in 80% to 90% of the units studied as shown in Figure 2. Operation of the units off peak significantly aggravated the problem. For 8,000 hours per year of operation time, material loss due to cavitation erosion ranged from negligible to 900 kilograms per year.
Two techniques for minimizing cavitation erosion are being studied. Since these units are operating in spinning,reserveas well as best power, both a cavitation monitoring system and a mitigation system were considered. By using a cavitation monitoring system, operational data necessary for achieving a trade-off between the extra revenue from operation at power: settings above best gate and the extra costs associated with excessive erosion can be obtained.
A cavitation acoustic emission test was performed prior to this study by Shanahan and Abbot (1993) using a cavitation monitoring system developed by Abbot (1989) and Abbot et al (1991). The results of their study are shown in Figure 3. The results clearly show that operation at best power increases erosion rate by a factor of 20 as inferred by acoustic emissions. Severe cavitation is also encountered when operating in spinning reserves as shown by the sharp increase in the emission signal at zero power. As part of the water tunnel studies reported herein, this system was evaluated under laboratory conditions. Details are presented in Abbot et al (1993).
In addition to cavitation monitoring, air injection is being considered as a solution to the erosion problem. The efficacy of artificially protecting hydraulic machinery against cavitation damage by injecting small amounts of air into the cavitating region has long been recognized and demonstrated (Mousson 1942, Anon. 1945). The origin of using this technique for mitigation of cavitation damage in hydrodynamic applications is not known. However, it is not unlikely that the idea followed from observations of reduced cavitation damage in large turbines during seasons when the air content of the reservoir water was high (Eisenberg, 1963).
Lord Rayleigh (1917) and Ackeret (1930) were the first to point out on , theoretical grounds that permanent gas in ~ cavItation bubble would greatly reduce’:~ the pressure emanating from a collapsing bubble. Experimental observations of the,’ effectiveness of air injection have been recorded by MOllsson (1937); He observed from his experiments in a venturi apparatus that the weight loss of a copper busbar due to cavitation erosion was remarkably reduced by injecting relatively small amounts of air. Rasmussen (1949, 1956) noted similar effects on aluminum alloys in a rotatiI1g disk apparatus. Huse (1975, 1976) conducted model studies on the effect of air injection on cavitation erosion on ship propellers. Based on the experiments in cavitation tunnels, it was shown that the air injection technique provided an efficient method of solving cavitation erosion problems of ducted propellers. The success of this tec
hnique in full scale installations is evident from the studies of Okamoto et aI (1975) and Narita et al (1977). This method of mitigating cavitation erosion has been subsequently applied to conventional (non-dueted) propellers; Air injection at high head spillways has become common practice and many older spillways are presently being retro·fitted with air injection systems. The exact mechanism for attenuation is not understood. Thus, the efficacy of air injection for eliminating leading edge cavitation erosion in hydraulic turbines is unknown. The present research is directed towards determining whether or not air injection is an appropriate solution for the problem at hand.
2. Previous Studies
2.1 Bubble Dynamics
Arndt (1981a) provid~s a summary of noise and erosion studies. Because erosion is such a complex problem, many different approaches have been taken to isolate certain features of the process. At the heart of the problem is the impulsive pressures created by collapsing bubbles (Rayleigh, 1917). Recent numerical techniques permit detailed examination of the collapse of individual bubbles (Blake et al 1986, 1987, Blake and Gibson 1987, Zhang et al 1992). This work is complemented by experimental studies (Lauterborn and Bolle 1975, Tomita and Shima 1986, Vogel et al 1989, van der Meulen and van Renesse 1993). All of these studies indicate that the final stages of collapse result in the formation of a microjet which can be highly erosive. Estimates of collapse pressures using the water hammer model,
where p = density, Co = speed of sOund in the liquid and Uj = jet velocity, indicate that pressures in excess of 1500 atmospheres are possible. However, Tomita and Shima (1986) suggest that several related mechanisms may be involved. The modes of bubble collapse are dependent on the proximity to a boundary. At the first collapse of a bubble positioned very close to or attached to a boundary the following occur: 1) a pressure pulse due to bubble collapse, 2) the impact pressure from a liquid jet formed within the original bubble, 3) impulsive pressures caused by the collapse of many tiny bubbles resulting from the interaction of the outward radial flow following liquidjet impact and the contracting bubble surface and, 4) the impact pressure from a shock wave radiated from the torus like original bubble at its rebound. Very high local pressures may result from the interaction of the micro bubbles in (3) and the shock wave in (4). Vogel et al (1989) found that the resulting pressure pulses can be of very short duration ranging between 10 and 40 ns. Since these pulse durations are much smaller than the rise time of typical pressure sensing devices, significant measurement errors can occur. They suggest that the peak amplitude of an exponential pulse is too low by a factor of
where r is the pulse time which is much shorter than the rise time r a of the pressure transducer. For typical transducer rise times, this factor can be of the order of 0.01 to 0.05 which explains the unreasonably low values of collapse pressure measured in most experiments. Vogel et al (1989) measured collapse pressure by measuring the change in refractive index of the liquid using a laser. Their measurements indicate that pressures as high as 60 Kbar can result from spherical collapse of bubbles.
In practical problems, the collective collapse of a cloud of bubbles is an important mechanism. Hansson and M0rch (1980) suggested an energy transfer model of concerted collapse of clusters of cavities. Because of mathematical difficulties this problem has not been studied in detail until recently (Chahine et a1 1992, Prosperetti et al 1993). Earlier work (van Wijngaarden, 1964) had already indicated the damage potential of a collapsing cloud of bubbles. Recent work supports. this contention. Another important feature of cloud physics is that the characteristic oscillation frequencies are in the tens of Hertz range. This has important implications for the acoustic monitoring technique used in this study. This research also provides a clue for understanding the effects of air injection. Presumably additional air bubbles tend to cushion the co1lapse of vapor filled bubbles.
2.2 Cavitation Erosion
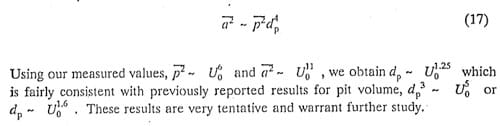
Most of the research in this area has been directed toward the mechanics of bubble collapse and the associated impulsive pressures, as well as a quantification of those material properties that are of importance in resistance to cavitation. Little has been done to correlate cavitation erosion with the properties of a given flow field. However, it is import,ant to have in mind that cavitation erosion will scale with a high power of velocity at a given cavitation number and that cavitation erosion does not necessarily increase with a decrease in the cavitation index (Stinebring et al, 1977); Very little quantitative information is available. However, it has also been observed that the cavitation pitting rate is measurably reduced with an increased concentration of gas (Stinebring et a, 1977). The important feature is that at constant a the pitting rate scales wlth the sixth power of velocity. It is important to note that the pitting rate is not quantitatively equivalent to the measured weight loss observed ina specially designed erosion test apparatus. However, Stinebring et al (1980) have been able to measure the energy absorbed per pit. This is directly proportional to its volume, which is found to scale with velocity to the fifth power, Thus, energy absorbed per unit area is:
This result has implicati’ons to the results in the present study.
Obviously the erosion rate is very sensitive to velocity in the initial stages of cavitation. Since the velocity in a turbine passage is proportional to the square root of head, this also implies that the magnitude of the erosion problem is more severe in high-head installations.
In many cases cavitation erosion can be traced to the region at the trailing edge of an attached cavity. The number of bubbles that collapse in this region in a given period of time will be a function of the cavity geometry, which in turn is a function of the cavitation index.
Advanced stages of cavitation erosion can be simulated in the laboratory by a variety of different devices. The most common is the ASTM vibratory apparatus described in Arndt (1981a). Thiruvengadam (1971) has analyzed a great deal of erosion data and has concluded that for engineering purposes, the erosive intensity of a given flow field can be quantified in terms of depth of penetration per unit timey and the strength Se of the material being eroded,
The intensity I is a function of a given flow field. The rate of penetration can be calculated from the weight loss per unit time Wand the surface area of the eroded material, Ac
where Ym is the specific weight of the eroded material. Many different forms of Se have been tried. The most used value appears to be ultimate strength, which is basically a weighted vallie of the area under a stress-strain curve (Arndt, 1990).
Thiruvengadam (1971) was also able to show that although various materials have
different rates of weight loss when subjected to the same cavitating flow and that the rate of weight loss varies with time, a normalized erosion rate versus time characteristic curve is similar for a wide range of materials. Thus, Thiruvengadam’s : simplified theory allows for rapid determination of 1 for a given flow by measuringy .’ for a soft material. Service life for a harder material can then be predicted from the· ratio of the strengths of the hard and soft material. One objective of this study is to relate pitting rate observed in hydrofoil experiments to pitting rate and subsequent weight loss observed in the ASTM vibratory apparatus.
2.3 Water Tunnel Simulations
Recently many researchers have recognized that the basic physics of erosion, in a turbine can be simulated by experiments with partially cavitating hydrofoils in a water tunnel (AvelJan et al 1991, Bourdon et al 1990, Avellan and Dupont 1988, Abbot et al 1993, Le et a1 1993a, 1993b). These studies indicate that maximum erosion occurs at the trailing edge of a cavity. The cavitation cloud at the trailing edge contains complex vortical struct’ures which are highly erosive. Several investigators have noted that the erosion process is modulated ata frequency which depends on the cavity length, i.e. fLc/Uo ~ 0.3. This modulation is easily detected by the detection scheme used in this study.
KatD et al (1989) performed a series of tests using two different sized foils having a NACA-0015 cross section. Using soft indium inserts mounted on the suction side of the hydrofoil, they were able to quantify the erosion rate using the pit counting technique. They also found that they could simulate either bubble cavitation or sheet cavitation by simply changing the angle of attack. The so-called ductile probe technique was developed by Hackworth and Arndt (1974) for application to measuring cavitation erosion on full scale ship’ propellers (Hackworth, 1979). A comparison between weight loss and pit counting techniques was studied by Stinebring etal (1977). Simoneau et al (1989) have also used hydrofoil tests to develop a unique, electrochemical technique for monitoring cavitation erosion. This technique is suitable for monitoring erosion in both turbine models and full scale turbines. This work was extended by Bourdon et al (1989) who demonstrated through laboratory tests and field experience that hydrofoil cavitation provides a good simulation of hydroturbine cavitation. They used both the electrochemical detection method and the vibration monitoring technique originally developed by Abbot (1989) and Abbot et a1 (1991). Thus, there is ample evidence that cavitation erosion in hydroturbines can be simulated using cavitation hydrofoil tests in a water tunnel.
2.4 Cavitation Erosion in Turbines
As shown in Figure 1a, cflvitation pitting can occur at several components of a hydraulic turbine. The dominant type of pitting is usually on the surface of the runner or on the walls of the discharge ring. Cavitation can occur on other components, such as wicket gates. Although design parameters such as unit speed and specific speed for a given head have little variation from· manufacturer to· manufacturer, cavitation pitting rate varies widely even when relative comparisons are made. These variations are attributable to variations in setting, variations in manufacturing tolerances and variations in operational history of a given unit. The results from current and laboratory experiments are in agreement with certain tren,ds noted in the field, but certaih aspects of cavitation erosion in turbines are not well understood and require further research.
Arndt et al (1989) developed a nondimensional parameter by normalizing I, in Equation (5) with P/d2, and assuming Ac is proportional to d2, where P is the power and d is the diameter of the machine:
In practice the setting is normally a compromise between the cavitation free operation and performance breakdown. If this compromise is consistently the same for all types of machine, In should not vary substantially. However, Arndt et al (1989) found that In varied considerably from negligibly small to an upper limit af In = 3.16 X 10⁻⁹ which was independent of specific speed. Using the. rated power of 142 MW of the Kerckhoff 2 unit, this is equivalent to a material loss of 385 kilograms per year over 8,000 hours per year of operation, which can be considered to be an upper limit.
In establishing guarantees, manufacturers normally assume that the rate of weight loss is proportional to the square of diameter, which is consistent with Equation (Sa) since P – d2 at constant head. Arndt et al (1989) found that erosion rate was more sensitive to the size of the machine than the simple square law assumed by the industry. This was qualitatively correlated with the results of the bubble dynamics, but a definite scaling procedure is not at hand. Clearly a cavitation monitoring system would he extremely lIseful for large turbines derived from smaller units.
2.5 Theory
In spite of the known effects of air injection in mitigating cavitation in the areas mentioned above, no theory exists to account for such effects. It had been thought by researchers that the mitigating effects of air injection may be attributed to the decrease in water hammer pressure in such cases. This followed from the fact that the speed of sound in a bubbly liquid is much lower than even the speed of sound in air (Figure 4). However, recent numerical studies of bubble cloud dynamics indicates that the explanation of such mitigating effects is far more complex and requires further research.
Studies in this direction are further warranted from the fact that very little work has been done on defining the formation of bubbles in moving liquids (Blake 1986). For gas jets in comoving liquids, Sevik and Park (1973) theoretically showed that the radius of the bubbles generated lies’roughly between 1.1 and 1.7 times (q/U0)O.5 for a defined relative Weber number being less than 1.2. Silberman (1957) observed the breakup of a gas jet emitted into a liquid from a hole in the midchord of the suction side of a hydrofoil. He found that the largest bubbles in the bubbly mixture formed is close to 1.2 times (q/U0)O.5, Sevik and Park (1973) and Hinze (1955) have found that in the case of turbulent flows bubble splitting depends on a threshold intensity of turbulence defined by a turbulence Weber number.
3. Experimental Methods
3.1 Experimental Facilities
Two experimental facilities were used in this study: the SAFHL high speed water tunnel and an. ASTM vibratory apparatus. The final goal of this work was to determine the effect of air injection on erosion in turbines as measured by weigh loss over a given period of time. Since a great deal of weight loss data has been generated using the ASTM vibratory apparatus, it was desirable to relate erosion intensity measured in hydrofoil tests to weight loss studies in the vibratory apparatus.
3.1.1 Water Tunnel
Hydrofoil tests were carried out in the SAFHL high speed water tunnel (Arndt et al, 1991). This facility has several unique features, including the ability to remove as much as 4% by volume of injected air. As shown in Figure 5b, the test section is separated into two parts by a thin plexiglass sheet. The lower section is 190 mm square and 1250 mm in length and handles flows up to 30 m s-1 in velocity. The upper tank contains stagnant liquid in which an array of hydrophones are mounted. The barrier between the flow and the hydrophones is approximately aco
ustically transparent. Acoustic measurement techniques are discussed by Higuchi et al (1989).
3.1.2 ASTM Vibratory Apparatus
Vibratory cavitation tests were conducted with the ASTM 0-32 procedure. The apparatus as shown in Figure 6, is a modification to allow for cavitation erosion tests on a stationary specimen. In accordance with the standards the vibration at the horn tip was set at a frequency of 20 KHz with an amplitude of 50 μm peak-to-peak. It has been observed in previous studies that the erosion rate of stationary specimen strictly depends upon its standoff distance from the face of the vibrating element. The standoff distance during this investigation was maintained at approximately 1.5 mm for most of the experimental work.
3.2 Design of Hydrofoil
The hydrofoil designed for this project is similar in overall configuration to other hydrofoils being used for other cuvitation studies (Maines and Arndt, 1993). As shown in Figure 7a, it has an elliptic pJanform with a straight leading edge and a NACA-0015 cross section. It is mounted in the test section on a circular plug allowing for a setting at any desired angle of attack. The overall dimensions are 95 mm half span and 81 mm chord. This gives an aspect ratio, A, of 3., The theoretical pressure distribution at various angles are also shown in Figure 7b. These calculations are based on two-dimensional flow analysis assuming the lift coefficient is given by classical lifting line theory
The foil is fitted with interchangeable leading edges. One of which was blank while the other had 5 grooves, that when in position created 5 holes at the leading edge of 0.5 mm diameter spaced 5 mm apart. These dimensions were selected on the basis of a number of previous studies on air injection for other purposes. Interchangeable inserts are also provided at mid-span as shown. One type of insert is machined of commercially pure aluminum for pitting studies. This can be replaced by an instrumented insert machined out of PVC plastic.
The various components of the hydrofoil as well as the mounting base was designed to withstand structural stresses developed at a maximum flow velocity of 30 ms-1 incjdent at 8 maximum angle of 16o. A factor of safety of 3 was used for the design calculations, The hydrofoil was made out of aluminum 6061-T6.
3.3 Instrumentation
The basic instrumentation used in this study consisted of hydrophones, accelerometers, tlush mounted piezoelectric transducers, and high speed video recording. Two B&K 8103 hydrophones were mounted in the water tank above the test section. The acollstic path between the foil and the hydrophones was one of Gonstant acoustic. impedance. Two accelerometers were attached to the outside of the hydrofoil base, one to a bolt threade,d into the foil itself, and the other to a lexan plug to which the foil was attached. A grid of 14 piezoelectric pressure transducers were attached ,to a removable section of the suction side of the foil as shown in ‘ Figure 7a. These custom made transducers, 6.35 mm in diameter and 150 μm thick, were bonded to the surface of the insert. All but the tip and near-base region of the foil was covered with a 150 μm thick adhesive tape (3M polyurethane protective tape #8672) which served both to protect and waterproof the transducers and smooth the joints in the surface of the foil. The data from the piezoelectric’ pressure sensors and hydrophones was obtained synchronously through a LeCroy digital data acquisition system. A video camera recorded the tests through a lexan window in the test section.
3.3.1 Pressure Detecting Film “Prescale”
In the initial stages of the investigation, the impact pressure measurements were made with a pressure detecting film “Prescale”. The Prescale consists of a couple of film sheets with different chemicals, namely the color forming material and color developing material, on the surface of each sheet. The color forming material is in microcapsules whose size is very small (of the order of 10 μm) and randomly distributed. As shown in Figure 8a, the film sheets form a sandwich with the chemical sides facing each other. When a certain pressure is exceeded some of the microcapsules are ruptured and the released color forming chemical reacts with the color developing chemical to generate red color. When the pressure increases, the ·smaller capsules are broken and the red color becomes deeper. The absolute pressure can be determined from the color density measured by a densitometer (Figure 8b). The value is a space-averaged pressure over an effective area of about 2 mm diameter defined by the size of the aperture of the densitometer. Compared to the expected individual pit size from cavitation to be of the order of 10 μm at the considered flow velocities, the spatial resolution of the densitometer would be far less than adequate. In this study, instead of a densitometer, the data on the film was collected using a video camera coupled to a frame grabber (Figure 9a). Appropriate software was used to convert the captured images to digital data on color intensity and its spatial distribution. A result of this procedure is shown in Figure 9b. The spatial resolution obtained in this process was 23 x 28 μm2. This technique of measuring impulse pressure is an indicator of erosion integrated over time and does not measure instantaneous values of pressure. The Prescale pressure sensitive film was subsequently abandoned in favor of a more quantitative measurementtechnique using piezoeiectric transducers.
3.3.2 Piezoelectric Film (PVDF) Transducers
The transducers were manufactured in-house from piezoelectric film. The integral component of the film is a polarized polyvinylidene fluoride (PVDF) polymer. This homopolymer discovered by Kawai (1969) for its high degree of piezoelectric activity, is sold under the trade name KYNAR. According to the manufacturer, ·the film has a dynamic range that covers from 100 JLPa to 1012 Fa and a frequency response that ranges from 0.005 Hz to 109 Hz. The film used was a 28 μm thick Nickel metalized film. Estimates of transient stresses reported in the literature are .’ as high as 1011 Pa. During initial development, the duration of such transient stresses was estimated to be about 2 μs. In light of these observations the PVDF film was considered to be specially suitable for recording the impulse pressures due to the cavitation events on the hydrofoil. This is probably too optimistic in light of the much shorter durations reported by Vogel et al (1989). Recent estimates of response time requirements indicate that obtaining an accurate description to cavitation impulses is a formidable task (Vogel et al, 1989).
Calibration
In the impact sensing mode the essential transduction property of the film is given in terms of the voltage or the stress coefficient gij This is defined as the ratio of the open circuit electric field to the applied mechanical stress. Output voltage is obtained by multiplying the calculated electric field by the thickness of the piezoelectric polymer between the electrodes. In our experiment the film was mounted in the “33” mode. This implies that the electric field and the mechanical stress are both along the polarizatiOJi axis. Thus, for the PVDF film used in this study (thickness 28 μm and g33 -339 x 10-3 V/m per Pa) the applied stress calibration is then 1.05351 x 10⁵ Pa/V. Calibration using a dropping ball technique indicated that the calculated sensitivity was very optimistic. Our estimate was 1.1 x 10⁶ Pa/V. The significant reduction in sensitivity is attributed to the particular method of mounting and coating with a pro
tective film. The time trace of the pressure signal recorded on a Philips 50 MHz digital storage oscilloscope from the dropping ball calibration test· is shown in Figure 10.
Layout
The layout of the PYDF sensor array is schematically illustrated in Figure 7a. In the incipient stage of development, the film was mounted on a PVC button which formed the stationary specimen in the ASTM vibratory cavitation setup. At a standoff distance of ].5 mm from the horn tip, an output signal in the range of 3 to 4 Volts could be obtained. The excellent response of the film and the very clean signal precluded requirements of any amplifier and noise filter.
The signal from the PYDF film is conducted through leads attached to both the metalized surfaces. Simultaneous monitoring of cavitation signals at closely juxtaposed target areas on the hydrofoil posed a major problem in terms of spatial management and architectural layout. This problem was handled by using a common ground for all the individual PYDF probes. Exploratory runs with this concept of common ground were made on the vibratory cavitation setup. The acquired temporal signal showed no evidence of any appreciable cross-talk amongst the signals of the different probes. This proven technique of fabricating a matrix of target sensors was subsequently used to instrument an interchangeable plug on the hydrofoil. A considerable effort ViaS expended in developing an adequate method of mounting and layout of the transducer array finally used. Unfortunately, this resulted in a reduction of the sensitivity of the sensor.
3. Results and Discussion
4.1 Preliminary Tests
4.1.1 Cavitation Inception
Preliminary to selecting the conditions for carrying out a comparative study of cavitation erosion with and without air, the hydrofoil was tested over a range of velocity and angle of attack. Cavitation data were compared with expected values (Figure 7b). As shown in Tahle I, reasonable agreement was found. Perfect agreement was not expected because the fit of various components was not perfect. Cavitation number is defined in the usual manner:
The analogy between Equations (1) and (9) is obvious.
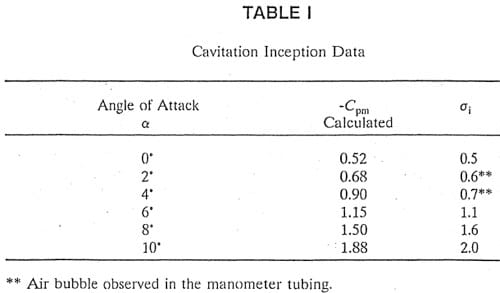
Table 1 – Cavitation Inception Data
In order to clo:;ely simulate the cavitation pattern observed on the Kerckhoff 2 turbines, the flow velocity relative to the blade during the operation at spinning reserve was calculated using procedures outlined in Arndt (1990). Based on the field data obtained from PG&E, the relative flow velocity waS estimated to be about 13 m s-1, Subsequently, cavitation tests in the water tunnel were performed at flow velocities ranging from 12.5 m s-1 to 20 m s-1.
After a preliminary series of tests, it was decided to make all comparisons at an angle of attack of 8o, At this incidence, a well developed sheet with cloud cavitation occurs over a range of cavitation number. Between σ = 1.0 and 0.6 bubble collapse occurs on the hydrofoil. Below σ 0.6 the sheet extends beyond the trailing edge of the hydrofoil.
4.1.2 ASTM Vibratory Apparatus Tests
Several different types of tests were carried out with the vibratory apparatus in the course of developing the PVDF transducers. Figure 11 shows the power spectrum measured beneath the horn with 6.35 mm diameter transducers at a stand.., off distance of 1,54 mm. Channel 4 is from a transducer positioned at centerline,of the horn. Chann’els 1,2; and 3 are from transducers each positioned at a radial offset distance of 7.94 mm and angles of 0′, 90′, and ISO’. A common ground was positioned at 27W. A:; expected, a strong peak is noted at a vibration frequency of 20 KHz with another peak at the first harmonic of 40 KHz. The signal from the centerline tran:;ducer is higher, as expected. Some discrepancies are noted in the signals from the other three trunsdllcers, wl:lich should be identical.
A second test was carried out to determine the etl’ect of transducer size. A circular shaped transducer was split into 3 pie shaped pieces haying included angles of 60o, 120o, and 180o respectively. The pressure spectra of the signals obtained by placing this configmation under the horn is plotted in Figure 12. The signal from each pie shaped transducer here can be seen to be essentially the same, indicating that effect of size was minimal.
4.2 Cavitation Noise
Figures 13 and 14 contain noise data collected at various values of a and flow velocity. In Figure 13 a comparison is made at Vo ~ 15 m S·l between sp’ectra collected at a ~ 0.8, 0.9, Hnd 1. The high frequency decay is 6. dB/octave which is typical for cavitation noise. The level of low frequency noise increases with decreasing a, but the high frequency noise level is highest at a ::: 1.0. At higher velocities, Figure ]4, the same trend with a is noted for the low frequency noise, but the high frequency noise appears to be independent of (}. This characteristic is not completely understood. It was also noted that the scaling of cavitation noise with velocity did not agree with the pressure data or the accelerometer data. Presumably the acoustic path between the hydrofoil and the hydrophones was modified by cavitation.
4.3 Pressure Pulse Height Spectra
Several researchers have turned to the measurement of the pressure pulse height spectra as a method to quantify erosion rate and have obtained encouraging results. De and Hammitt (1982) succeeded in correlating cavitation noise and erosion capability from the measurement of pressure pulse height spectra. Arai (1984) developed a diagnostic technique based on. the measurement of pulse height frequency of cavitation noise to detect cloud cavitation on marine propellers. Recent studies of N’guyen et al (1987), Quang et al (1989), Okada et al (1989), Iwai et a1 (1989) and Le et al (1993), all tend to prove that the pressure pulse measurements can directly be correlated to pitting rate measurements.
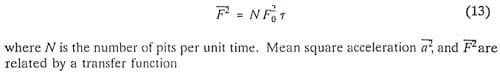
Since it was expected that the pressure signal would be dominated by pressure impulses of high amplitude due to cavitation, pulse height spectra were compared at· different velocities. A typical comparison is shown in Figure 15. Scaling of pressure amplitude with velocity depends on the frequency of occurrence, as expected. High frequency of occurrence corresponds to turbulent pressure fluctuations which scale like Uo2. High amplitude, low frequency of occurrence pulses scale with a much higher power of velocity. Presumably high amplitude pulses are due to cavitation events. Unfortunately, the measurement technique was not able to accurately resolve the amplitude of these pulses. Using the measured rise time of the film, the measured sensitivity and Equation (3), an estimate of 250 atmospheres was obtained, orders of magnitude below the expected value. The technique is further limited by a data rate of only 100 KHz, which appeared adequate for measurement of spectra. However, measurements of mean square pressure and pulse height spectra are consistent. The mean square pressure for a series of pulses of amplitude Pm and duration r is given by
Typical values for N, r,and Pm at a velocity of 17.5 m s-1 are 195 s-1, 5.3 μs, and 0.088 V respectively, which agree with a measured value of P2 = 8 x 10⁻⁶ V2.
Pulse height spectra were expected to be a good ind
icator of cavitation erosion intensity after further development. However, our initial findings suggest that . comparisons of the mean square signal in the frequency band 10 KHz to 30 KHz offer the best indication of erosion rate in the present study.
4.4 Effects of Air Injection
A comparison of relative erosive power versus normalized air flow rate is shown in Figures 16 and 17. Comparisons are made using three methods: 1) the mean square of the hydrophone signal in the 10 KHz to 30 KHz band, 2) the average of the three most intenfie. mean square· pressure signals in the 10 KHz to 30 KHz band and, 3) the mean square ·.modulation acceleration defined by Equation (4) in Abbot et al (199.3). The air flow rate per unit width, q, in the normalized air flow rate, q/U0C, is obtained by dividing the towl air flow rate applied by the number of holes (5) and the spacing between holes; c refers to the chord length of 68.87 mm at the position of the center air injection port.
The favorable influence of air injection is clearly evident. It is important to note that acceleration modulation analysis appears to be much more sensitive to. changes in erosive intensity. Further discussion of this technique is found in Abbot et al (1993). Although the modulation method appears to be the most sensitive technique, the effects of air on the pressure pulses are also evident. This is illustrated in Figures 18 and 19. Thefie are photographs of the sheet cavitation without and with a relative amount of air injection of 8.3 x 10⁻⁴. Superimposed on the plots are isobars of the mean square prefisure. The favorable influence of air injection over the entire surface of the foil is evident. Similar observations can be made in Figures 20 and 21 from the isobars of the number of pulfies exceeding a predetermined cdticallevel.
4.5 Modulation Frequency
As discussed in Abbot et al (J993), there is evidence that erosion intensity is most severe under conditions where a cavitating cloud is modulated. Whether this modulation is a function of the sheet characteristics, the cloud dimensions and void fraction, or a combination of both is not clear at this point.
If one assumes that a sheet has a cyclical life time that scales with the time required for a re-entrant jet to travel forward and pinch off the cavity (Stinebring et aI, 1980) then it follows that
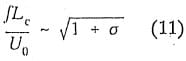
where it is assumed that
Since Lc varies strongly with a, most of the observed variation in modulation frequency with a is removed by using Lc as the characteristic length scale. This is shown in Figure 22. The frequency of oscillation is obtained from the modulation analysis and agreed almost perfectly with cavity oscillation frequency data obtained visually using a stroboscope.
4.6 Comparison of Modulation Analysis and Measurement of Mean Square Pressure
Abbot et al (1993) have found very good correlation between hydrofoil erosion rate measurements and the mean square acceleration level. They also found that their mean square acceleration levels had a velocity exponent as high as 11. On the other hand measured mean square pressure data scaled with velocity to a lower exponent. One possibility for this discrepancy is offered here.
Assuming that each pit formed on the surface of the hydrofoil corresponds to an impulsive force of amplitude F0 and duration r, the mean square force F is then
5. Conclusions
This study and previous work by others indicate that water tunnel tests are an effective method for isolating the essential flow physics that contribute to cavitation erosion in hydroturbines. Air injection has been shown to be very effective in minimizing erosion. The modulation analysis indicates reductions as high as 23 dB were found in these tests.
Initial results indicate that the modulation analysis technique is the most sensitive to changes in erosion rate. A simple analysis indicates that mean square acceleration and mean square pressure are related by the fourth power of pit diameter. If pit diameter scales directly with bubble size, there should be no difference in the velocity scaling for a2 and p2. However, there are observed differences in the velocity scaling of the two quantities, implying a velocity scaling for pit diameter which appears to be consistent with previous results .
. The piezoelectric film used in these studies shows promise. However, the very short duration of the pressure pulses, much shorter than the Rayleigh bubble collapse time, probably preclude accurate measurement of pulse height spectra. In spite of limitations in resolving pulse height, total impulse may be accurately recorded, implying that there may still be some reasonable validity to mean square measurements. Although trends with velocity and a were noted in the noise signal, the effect of cavitation on the acoustic path makes the monitoring of cavitation noise less effective than the other techniques used.
The results reported herein must be viewed as preliminary until a direct correlation between pitting rate and acoustic emission monitoring is achieved.
6. Suggestions for Future Work
Since the results of this study indicate that air injection would be an effective technique for mitigation of cavitation, the method should be developed further for field studies. The leading edge air injection technique developed in this study shows promise and an effective system for Francis runners can be developed.
A definitive correlation between pitting rate on the hydrofoil and weight loss measurements in the ASTM vibratory apparatus should prove invaluable, since a direct correlation between service life and weight loss does not exist.
Further research to correlate hydrofoil studies with model and full scale turbine tests is necessary to achieve a finite closure between laboratory tests and field experience. This is necessary for both evalustion of mitigation techniques and further development of cavitation monitoring system.
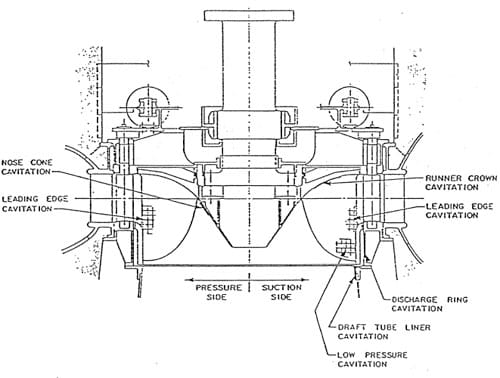
Figure 1a. Typical cavitation erosion patterns on a Francis turbine unit (Ns = 1).
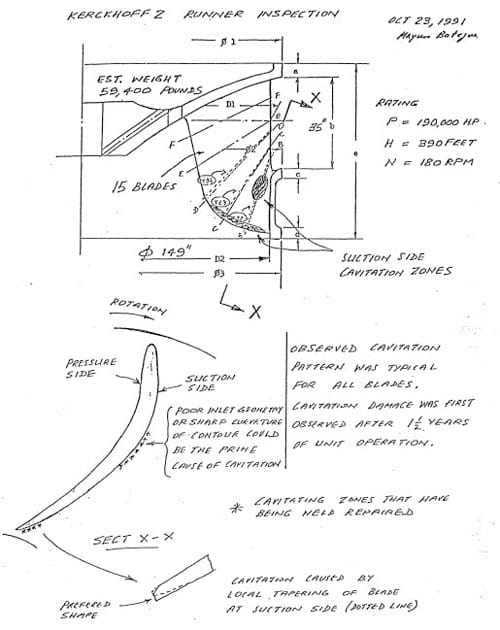
Figure lb. Cavitation erosion patterns on Kerckhoff 2 runner observed in field inspection (personal communication, Mayura Botejue, PG&E).
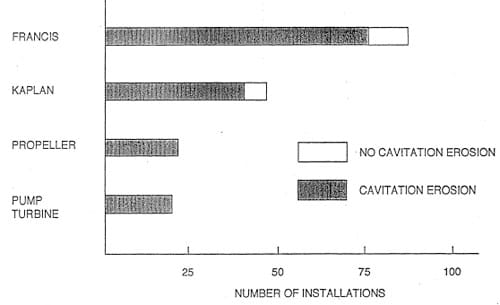
Figure 2. Results of a field study on cavitation erosion in turbines (adapted from Arndt et al, 1989).
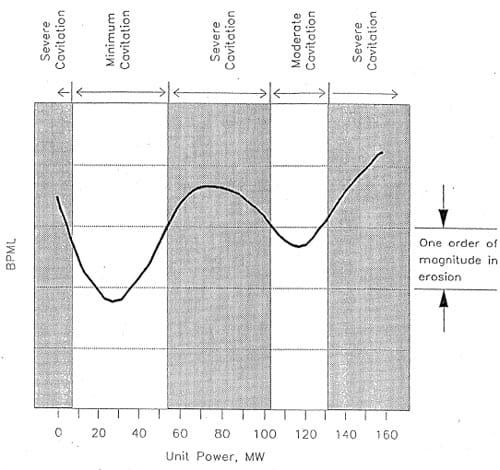
Figure 3. Erosion intensity measured in the Kerckhoff 2 turbine (Shanahan and Abbot, 1993).
Figure 4. Speed of sound in bubbly liquid.
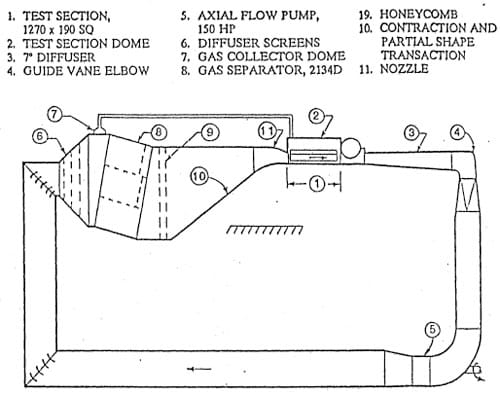
Figure 5a. Schematic of SAFHL high speed water tunnel.
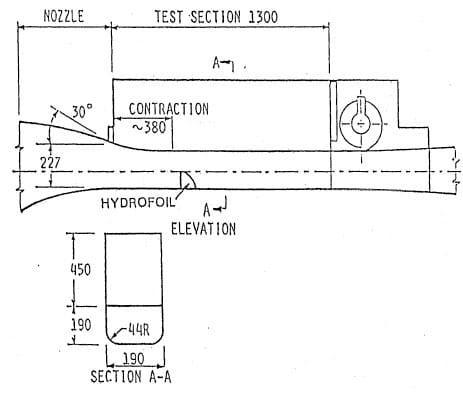
Figure 5b. Test section configuration.
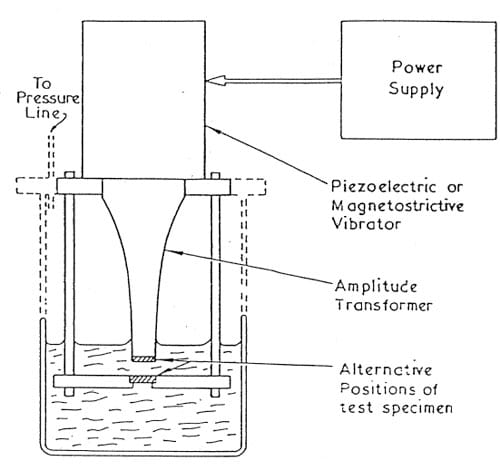
Figure 6. Schematic of the vibratory cavitation setup
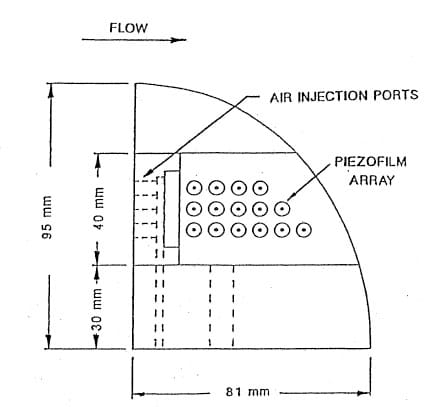
Figure 7a. Details of hydrofoil.
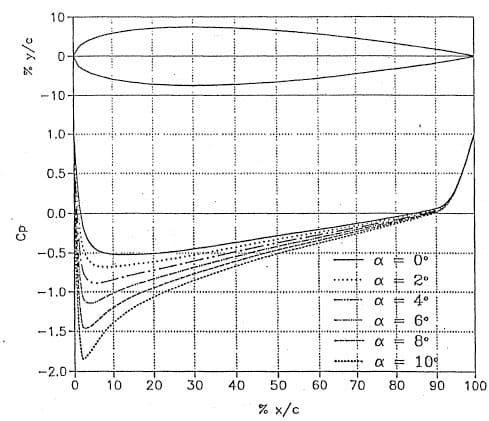
Figure 7b. Chordwise pressure distribution.
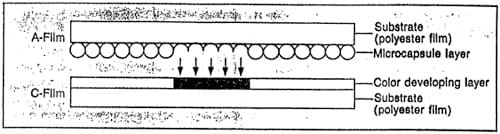
Figure 8a. Schematic of the pressure detecting film “Prescale” (adapted from Fujifilm Imaging & Information, Fuji Photo Film Co., Ltd., Japan).
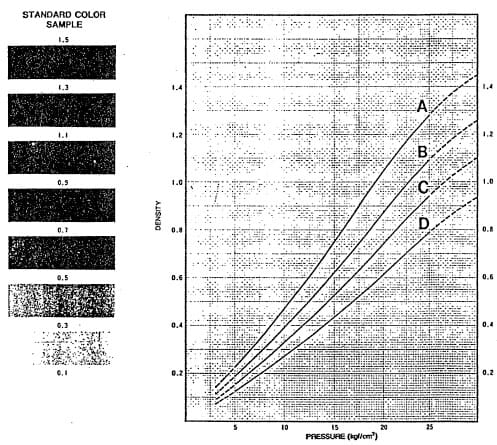
Figure 8b. Typical pressure calibration of the color density from “Prescale” exposed to momentary pressure (adapted from Instruction Manual, Fuji Prescale Film, Fuji Photo Film Co., Ltd., Japan).
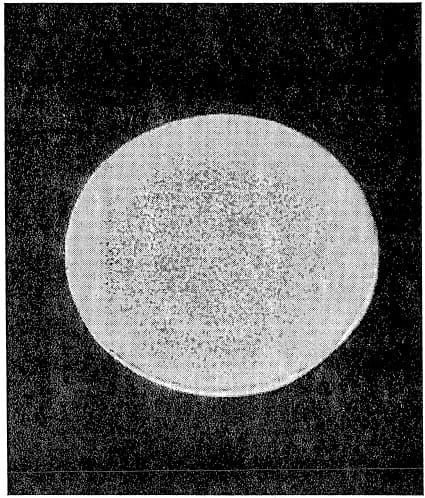
Figure 9a. Computer output of a digitized image acquired through the frame grabber. “Prescale” film exposed for 5 seconds at a standoff distance of 1.5 mm from the face of the horn.
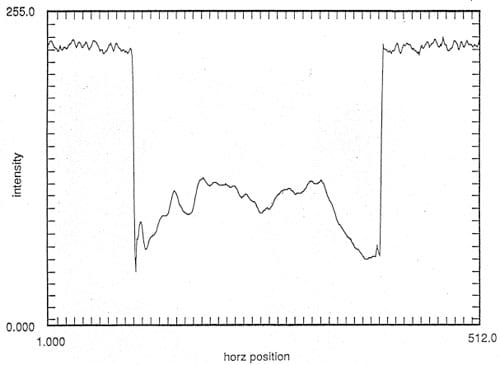
Figure 9b. Variation of the pressure field along the diameter of a stationary specimen placed under the horn at a standoff distance of 1.5 mm. Exposure time was 5 seconds. Numerical smoothing was performed on 7 x 7 over 7 x 7 pixels.
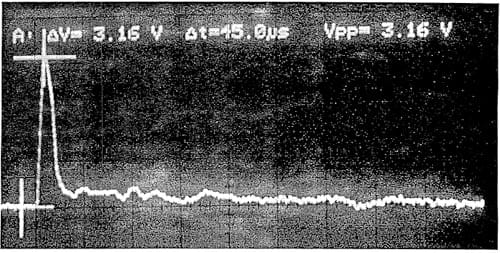
Figure 10. Time trace of the pressure signal acquired on the oscilloscope during the dropping ball calibration test.
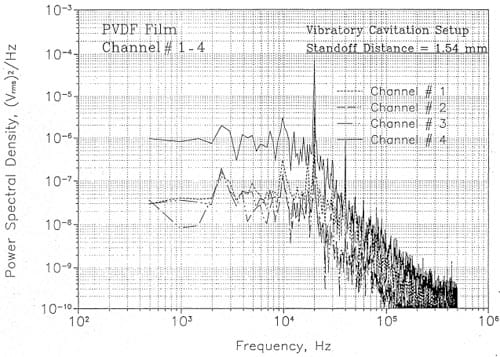
Figure 11. Measured pressure spectra beneath the horn in the ASTM vibratory apparatus.
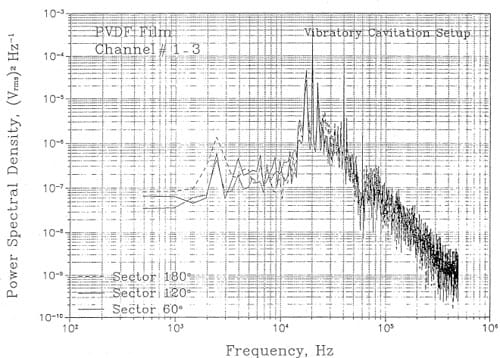
Figure 12. Measured pressure spectra of the signal from three pie-shaped piezoelectric sensors beneath the horn in the ASTM vibratory cavitation apparatus.
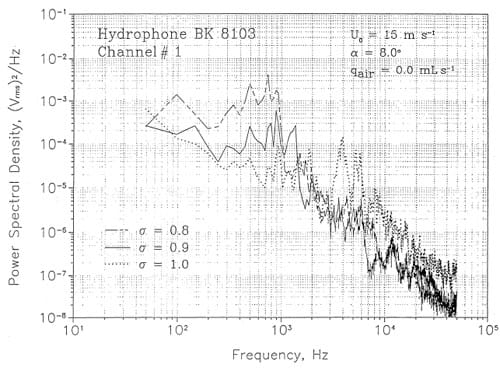
Figure 13. Cavitation noise spectra measured at Uo = 15 m s-1.
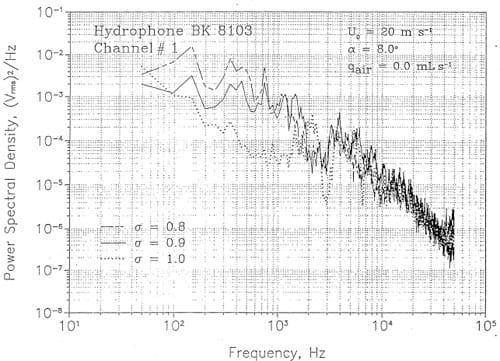
Figure 14. Cavitation noise spectra measured at Uo = 20 m s-1.
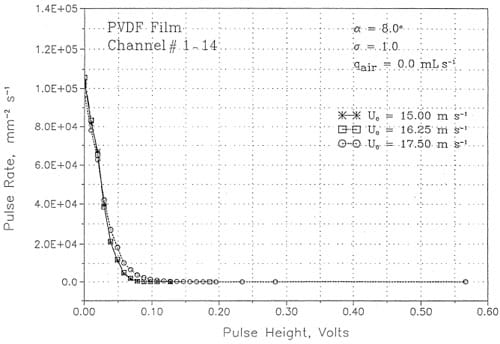
Figure 15. Comparison of pressure pulse height spectra at different velocities.
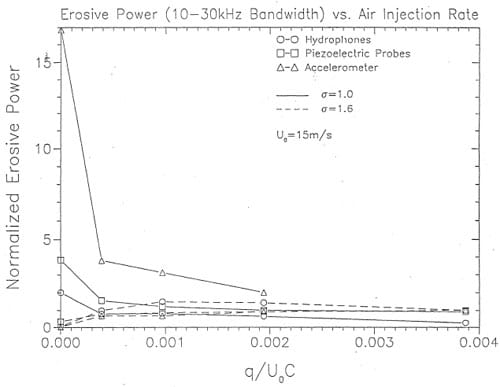
Figure 16. Comparison of normalized erosion power versus normalized air flow rate at Uo = 15 m s-1, σ = 0.9.
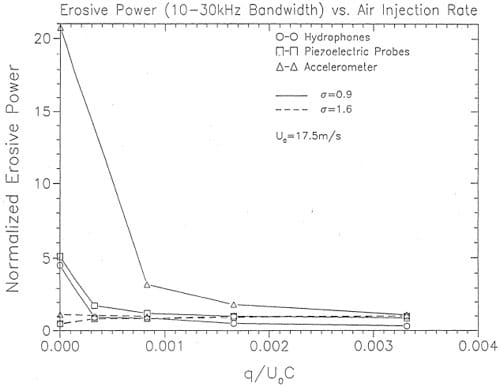
Figure 17. Comparison of normalized erosion power versus normalized air flow rate at Uo = 17.5 m s-1, σ = 0.9.
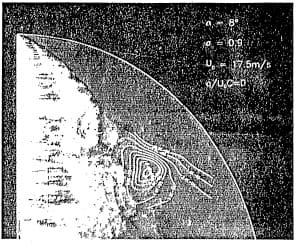
Figure 18. Photograph of sheet. cavit8tion at a = 0.9 and Uo = 17.5 m s-1. Superimposed on the plot are isobars of mean square pressure fluctuations.
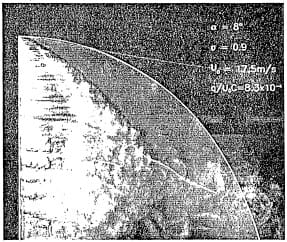
Figure 19. This is the same situation as Figure 18 except for an air injection rate, q/0c of 8.3 x 10⁻⁴. Note the dramatic reduction in pressure intensity over the entire surface of the foil.
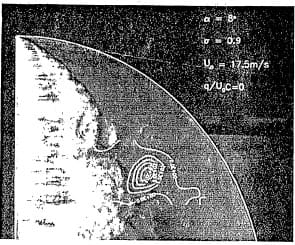
Figure 20. Photograph of sheet cavitation at a = 0.9 and Uo = 17.5 m S·l. Superimposed on the plot me isobsrs of the number of pulses exceeding a predetermined critical level.
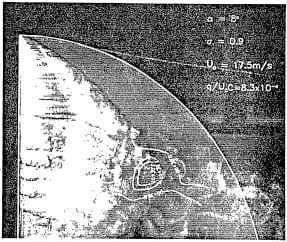
Figure 21. This is the same situation as Figure 20 except for an air injection rate, q/U0c 8.3 x 10⁻⁴, Note the dramatic reduction in amplitude of the pressure pulses over the surface of the foil.
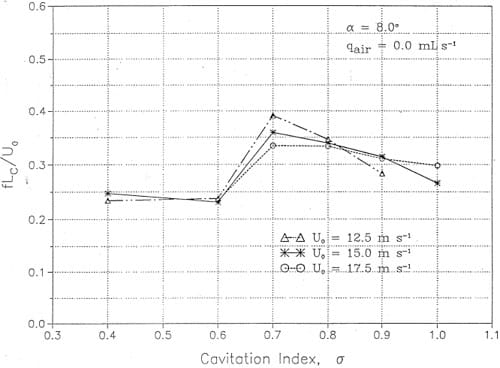
Figure 22. Variation of the modulation frequency with σ at Uo = 12.5, 15.0 and 17.5 m s-1.
References
- Abbot, P. A [1989], “Cavitation Detection Measurements on Francis and Kaplan Hydroturbines”, Proc. ASME Inti. Symp. on Cavitation Noise and Erosion in Fluid Systems (R. E. A. Arndt, M. L. Billet and W. K. Blake, eds.), FED-Vol. 88.
- Abbot, P. A, Welsh, J. and Halas, R. [1991], “Cavitation Noise Investigation of a Pump Turbine”, Proc. Inti. Conf. on Waterpower, Denver, CO, July.
- Abbot, P. A, Arndt, R. E. A and Shanahan, T. B. [1993], “Modulation Noise Analysis of cavitation Hydrofoils”, Proc. ASME Intl. Symp. on Bubble Noise and Cavitation Erosion in Fluid System, Winter Annual Meeting, December.
- Ackeret, J. [1930), “Experimentelle und Theoretische Untersuchungen tiber Hohlraumbildung (Kavitation) in Wasser”, Techn. Mech. lind Thermodyn., Vol. 1.
- Anon. [1945], “Cavitation in Hydraulic Structures: A Symposium”, Proc.ASCE, Vol. 71, No.7, September.
- Arai, C. [1984], “An Acoustic Detection Method of Cloud Cavitation”, J Fluids Eng., Vol. 106, December.
- Arndt, R. E. A 1981a], “Cavitation in Fluid Machinery and Hydraulic Structures”, Ann. Rev. Fluid Mach., Vol. 13.
- Arndt, R. E. A [l981b], “Recent Advances in Cavitation Research”,Advances in Hydroscience, Vol. 12, Academic Press, New York, NY.
- Arndt, R. E. A, et al. [1989], “Cavitation Erosion in Hydroturbines”, J. Hydraulic Eng., Vol. 115, No. 10, October.
- Arndt, R. E. A [1990J. “Hydraulic Turbines”, Hydropower Engineering Handbook, McGrawHill, Inc. (Gulliver, ~. S. and Arndt, R. E. A, eds.), Chapter 4.
- Arndt, R. E. A, Arakeri, V. H. and HigUChi, H. [1991], “Some Observations of Tip-Vortex cavitation”, J. Fluid Mech., Vol. 229.
- Avellan, F. and Dupont, P. [1988], “Cavitation Erosion of Hydraulic Machines: Generation and Dynamics of Erosive Cavities”, Proc. 14th I.A.H.R. Symp. on Progress within Large and Specific E
nergy Units, Trondheim, Norway, June. - Avellan, F., Dupont, P. and Farhat, M. [1991], “cavitation Erosion Power”, Proc. ASME-JSME Cavitation ’91 Symp., FED-Vol. 116.
- Blake, J. R., Taib, B. B. and Doherty, G. [1986], “Transient Cavities Near Boundaries. Part 1. Rigid Boundaries”, J. Fluid Mech., Vol. 170.
- Blake, J. R, Taib, B. B. and Doheny, G. [1987], “Transient Cavities Near Boundaries. Part 2. Free Surface”, J. Fluid Mech., Vol. 181.
- Blake, J. R and Gibson, D. C. [1987], “Cavitation Bubbles Near Boundaries”,Ann. Rev. Fluid Mech., Vol. 19.
- Blake, W. K. [1986], Mechanics of Flow-Induced Sound and Vibration, Vol. II, Academic Press, Inc., New York.
- Bourdon, P., Simoneau, R and Lavigne, P. [1989], “A Vibratory Approach to the Detection of Erosive Cavitation”‘, Pi,Qc. ASME 11111. Symp. on Cav;(mion Noise find Erosion in ‘Fluid Systems (R. E. A. Arndt, M. L. BiUet and W. K. Blake, eds.), FED-Vol. 88.
- Bourdon, P., Simoneau, R, Avella,n, F. and Farhat, M. [1990J, “Vibratory Characteristics of Erosive Cavitation Vortices Downstream of a Fixed Leading Edge Cavity”, Proc. 15th I.A.H.R Symp., Belgrade, Yugoslavia, September.
- Chahine; G. L., Duraiswami, R. and Rebut, M. [1992], “Analytical and Numerical Study of Large Bubble/Bubble and BubblelFlow Interactions”, Proc. ONR Symp., Seoul, Korea, August.
- Davies, J. P. [1981], “Hydraulic Turbine Cavitation Pitting Damage”, RPOOO G136, Crippen Consultants, North Vancouver, B.C., Canadian Electrical Association.
- De, M. K. and Hammitt, F. G. [1982], “New Method for Monitoring and Correlating Cavitation Noise to Erosion Capability”, J. Fluids Eng., Vol. 104, December.
- Eisenberg, P. [1963], “Cavitation Damage”, Hydronaulics, Inc., Tech. Rep. 233-1, December.
- Gordon. J. L. [1989], “Submergence Factor of Hydraulic Turbines”, J. Energy Eng;, Vol 115, No.2.
- Gordon, J. L. [1992J, “Hydroturbinc Cavitation Erosion”, J. Energy Eng., Vol. 118, No.3, December.
- Hackworth, J. V. and Arndt, R. E. A. [1974J, “Preliminary Investigation of the Scale Effects of Cavitation Erosion in a Flowing Media”, Cavitation and Polyphase Flow Forum, ASME.
- Hackworth, J. V. 11979), “Predicting Cavitation Erosion of Ship Propellers from the Results of Model Experiments”, Proc. 51h Inti. Conf. on Erosion by Solid and Liquid Impact, Cambridge, U.K.
- Hansson, 1. and March, K; A. [1980], “The Dynamics of Cavity Clusters in Ultrasonic (Vibratory) Cavitation Erosion”, J. Appl. Phys., 51(19), September.
- Higuchi, H., Arndt, R E. A. and Rogers, M. F. [1989], Characteristics of Tip Vortex Cavitation Noise”, Tmns. ASME I: J. Fluids Eng., 111.
- Hinze, J. O. [1955J, “Fundamentals of the Hydrodynamic Mechanism of Splitting in Dispersion Process”, AIChE J., Vol. I, No.3.
- Huse, E. 11975], “Air Injection to Avoid Cavitation Erosion in Propeller Ducts”, Ship Res. Inst. of Norway, Rep. R-49.7S.
- Huse, E. [1976], “Air Injection to Avoid Cavitation Erosion in Propeller Ducts”, Norwegian Maritime Research, No. 1.
- Iwai, Y., Okada, T. and Tanaka, S. (1989], “A Study of Cavitation Bubble CoIIapse Pressures and Erosion ParL 2: Estimation of Erosion from the Distribution of Bubble Collapse Pressures”, Wear, Vol. 133.
- Japanese Electric Engineering Society [1981], “Research Report on erosion cavitation and corrosion of turbines and pump turbines”, Japan, Tech. Rep. 113, Part 2.
- Kato, H., Ye, Y. P. and Maeda, M. [1989], “Cavitation Erosion and Noise Study on a Foil Section”, Proc. ASME In/I. Symp. on Cavitation Noise and Erosion in Fluid Systems, (R. E. A. Arndt, M. L. Billet and W. K. Blake, eds.), FED-Vol. 88.
- Kawai, H. [1969], Japan J. Appl. Phys., Vol. 8.
- Lauterborn, W. and Bolle, H. (1975], “Experimental Investigations of Cavitation-Bubble Collapse in the Neighborhood of a Solid Boundary”, J. Fluid Mech., Vol. 72, Part 2.
- Le, Q., Franc, J. P. and Michel, J. M. (1993a], “Partial Cavities: Global Behavior and Mean Pressure Distribution”, J. Fluids Eng., Vol. US, No.2, June.
- Le, Q., Franc, J. P. and Michel, J. M. 11993bj, “Partial Cavities: Pressure Pulse Distribution around Cavity Closure”, 1. Fluids Eng., Vol. 115, No.2, June.
- Maines, B. H. and Arndt, R.E.A. 119931, “Viscous Effects on Tip Vortex Cavitation”, Proc. ASME IntI. Symp. 011 Bubble Noise and Cavitation Erosion in Fluid System, Winter Annual Meeting, December.
- van der Meulen, J. H. J. and van Renesse, R. L. [1993], “The Collapse of Laser Produced Bubbles Near a Solid Boundary and the Generation of Pressure Pulses”, Cavitation and Multipfwse Flow Forum, ASME, FED-Vol. 153.
- Mousson, J. M. [1937], “Pitting Resistance of Metals under Cavitating Conditions”, Trans. ASME, 59, pp. 399-408. .
- Mousson, J. M. 11942], “Cavitation Problems and Their Effects upon the Design of Hydraulic Turbines”, Proc. Second Hydraulics Con}:, Slale Univ. of Iowa, Bull. 27, June.
- Narita et al. [1977], “Investigations of the Dueled Propeller Cavitation and Duct Erosion Prevention by the Air Injection System”, Det orske Veritas Symp. on Hydrodyn. of Ship and Offshore Propulsion Systems, Oslo.
- N’guyen The, M., Franc, J. P. and Michel, J. M. [1987], “On Correlating Pitting Rate and Pressure Peak Measurements in Cavitating Flows”, Proc. ASME Inti. Symp. on Cavitation Research Facilities and Techniques, Boston, December.
- Okada, T., Iwai, Y. and Awazu, K. [19891, “A Study of Cavitation Bubble Collapse Pressures and Erosion Pan 1: A Method for Measurement of Collapse Pressures”, Wear, Vol. 133.
- Okamoto ct aI. [1975], “Cavitation Study bf Ducted Propellers on Large Ships”, Trans. SNAME,83.
- Prosperetli, A, Lu, N. Q. and Kim, H. S. [1993], “Active and Passive Acoustic Behavior of Bubble Clouds at the Ocean’s Surface”, J. Acoust. Soc. Am., 93, No.6, June.
- Quang, L., Franc, J. P. and Michel, J. M. [1989], “Pressure Pulse Distribution Around Cavity Closure”, Proc. ASME IntI. Symp. on Cavilation Noise and Erosion in Fluid Systems (R. E. A Arndt, M. L. Billet and W. K. Blake, eds.). FED-Vol. 88.
- Rasmussen, R. E. H. [19491. “Experiments on Flow with Cavitation in Water Mixed with Air”, Trans. Danish Acad. Tech. Sc., No.1.
- Rasmussen, R. E. H. [1956], “Some Experiments on Cavitation Erosion in Water Mixed with Air”; Proc. 1955 NPL Symp. on Cavitation in Hydrodynamics, HMSO, London, Paper No. 20:
- Rayleigh. Lord [1917], “On the Pressure Developed in a Liquid During the Collapse of a Spherical Cavity”. Phil. Mag. 34, August.
- Sevik, M. and Park. S. H. [1973], “The Splitting of Drops and Bubbles by Turbulent Fluid Flow”. J. Fluids Eng. Vol. 95. March.
- Shanahan, T. B. and Abbot, P. A 119931, “Acoustic Emission Cavitation Test at Kerckhoff 2 Powerhouse”, ORE IntI., Inc., Falmouth, MA, Accusonic Rep. No. FP22280-1.
- Silberman, E. [19571. “Production tif Bubbles by the Disintegration of Gas Jets in Liquid”, Proc. 5th Midwestern Con Fluid Mech. Univ. of Michigan. April.
- Simoneau. R., Avellan, F. and Kuhn de Chizelle. Y. 119891. “On Line Measurement of Cavitation Erosion Rate on a 2-D NACA Profile”. Proc. ASME Int. Symp. on Cavitation Noise and Erosion in Fluid Systems (R. E. A Arndt. M. L. Billet and W. K. Blake, eds.), FEDVol. 88.
- Stinebring, D. R., Arndt. R. E. A and HoIl. J. W. 11977], “Scaling of Cavitation Damage”, J. HydronaUlics, Vol. 11, No.3, July.
- Stinebring. D. R., Holl, J. W. and Arndt, R. E. A [1980], “Two Aspects of Cavitation Damage in the Incubation Zone: Scaling by Energy Considerations and Leading Edge Damage” J. Fluids Eng., Vol. 102, December.
- Thiruvengadam, A. [1971], HydronaUlics, Inc., Laurel. Maryland, Tech. Rep. 233-15.
- Tomita, Y. and Shima, A [1986], “Mechanisms of Impulsive Pressure Generation and Damage Pit Formation by Bubble Collapse”. J. Fluid Mech., Vol. 169.
- Vogel. A, Lauterborn, W. and Timm, R. [1989], “Optical and Acoustic Investigations of the Dynamics of Laser-Produced Cavitation Bubbles Near a Solid Boundary”, J. Fluid Mech., Vol. 206.
- van Wijngaarden, L. [1964], “On the Collective Collapse of a Large Number of CaviUltion
Bubbles in Water”, Proc. 11th In fl. Congress of Appl. Mech., Munich, Springer Verlag. - Yamaguchi; H., Tanaka, M. and Kaw, H. P991], “A Numerical Study on Mechanism of Vortex Generation Downstream of a Sheet Cavity on a Two-Dimensional Hydrofoil”, Cavifarion and MII/fipl/ase Flow Forum, ASME, FED-Vol. 109.
- Zhang, S., Duncan, J. H. and Chahine, G. L. [1992], “Simulation of the Final Stage of Bubble Collapse Near a Rigid Wall”, Cavitation and Multiphase Flow Forum, ASME, FED-Vol. 135.
![]()