Fuji Prescale® film is a modular film system that allows accurate measurement of contact pressure, and its ability to quantify intra-articular contact pressure has been validated in multiple previous studies15,17,18,31,43. Calibration studies were performed with use of a cross section of known area and with application of a known force so that the calculated pressure could be correlated with the intensity of staining. Specifically, the Fuji film was calibrated by ramping applied force and holding the force for two minutes at various set loads. The loading rate and the two-minute hold were selected to match our specimen test conditions. Fuji film packets were placed on a base, and force was applied through a 25.4-mm-diameter cylindrical punch. The hardened steel surfaces of the base and punch that were in contact with the Fuji film were smoothed by machining, lapping, and polishing. The calibration set loads ranged from 100 to 5700 N (calibration pressures, 0.2 to 11 MPa). The average load during the two-minute hold was used in the calibration. For the same set point, the average applied loads varied up to 5 N, and there was a commensurate variation in measured stain intensity. A calibration curve was generated from these data, and, with use of a custom program (MATLAB; The MathWorks, Natick, Massachusetts), the intensities of our experimental stains were converted to peak pressure values. Ambient temperature and humidity were recorded and kept constant throughout calibration and experimentation as recommended by the manufacturer. For our experiment, we used Prescale super-low-pressure (0.5 to 2.5-MPa) and low-pressure (2.5 to 10-MPa) film to measure the tibiofemoral contact pressures, which corresponded with the range of values reported in previous studies18,19,43-45. Contact area was measured with use of the Prescale super-low-pressure film, as the Prescale low-pressure film tended to underestimate contact area. The Fuji film packets were sized and shaped according to previously described average dimensions of the tibial plateau46. For image analysis, developed Fuji film was scanned with use of a Scanjet 5550c scanner (Hewlett-Packard, Palo Alto, California), with the images saved as 600 dpi (dots-per-inch) 8-bit black-andwhite images in TIFF (tagged image file format). The resolution of this system is 0.04 MPa with accuracy equivalent to that of commercially available systems (±7%)47. A custom MATLAB program was used to convert these images into quantitative pressure gradients and calculate the peak contact pressure and the contact area.
Kinematic Analysis
During specimen preparation, plastic registration blocks were rigidly fixed to the femur and tibia to allow measurement of joint kinematics to within 0.1° of rotation and 0.1 mm of translation, with use of a previously described method25. Following fixation of these blocks to the specimen, the knees were scanned with computed tomography with use of 1-mm-thick slices. The computed tomography data were used to define the relationship between the registration blocks and the osseous anatomy of the femur and tibia. Three-dimensional models were created by using an imaging analysis program (amira; Mercury Computer Systems, Chelmsford, Massachusetts) to extract the contours of the bones and registration blocks from the computed tomography data. These contours were then imported into a modeling program (Rapidform; INUS Technology, Seoul, South Korea), where they were used to create three-dimensional solid models. From these models, a coordinate system was calculated for each registration block on the basis of cross products of the normals to three perpendicular faces of the block25. Coordinate systems for the femur and tibia were calculated on the basis of the anatomic knee coordinate system described by Grood and Suntay48. A custom program was developed in Mathematica (Wolfram Research, Champaign, Illinois) to calculate a transformation from the coordinate system of the registration blocks to the anatomic coordinate system and allowed for quantitative, anatomic description of knee kinematics according to the system of Grood and Suntay.
Kinematic data were collected simultaneously with contact pressure data for each meniscal condition and flexion angle. A MicroScribe 3DX articulated, digitizing robotic arm (Immersion, San Jose, California) was used to record the positions of the three perpendicular faces of the registration blocks that were used to develop the coordinate system described above for each condition and flexion angle. With use of the previously calculated transformations described above, the relative motion of the registration blocks obtained from the experimental data was converted to the relative motion of the femur and tibia in the anatomic knee coordinate system of Grood and Suntay48. Motion of the tibia relative to the femur is reported as internal/external rotation, varus/valgus angulation, anterior/posterior translation, and medial/lateral translation.
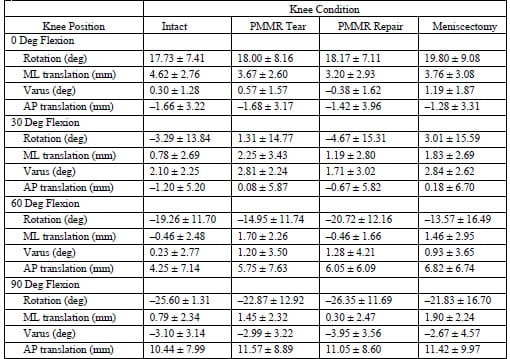
*The data shown represent the mean absolute position according to the system of Grood and Suntay48 and the standard deviation. Rotation is in degrees, with positive numbers representing external rotation. ML translation = medial/lateral tibial translation, in millimeters, with positive values representing lateral translation. Varus is in degrees, with positive values representing varus. AP translation = anterior/posterior translation, in millimeters, with positive values representing anterior translation. PMMR = posterior root of the medial meniscus.
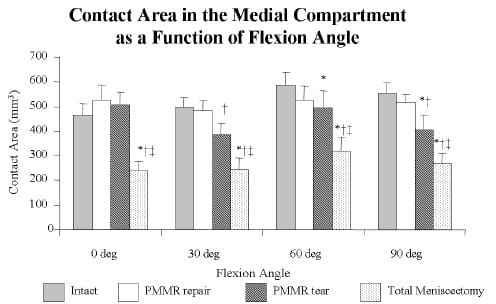
Fig. E-1: Effect of the meniscal condition on contact area in the medial compartment as a function of the flexion angle. The error bars indicate the standard error of the mean. *P < 0.05 compared with the intact condition. †P < 0.05 compared with the repair of the posterior root of the medial meniscus (PMMR). ‡P < 0.05 compared with the tear of the posterior root of the medial meniscus.
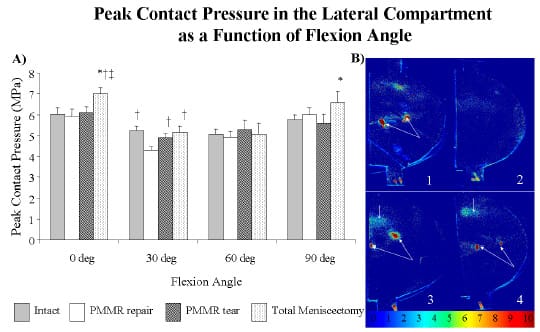
Fig. E-2: A: Effect of the meniscal condition on peak contact pressure in the lateral compartment as a function of the flexion angle. The error bars indicate the standard error of the mean. *P < 0.05 compared with the intact condition. †P < 0.05 compared with the repair of the posterior root of the medial meniscus (PMMR). ‡P < 0.05 compared with the tear of the
posterior root of the medial meniscus. B: Representative Fuji-film pressure distributions. The closed double arrows point to marking pins. The open arrows point to increased pressure at the lateral tibial spine. 1 = intact condition, 2 = repair of the posterior root of the medial meniscus, 3 = tear of the posterior root of the medial meniscus, 4 = total meniscectomy. The color scale at the bottom shows values representing megapascals.
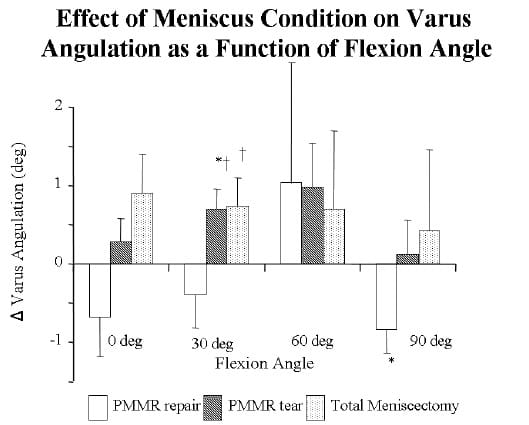
Fig. E-3: Change in knee varus angulation, as compared with that of the intact knee, as a function of the flexion angle. The error bars represent the standard error of the mean. Positive values indicate varus angulation. *P < 0.05 compared with the intact condition. †P < 0.05 compared with the repair of the posterior root of the medial meniscus (PMMR).
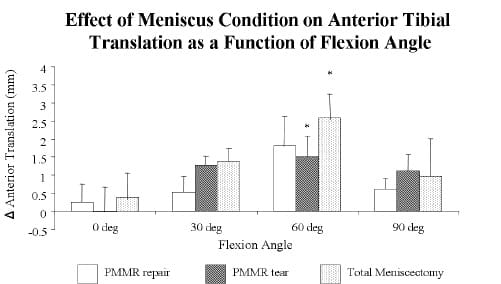
Fig. E-4: Change in anterior tibial translation, as compared with that of the intact knee, as a function of the flexion angle. The error bars represent the standard error of the mean. Positive values indicate anterior translation. *P < 0.05 compared with the intact condition. PMMR= posterior root of the medial meniscus.
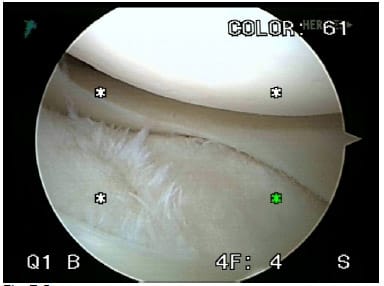
Fig. E-5: Arthroscopic photograph of the lateral compartment of the knee of a patient with a posterior root tear of the medial meniscus. Note the normal lateral meniscus and Outerbridge grade 3 (of 4) chondrosis (fissuring of articular cartilage) over the tibial spine.