Article
Related Links
Francesco AYMERICH**, Massimiliano PAU** and Francesco GINESU**
Analysis of contact interfaces represents one of the most critical engineering problems and involves a huge number of practical applications such as roller bearings, tooth gears, wheel-rail interaction, electrical and thermal couplings, biomechanics etc. While theoretical and numerical approaches to the problem have been extensively studied over the years, only a few experimental techniques have been devised either to validate analytical results, or to infer information non invasively about the state of contact. From the late 1950s onwards, when a relationship was discovered between the amount of energy reflected or transmitted through the contact region and the charac· teristics of contact, researchers have been employing ultrasonic waves to inspect contact interfaces. Since then, many efforts have been directed towards improving the experimental technique and enhancing the theoretical understanding of ultrasonic waves propagation over an incomplete contact interface. In the light of these consider· ations, the application of a simple ‘pulse-echo’ technique able to investigate the elastoplastic contact of a steel sphere-plate system is proposed in this paper. The main purpose of the analysis is to assess the reliability of the ultrasonic method as a useful tool for assessing a number of contact parameters such as size and shape of contact area, distribution of contact pressure and so on. Experimental data were compared with numerical results obtained using a Finite Element Model (FEM) code. Ultrasonic reflection data were in· good agreement with calculated values, thus confirming the effectiveness of the ultrasonic technique as a fast, reliable and noninvasive method in evaluating contact parameters in loaded metallic interfaces.
Keywords: Contact Area, Ultrasonic Techniques, Finite Element Method
1. Introduction, Theoretical Background and Objectives of The Study
The first attempt at applying ultrasonic wavebased techniques to study contact problems, dating back to 1958, was by Krachter(1), who, by analysing variations in ultrasonic reflection from a loaded interface, discovered that the decrease in the echo reflected by the contact region could be related to the applied load. About ten years later, two independent researches conducted by Masuko and Ito (2) and Kendall and Tabor(3), confirmed Krachter’s results and tried to explain for the first time the mechanisms of interaction between ultrasonic waves and contact interfaces under increasing loads.
In particular, Masuko and Ito focused their attention on the influence of surface conditions (i.e. average roughness), highlighting that if the applied load did not change, a better level of surface finishing increased the amount of ultrasonic energy transmitted through the interface. On the other hand, Kendall and Tabor introduced the concept of contact stiffness as a parameter able to describe the state of contact at the interface, and formulated an analytical relationship relating sound transmission to stiffness of the contact interface.
In both studies, a fundamental concept was clarified: when real engineering surfaces are pressed together, the roughness of the materials leads to ‘incomplete’ contact interfaces, characterised by an alternation of cavities (where only air is present) and parts where superficial microasperities touch each other. If we consider a homogeneous contact interface (i.e. steel-steel) as often occurs in many practical cases, the analysis of the ultrasonic reflection shows that:
1. At points where the contact of micro asperities occurs, the acoustic impedance is assigned the same value, and thus R=O (which means complete transmission of ultrasonic waves).
2. In the cavities, the interface is ‘solid-air’ and thus, since the acoustic impedance of a gas is negligible compared to that of a solid, R ~ 1 (which leads to an almost complete reflection) .
In other words, while locally the coefficient of reflection can take only two values (0 or 1), for the whole interface it varies over the range O ≤ < R < 1. The value of R, which is governed by the number and size of micro-contacts caused by external pressure over the surface asperities, asymptotically reaches the null value (perfect contact) when very high pressure is applied (some GPa of magnitude in metals). This makes it possible, at least in principle, to assess the contact state of this kind of interface by simply analysing the variations of the ultrasonic reflection changing the external load.
1.1 Modelling the interaction of ultrasonic waves with incomplete interfaces
Over the last 30 years a number of models have been developed in order. to better clarify the mechanism of interaction of ultrasonic waves with an incomplete interface, but also for the primary purpose of predicting the characteristics of the interface when increasing external loads are applied. Specifically, this means determining a number of contact parameters useful in tribological studies such as:
a) nominal contact area
b) contact pressure
c) real contact area
d) contact stiffness
In 1973, Tattersall(4) provided the first known mathematical model of the propagation of ultrasonic waves through an incomplete interfac.e by modelling it as a weightless spring layer, characterised by a stiffness representing the state of contact between the two bodies. The coefficient of reflection in the Tattersall model is expressed by the following equation:
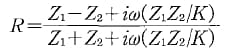
where Z1 and Z2 are the acoustic impedances of the two media, K is contact stiffness and ω the frequency of the ultrasonic wave.
If the spring is infinitely rigid (K = ∞), the expression becomes the well known formula which holds for the ideal case of perfect adhesion:
On the contrary, if K = 0 (i.e. the springs are infinitely compliant) there is no connection between the two parts and the reflection is complete (R =1). The intermediate state, with the reflection coefficient lying in the range O < R < l, represents all possible conditions for a loaded incomplete interface, and this makes monitoring of ultrasonic reflection a practical tool in characterizing a contact interface.
In 1980, Haines(5) tried to take into account in a more direct way the influence of surface roughness on interaction of ultrasonic waves with stressed
interfaces, and developed a model in which the reflection is expressed by the relationship:
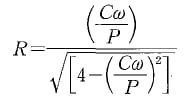
where P is the contact pressure, ω is the frequency of the incident wave and C a constant involving acoustic impedance, physical properties of the contacting materials and the mean radius of the ‘contact islands’ created by the touching micro asperities presumed to have circular shape.
This model (in a qualitative form) was later applied by Rehbein et a1.(6) to calculate the stress interface in a Ni-Ti tubing interface. The authors report fairly good agreement between theoretical predictions and experimental data.
Nagy(7) critically reviewed the Haines model, and proposed a simple but effective approach that, on the basis of ultrasonic reflection measurements, allows to determine the ratio between the normal and transverse interfacial stiffness, which was found to be useful for classifying the level of interface imperfection.
A few years later, Baik and Thompson(8) formulated a ‘quasi-static model’ (QSM) for ultrasonic reflection and transmission at imperfect interfaces. They represented the interfaces as a layer of distributed springs, thus pursuing Tattersall’s approach, but extended and tested the model for a substantial number of practical situations (periodic arrays of strip contacts and cracks, low density distribution of penny shaped cracks and inclusions, low density distribution of elliptical contacts and ellipsoidal inclusions) and for material with interface having two different sides. Comparison of the model predictions with exact solutions for two simple cases showed good accuracy at low frequencies.
In 1989, Krolikowski et al.(9) proposed a ‘spring layer’ approach, but they also took into account the dissipative effect of viscous friction (due to the transformation of the spring motion into heat) and a parameter called ‘reradiation damping’ related to the emission of acoustic radiation by the vibrating springs. By applying hydrostatic pressure up· to 1 GPa to plane steel specimen and varying the frequency of the incident wave, they obtained a number of experimental relationships between the ultrasonic reflection and the applied pressure to be fitted in the original model. The values of contact stiffness derived indirectly from both the model and the measurements, were found to be in good agreement with earlier experiments.
A simplified approach was proposed by the same authors in 1991(10),(11), neglecting the term related to the reradiation damping, in order to calculate parameters such as real contact area and contact stiffness from simple reflection measurements recorded at different frequencies (in the 10 – 90 MHz range). Comparison of experimental results with the most widely used tribological models of contact between rough surfaces (Greenwood-Williamson, WhitehouseArchard- Onions, Bush-Gibson – Thomas) revealed substantial agreement for both parameters, particularly for the BGT model which the authors judged to be the most capable of reproducing the physical reality of the contact between rough surfaces.
1.2 Objectives
While most of the models described above are directed, to some extent, towards explaining the interaction between the ultrasonic reflection and the geometrical features of imperfect interfaces (i.e. type and geometry of the microasperities or ‘islands’ produced by their contact) the output of such calculations is often a measure of reflection (for a given type of interface) or contact stiffness.
Although these approaches are to be thought of as fundamental, the resulting theoretical models have so far been unable to determine contact pressure level existing in a certain interface starting from a single reflection value, a procedure that could be of great help for analysing many engineering phenomena. Were this feasible, it would be possible to describe the contact pressure distribution produced by coupling two surfaces of unknown geometry, or after alteration of known geometries due to wear, surface fatigue etc, with a single frequency measurement.
The above considerations have prompted the search for novel experimental approaches to the study of engineering phenomena that exploit the ultrasonic reflection properties, so as to easily obtain information about the contact pressure in a given contact area from simple amplitude measurements.
Here a simple ‘pulse-echo’ technique is proposed which, based on reflection measurements on a stressed interface, allows to calculate the contact pressure distribution on a ‘point-by-point’ basis. At the same time, the technique strongly reduces, with the aid of a numerical deconvolution procedure, the error introduced into this estimation by the finite size of the sound beam.
2. Materials and Methods
As previously mentioned, the main purpose of this study is the assessment of contact pressure and, consequently, of the nominal contact area, being the two parameters strongly connected (e.g. where the contact pressure is null, surely there is no contact between the parts).
In particular, estimation of the nominal contact area requires a simple discrimination between points where the reflection coefficient is equal to one, and points in which the reflection is lower than a unit: the second group is to be considered part of the contact area.
Although ultrasonic assessment of contact pressure has been experimentally investigated by several authors(12)-(23), no general relationship between contact pressure and ultrasonic reflection coefficient is available at this time.
This is due to the large number of parameters affecting the phenomenon, as frequency of the incident wave, surface roughness, material type, presence of solid or liquid contaminants and so on, It thus appears that the simplest way to obtain a pressure value from a reflection measure is from a test on a known distribution pressure in order to build a reference curve experimentally. In this case, by keeping the above mentioned variables unchanged, a ‘pressure-reflection coefficient’ curve can be obtained, and all subsequent measures on an unknown contact geometry can easily be transformed into contact pressure values.
One possible way to assess the accuracy of contact pressure distribution with ultrasounds is to perform a numerical analysis (with a Finite Element analysis for example) so as to obtain pressure value distributions that can be compared with ultrasonic results.
This comparison was carried out, as is described later, by experimentally characterizing the beam profile of the probe at the focal plane and applying a deconvolution procedure to the reflection map acquired for a given applied load.
2.1 Experimental setup
The essential parts of the experimental setup are:
- a personal computer
- a Krautkramer HIS2 flaw detector connected via proprietary interface to the PC
- a 500 MHz Hewlett-Packard 54520A digital oscilloscope
- a three dimensional scanning system (precision 0.025mm)
- a 10 MHz longitudinal immersion probe (lead metaniobate, spherically focused, 2.5″ focal length)
- Control software (in-house “home-made”, developed in a ‘Lab View’ environment).
A schematic diagram of the connections is shown in Fig. 1.
The contact interface to be tested was assembled by lising a steel sphere (AISI 52100,44 mm diameter) – of the type commonly used in roller bearings – pressed against a stainless steel plate (AISI 304, 220 mm diameter, 9 mm thickness) which is also the bottom of a tank acting as the container for the coupling media (water in this case) :
both specimens presented a very smooth surface, with an average roughness of about 0.1 &um;m.
To assess the probe features, the ASTM E1065 test was performed, using the ‘ball target’ method with a steel sphere of 1.5 mm diameter (which corresponds to ten times the wavelength in water). As a result of the test, the plot shown in Fig. 2 was obtained, in which we can see the profile of sound pressure along a cross section (as measured at the distance giving the maximum .amplitude of the reflected signal) : the beam diameter at – 6dB drop is 1.05 mm.
Since this condition is not actually the same of the experimental tests, for which the sound path is partly in water and partly in steel, further calibration analyses were performed. This step was necessary to verify how the shape of the sound beam modifies when refraction effects at the ‘water-steel’ interface are introduced.
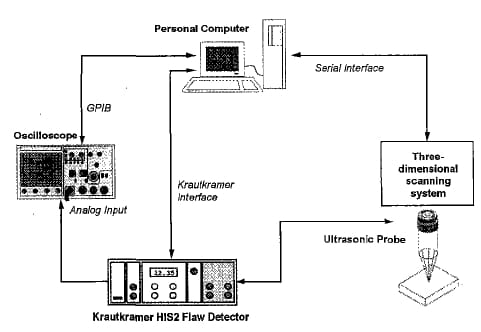
Fig. 1 Schematic representation of the ultrasonic equipment
To this aim, a 0.5 mm diameter flat-bottom hole placed under a steel thickness equal to the final specimens (calibration block by PhTool Inc., USA) was scanned. The comparison of the cross profiles obtained after these series of experiments with those previously obtained by the ASTM tests, revealed slightly noticeable differences, thus confirming the correctness of the use of the ASTM sound pressure profile in the subsequent elaborations.
The probe could be moved inside the container by means of the scanning system over a 8 X 8 mm region with 0.1 mm steps.
The load applied to the contacting elements was gradually increased by means of a hydraulic jack from o up to 10 000 N in steps of 250, 500 and 1 000 N according to the load level. The value was controlled with a HBM load cell interposed between the jack and the sphere, as shown in Fig. 3.
During the test, the values of the reflection coefficient were continuously acquired and stored in matrices so as to build a ‘contact map’ containing information about interface contact conditions. The reflection coefficient; at each measured point was defined by calculating the ratio of the amplitude Hi of the echo as reflected by the contact interface while a certain load was applied to the amplitude of the echo reflected by the surface of the tank in a zone surely not in contact (the reference echo called Ho). Thus we have:

An example of a contact map is illustrated in Fig. 4. The size and shape of nominal contact area obtained by means of the ultrasonic analysis were also compared with those obtained by interposing a pressure sensitive film between the two contacting bodies (Fuji Prescale HS). This film consisted of a layer of liquid-filled bubbles, interposed between two paper sheets: as the applied pressure increases, more bubbles are broken, thus producing a red stain whose intensity is related to contact pressure. The impressed paper was digitized with a 2 400dpi optical scanner and the images thus obtained were analyzed to measure the contact patch parameters.
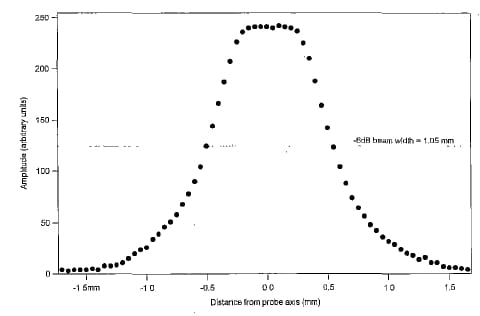
Fig. 2 Cross-axial profile of the 10 MHz focused probe employed in the experimental tests
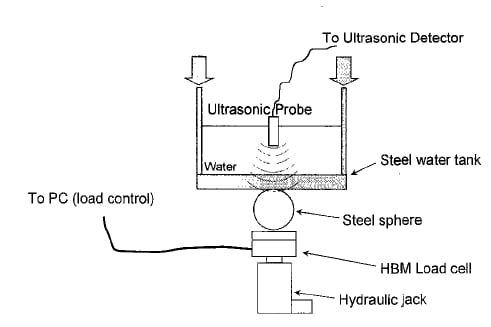
Fig. 3 Position of the contacting elements inside the load system
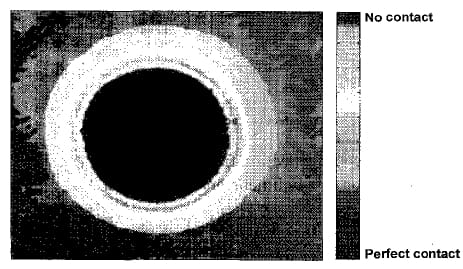
Fig. 4 Graphical processing of the ultrasonic reflection data for a load of 10000 N
3. FEM Model
To assess the reliability of the ultrasonic method in reproducing the pressure distribution over the contact area, and since the contact problem is elastoplastic in nature, a FEM model was used to obtain the values of contact pressure to be compared with the experimental results. The numerical analysis was performed with the commercial code ANSYS, modelling the geometry of the system as illustrated in Fig. 5.
Due to the very small average roughness value of the contacting elements (0.1 J-Lm), both components were modelled as perfectly smooth solids. This simplification does not alter the relevance of the numerical analysis, since the actual combination of applied loads and surface roughness of the tested elements, led to classify the studied case within the so called ‘high-load regime’, that was defined by Greenwood and Tripp(24) (and further investigated by Thomas(25),(26) as the condition for which the influence of surface roughness on nominal contact area size is hardly noticeable.
The plate was considered perfectly fixed all over the boundary, while the load application was simulated by imposing a rigid displacement of the diametrical plane of the sphere in the y direction.
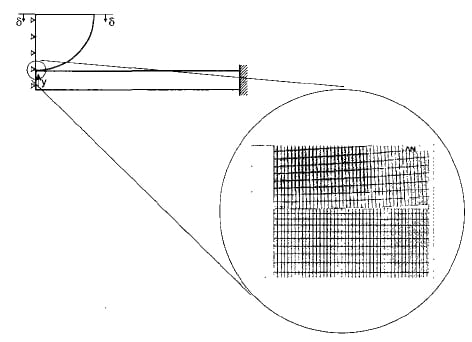
Fig. 5 Finite element model of the sphere-plate contact: on the right a detail of the mesh in the contact zone is visible
Since the problem is axialsymmetric, it is possible to study the behaviour of an axial plane of the system by means of plane elements with axialsymmetric formulation, imposing the symmetry condition on the y axis. The plastic behaviour of the plate material was reproduced by using the kinematic work hardening option, defined by means of a yield stress of 225 MPa and a tangential modulus equal to 10% of the elastic one (as obtained by tension tests), while the sphere material was characterized by a yield stress of 1980 MPa.
The contact, which was supposed frictionless, was modelled with 2D ‘surface to surface’ contact pair elements; at the end of the calculations, the size of the contact area was obtained by verifying the status of contact elements in the possible interaction region while the pressure distribution was reconstructed by extracting the pressure at each single node on the contact area. The final mesh (as shown in the magnification in Fig, 5) was built with elements of 0.025 mm size on the contact zone,
4. Results and Discussion
Ultrasonic reflection data obtained by scanning the probe over the sphere-plate contact area are plotted in Fig. 6 for three levels of load. As expected, reflection data exhibit a regular axialsymmetric shape with a decrease of the ultrasonic reflection from the centre (the most loaded region) towards the edges.
A cross-axial profile of the ultrasonic reflection as measured along a diameter of the contact circle is shown in Fig. 7: by observing the trend of data with increasing loads, it is noticeable that, starting from a load of about 3 000 N, the reflection attains a practically constant value at the centre of the contact area, while the only effect of further load increases is growth of the contact area.
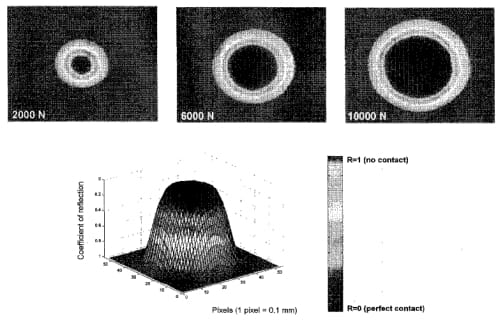
Fig. 6 Two and three-dimensional representations of the ultrasonic reflection from the contact interface (applied loads of 2 000, 6 000 and 10 000 N for the bidimensional maps and 10 000 N for the three-dimensional plot)
Since, as already mentioned, a physical relationship exists between the ultrasonic reflection coefficient and pressure, in principle it is easy to correlate ultrasonically obtained quantities with pressure values at the contact interface between the two surfaces.
The pro
cedure is quite simple: by measuring the reflection in a contact interface where a known pressure distribution is applied, pairs of ‘pressurereflection coefficient’ values can be obtained.
Applying this kind of relationship to another contact case, the pressure at a certain point is easily obtained by measuring the value of reflection.
Obviously, the value of the reflection coefficient is greatly influenced by a number of factors (e.g. wave frequency, acoustic impedance of materials, roughness) so all these characteristics must be kept unchanged to obtain reproducible results.
In this study, a calibration was carried out on a simple ‘plane vs plane’ contact(27) obtained by pressing the base of a cylindrical steel specimen (diameter and height 4 mm) against a cylindrical steel plate (250 mm diameter, 10 mm height). The corners of the cylinder were rounded to avoid large stress concentration at the edges of the contact area(28) thus allowing to detect the ultrasonic reflection in the central region where the contact pressure is practically constant. Before the experiments, both the contacting surfaces were carefully treated to ensure a degree of roughness equal to the steel and sphere (0.1 &um;m).
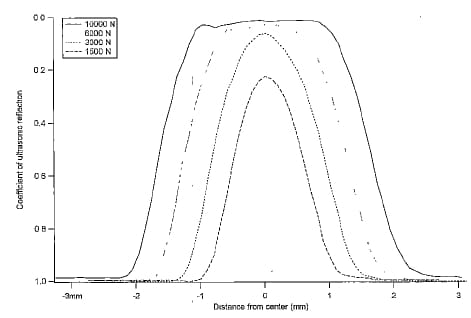
Fig. 7 Trend of the ultrasonic reflection along a diameter of the contact circle for some levels of load
In this way all parameters that potentially influence the ultrasonic reflection are kept fixed, the only variable being external load; the external load was increased in such a way to test uniform contact pressures in the range a – 900 MPa, which can be considered suitable for the subsequent sphere-plate tests.
By means of this procedure a calibration curve was created (Fig. S), in which the coefficient of reflection is related to a known pressure value. After this step, by processing (with the free image analysis software ‘Scion Image’) images extracted from the sphere-plate ultrasonic analysis with the calibration curve, it was possible to transform the ‘reflection’ map into a ‘pressure’ map.
It is also noticeable that similar ‘reflection-pressure’ relationships were obtained by Krolikowski and coworkers in Refs. ( 9 ) – (11).
However, due to the finite focal size of the transducer, the recorded reflection is not a reliable representation of the real ‘point to point’ pressure distribution, since the sound beam illuminates non-uniform pressure regions and the probe exhibits a variable sensitivity across the focal region. The final effect is a blurred view of the real reflection distribution and thus of the pressure over the contact area(29).
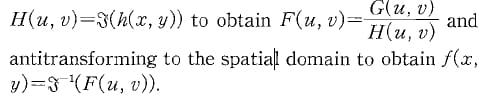
To correct this smoothing effect, a simple disc theory was adopted to predict the reflection coefficient on a point-by-point basis, by simulating the ultrasonic response at the contact interface as the convolution of the ultrasonic beam with the matrix representing the reflection values on the contact plane; matrix f(x, y), which represents the unknown reflection coefficients at single points of the contact interface, could then be obtained by deconvolving matrix g(x, y) of the ultrasonically acquired reflection values with the matrix representing the sound pressure emitted by the probe on the focal plane (h(x, y), as obtained with the ASTM 1065E test). This was performed by transforming matrices g and h (128 X 128 points in our analysis) to the frequency domain, dividing the Fouriertransformed complex matrix:
However, this simple procedure is often affected by large errors, because regions of the H matrix with small values tend to amplify any noise component in the G image. To overcome this difficulty a small weighting factor’ k was added, so that:
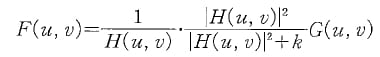
The value of k was chosen by an iteration procedure, comparing the convolution of h(x, y) with f(x, y) and the experimentally obtained g(x, y) matrix until an error smaller than 5% was obtained at any measured point.
An example of the results obtained with this procedure is shown in Fig. 9 where a three-dimensional representation with a cut-away view of the reflection coefficient on the contact area are shown for a 6 000 N load.
A comparison between the experimental reflection values calculated by the deconvolution scheme and the reflection coefficients as deduced by numerical FEM analysis is shown in Fig. 10 for loads ranging between 500 and 10000 N. The theoretical reflection coefficients were obtained by applying to the FEM pressure profiles the pressure-reflection calibration deduced from the tests on contact between plane interfaces.
We note satisfactory agreement between experimental and model results for load levels above 3 000 N for which the general trend is correctly described with a flat top region around the axis of the sphere-plate interface and a steep drop to zero on approaching the edge of the contact area. In this region, and also for low load levels, probably because of diffraction effects at the contact boundary, the technique does not appear to be able to follow the abrupt variations of the reflection coefficient accurately. As a further comparison, Fig. II shows the good agreement existing between the diametric size of the contact area calculated by the ultrasonic procedure and that obtained by the FEM analysis (Fig. 10, bottom) and by the use of the pressure sensitive film (Fig. 10, top).
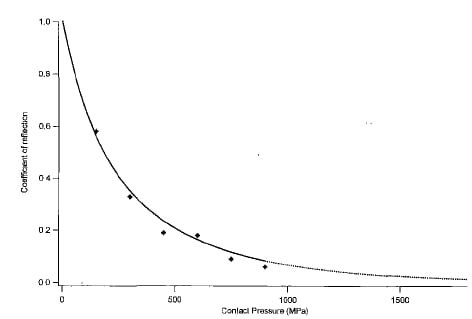
Fig. 8 Calibration curve obtained from the simple ‘plane vs. plane’ contact
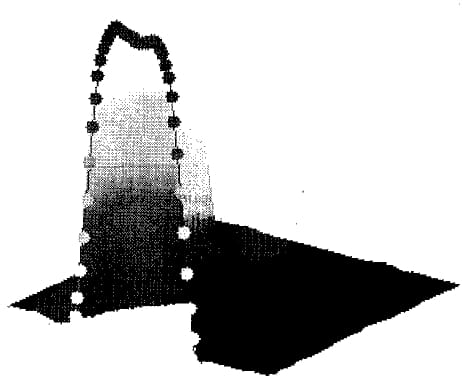
Fig. 9 3D view and cross-axial profile of a reflection map for a 10 000 N load
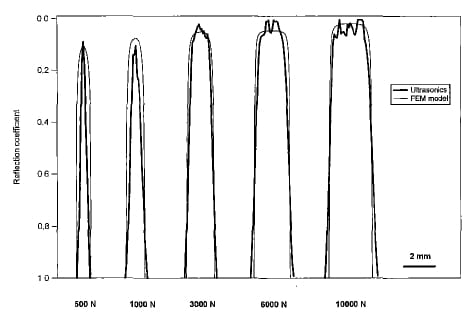
Fig. 10 Cross-axial profiles of reflection on the contact area: comparison between ultrasonic and FEM results
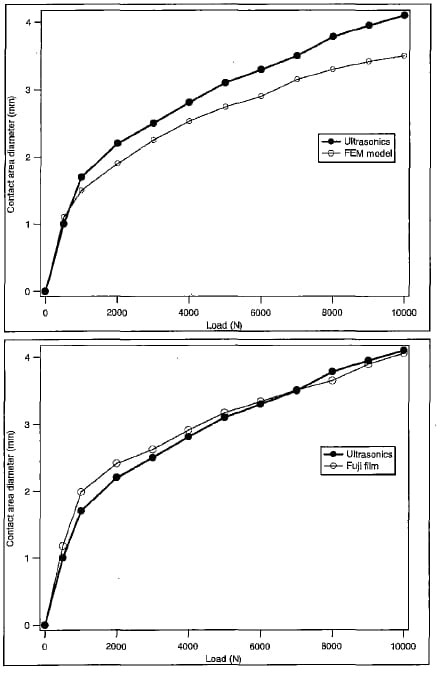
Fig. 11 Contact size vs applied load: comparison between ultrasonic results and FEM model data (top) or Fuji film data (bottom)
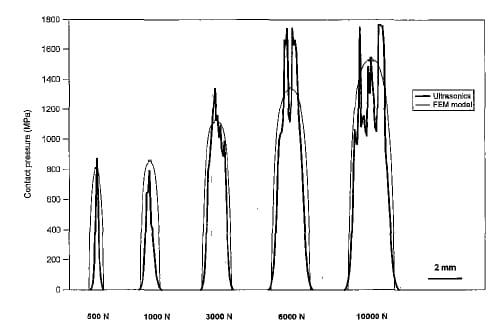
Fig. 12 Cross-axial profiles of pressure on the contact area: comparison between ultrasonic and FEM results
Since the reflection-pressure relationship is known, it is also possible to compare ultrasonically inferred pressures and FEM results (Fig. 12) ; in this case, however, since the reflection-pressure trend is very flat at high pressures, even small noise components in reflection values determine much oscillation at pressures higher than about 800 MFa; for this reason, the proposed technique does not appear capable of providing reliable results for reflection coefficients lower than approximately 0.1 – 0.15.
5. Conclusions
Ultrasonic techniques have been used in the past to characterize contact parameters such as contact area and stiffness at the interface between two surfaces. An ultrasonic procedure has been developed which allows the non-destructive and non-invasive obtaining of a point-by-point measurement of the reflection coefficient and contact pressure by means of a simple deconvolution analysis which take into
account the real profile of the sound beam. The measured contact areas and reflection coefficients showed a good agreement with FEM model results, at least for contact areas larger than 1 mm in diameter. The technique can also be reliably adopted to evaluate contact pressure as long as pressure values are lower than about 800 MFa,’ due to the flat trend of the reflection-pressure curve for high pressures levels.
References
- Krachter, H., Ein Neuartiges Verfahren zur Messung von Druckkraften mit Ultraschall, Werkstatt und Betrieb, 5 (1958), pp. 246-248.
- Masuko, M. and Ito, Y., Measurement of Contact Pressure by Means of Ultrasonic Waves, Annals of the CIRP XVII, (1969), pp.289-296.
- Kendall, K. and Tabor, D., An Ultrasonic Study of the Area of Contact between Stationary and Sliding Surfaces, Proc. of Royal Society of London Part A 323, (1971), pp. 321-340.
- Tattersall, H.G., The Ultrasonic Pulse-echo Technique as Applied to Adhesion Testing, J oumal of Physics Part D: Applied Physics, Vol. 6 (1973), pp. 819-832.
- Haines, N.F., The Theory of Sound Transmission and Reflection at Contacting Surfaces, Central Electricity Generating Board Reports, (1980), RD/B/N4744.
- Rehbein, D.K., Skillings, B.J., Smith, IF. and Thompson, D.O., Ultrasonic Reflection from a Stressed Interface, Journal of Nondestructive Evaluation, Vol. 4, No.1 (1984), pp. 3-12.
- Nagy, P.B., Ultrasonic Classification of Imperfect Interfaces, Journal of Nondestructive Evaluation, Vol. ll, Nos. 3/4 (1992), pp. 127-139.
- Baik, l and Thompson, R.B., Ultrasonic Scattering from Imperfect Interfaces: A Quasi-static Model, Journal of Nondestructive Evaluation, Vol. 4 (1984), pp. 177-196.
- Krolikowski, J., Szczepek, l and Witczak, Z., Ultrasonic Investigation of Contact between Solids under High Hydrostatic Pressure, Ultrasonics, Vol. 27 (1989), pp.45-49.
- Krolikowski, land Szczepek, J., Prediction of Contact Parameters Using Ultrasonic Method, Wear, 148 (1991), pp. 181-195.
- Krolikowski, l and Pilecki, S., Reflection of Longitudinal Ultrasonic Waves by the Interface of Two Solids, Journal of Technical Physics, 32 (1992), pp.225-240.
- Drinkwater, B.W., Dwyer-Joyce, R.S. and Cawley, P., A Study of Interaction between Ultrasound and a Partially Contacting Solid-solid Interface, Proc. of Royal Society of London Part A, Vol. 452 (1996), pp. 2613-2628.
- Drinkwater, B.W., Dwyer-Joyce, R.S. and Cawley, P., A Study of the Transmission of Ultrasound across Solid-rubber Interfaces, Journal of Acoustical Society of America, Vol. 101, No.2 (1997), pp. 970-981.
- Margetan, F.J., Thompson, R.B., Rose, lH. and Gray, T.A., The Interaction of Ultrasound with Imperfect Interfaces: Experimental Studies of Model Structures, Journal of Nondestructive Evaluation, Vol. II (1992), pp. 109-125.
- Ito, Y., Toyoda, l and Nagata, S., Interface Pressure Distribution in a Bolt-flange Assembly, Trans. AS ME l Mech. Des, Vol. 101 (1977) , pp.330-337.
- Wooldridge, A.B., The Effects of Compressive Stress on the Ultrasonic Response of Steel-steel Interfaces and of Fatigue Cracks, Central Electricity Generating Board Report No. NW /SSD/ RR/42/79 (1979).
- Arakawa, T., A Study on the Transmission and Reflection of an Ultrasonic Beam at Machined Surfaces Pressed against Each Other, Materials Evaluation, Vol. 41 (1983), pp. 714-719.
- Minakuchi, Y., Y oshimine, K., Koizumi, T. and Hagiwara, T., Contact Pressure Measurement by Means of Ultrasonic Waves (on a Method of Quantitative Measurement), Bulletin of JSME, Vol. 28 (1985), pp. 40-45.
- Bazhaluk, Y.M., Karpash, O.M., Migal, I.G. and Modnyi, O.G., Using Ultrasound for Inspecting the Contact Pressure at the Interface of Contacting Metallic Surfaces, Technical Diagnostics and Nondestructive Testing, Vol. 3 (1991), pp. 274- 276.
- Karpash, O.M. and Stepura, A. I. , Improved Accuracy in an Ultrasonic Method of Estimating Contact Pressures in Threaded Joints, Russian Journal of Nondestructive Testing, Vol. 29 (1993), pp.824-829.
- Sawa, T., Kumano, H. and Morohoshi, T., The Contact Stress in a Bolted Joint with a Threaded Bolt, Experimental Mechanics, Vol. 53 (1996) , pp.17-23.
- Dwyer-Joyce, R.S. and Drinkwater, B.W., Analysis of Contact Pressure Using Ultrasonic Reflection, Experimental Mechanics, Proceedings of the 11th International Conference on Experimental Mechanics, Balkema Rotterdam, (1998), pp.747-754.
- Oda, M., Kanomata, T. and Hara, T., Ultrasonic Technique for Contact Mechanism Estimation of an Artificial Hip Joint, JSME Int. l Ser. C, Vol. 42, No.3 (1999), pp. 560-567.
- Greenwood, lA. and Tripp, lH., The Elastic Contact of Rough Spheres, Journal of Applied Mechanics Trans. ASME 89 Part E, (1967) , pp. 153-159.
- Thomas, T.R., Calculation of Elastic Contact Stresses for Rough-curved Surfaces, ASLE Trans. Vol. 22 (1979), pp. 184-189.
- Thomas, T.R., Private communications, (2001).
- Pau, M., Aymerich, F. and Ginesu, F., Ultrasonic Measurements of Nominal Contact Area and Contact Pressure in a Wheel-rail System, Proceedings of I. Mech. E. Part F Journal of Rail and Rapid Transit 214 F4 (2000), pp. 231-244.
- Ciavarella, M., Indentation by Nominally Flat or Conical Indenters with Rounded Corners, International Journal of Solids and Structures, Vol. 36 (1999), pp.4149-4181.
- Hodgson, K., Dwyer-Joyce, R.S. and Drinkwater, B.W., Ultrasound as an Experimental Tool for Investigating Engineering Contacts, 9th Nordic Symposium on Tribology, NORDTRIB (2000) June 11-14, 2000, Porvoo, Finland.