Article
Related Links
JA Szivek1, VS Nandakumar1, CP Geffre1, and CP Townsend2
1 Orthopaedic Research Laboratory, Department of Orthopaedic Surgery, University of Arizona, Tucson, AZ
2 MicroStrain Inc, Williston, VT
Abstract
In vivo measurement of loads and pressures acting on articular cartilage in the knee joint during various activities and rehabilitative therapies following focal defect repair will provide a means of designing activities that encourage faster and more complete healing of focal defects.
It was the goal of this study to develop a totally portable monitoring system that could be used during various activities and allow continuous monitoring of forces acting on the knee. In order to make the monitoring system portable, a handheld computer with custom software, a USB powered miniature wireless receiver and a battery-powered coil were developed to replace a currently used computer, AC powered bench top receiver and power supply.
A Dell handheld running Windows Mobile operating system(OS) programmed using Labview was used to collect strain measurements. Measurements collected by the handheld based system connected to the miniature wireless receiver were compared with the measurements collected by a hardwired system and a computer based system during bench top testing and in vivo testing. The newly developed handheld based system had a maximum accuracy of 99% when compared to the computer based system.
1. Introduction
The accurate measurement of physiologic forces acting on the knee will facilitate better cartilage tissue engineering strategies and improve rehabilitation activities that will accelerate recovery following knee surgery. Various techniques have been used to determine forces acting on joints. However, none of them have provided direct measurements of physiological loads on tissues.
Mathematical modeling techniques utilized in conjunction with measurements have evaluated forces and moments acting across joints and tissues [1–9]. Forces have been predicted using joint dimensions, body weight and load configuration at the joints. Stresses and strains acting on the joints were calculated by utilizing the material properties and structural dimensions of the tissues. However, this approach is difficult since models are typically complex and mechanical properties of tissues may be poorly defined [10,11]. While mathematical modeling has the advantage of being applied more broadly, the assumptions about muscle action, direction and joint contact locations vary widely, resulting in potentially large errors in contact stresses and tissue strains.
Miller et al [12,13] determined the force acting on the knee in order to compare the effects of three types of prosthesis used as knee replacements during arthroplasty. Human cadaveric knee specimens were implanted with different types of prostheses using the appropriate surgical procedure. The specimens were placed in a test fixture and the forces acting on the joint were calculated based on the angles of knee flexion measured by an observer when the knees were subjected to different loading conditions. Although the forces calculated mathematically using these measurements produced errors as small as 1–2%, the main disadvantage of this method was that the measurements varied from one observer to another.
Benjamin et al [14] and Tanzer et al [15] measured forces acting on the knee to study the effects of components used in knee arthroplasty. These authors used the same experimental setup as Miller et al, but pressure measurements were directly recorded using a Fuji Prescale Film (Fuji Photo Film, Tokyo, Japan) instead of using angles estimated by an observer. The film was calibrated using the same loading and unloading conditions and exposing defined areas of the film to compressed air at a known pressure. The film impressions were digitized into gray level bitmaps (256 gray levels) using a flatbed scanner and analyzed using an image analysis software program. The overall accuracy of pressure and spatial measurements was estimated by Tanzer et al [15] to be ± 0.05 MPa and ± 0.1 mm respectively.
Kaufman et al [16] used a tibial prosthesis instrumented with force transducers to study tibiofemoral forces following total knee arthroplasty. The loads were applied normal to the tibial surface and were measured by each of the load cells contained in the transducer. The total compressive force was calculated by summing the forces measured by the individual transducers. A linear relationship between the actual and calculated load was obtained with an average error of 3.2% and a correlation of 99%. This device could not be used in vivo because of issues such as lack of biocompatibility, the inability to waterproof the electronics and insufficient durability of the device. In addition, it would only have provided loads acting on this particular implant design.
In vivo measurement techniques have utilized implants with strain gauges [17] or have used strain gauges directly attached to bone with transcutaneous wires [18,19]. They have provided accurate measurements of bone strain in animal [20,21] and human models [22,23]. However, these methods were suitable only for short-term, postoperative recordings due to the potential for infection and the discomfort caused by transcutaneous leads.
Recently, telemetry has been used in conjunction with sensors to eliminate the need for transcutaneous wires to measure in vivo forces acting on the human hip joint and on bones in the spine [22,24]. An implantable system utilized by Szivek et al measured stiffness changes in the lamina to detect spine fusion [22]. Prior to monitoring lamina stiffness in vivo, the strain measurements were compared to a hardwired system to validate the telemetry-based radio transmission system [23]. Telemetry-based systems have also been developed for use in artificial knees [25,26,27] and used to determine tibiofemoral forces during surgical implant placement [27]. In that study, a transmitter was temporarily implanted in the knee and then removed following successful data collection during the surgical procedure.
It would be advantageous if an implantable system allowed more detailed analysis of forces transmitted across a native knee joint during activities such as walking, running and other dayto- day activities. The results could be used to improve tissue engineered implants, refine surgical techniques, guide post-operative rehabilitation and warn patients if they are overloading their tissues. This will require a portable monitoring system that will not hinder patient activities. A recently developed instrumented scaffold coupled to an implantable transmitter and powered with an external power supply has been shown to provide accurate load measurements from the knees of test animals [28,29]. Initially an AC power supply for the transmitter, a computer (PC) and an AC powered bench top receiver were used to monitor measurements.
It was the goal of this study to develop a totally portable monitoring system that could be used during various activities and allow continuous monitoring of forces acting on the knee. In order to make the monitoring system portable, the power supply for the transmitter, the PC and the AC powered bench top receiver were replaced by a battery powered coil, a handheld computer with custom software and a USB powered miniature receiver respectively.
A handheld computer was chosen because it is small, light, battery powered and could be worn on a belt. In addition numerous types of handhelds are now commercially available in different specifications eliminating the need for any custom designed hardware. Handhelds have also been used as a monitoring device in other medical applications [30].
2. Materials and Methods
2.1. Overview
A Dell (Windows OS) handheld load monitoring systems was developed to replace the desktop computer based system. The handheld computer, coupled to a bench top receiver and a wireless receiver were compared to the computer based system and a hardwired system during both bench top testing and in vivo monitoring (Section 2.8). Strain gauges attached to a biomimetic scaffold [31] were monitored by the handheld based system, the computer based system and the hardwired system.
To obtain hardwired measurements strain gauges on a scaffold were wired to a 9-pin female connector (Digi-Key Electronics), which was connected to three Vishay 2100 signal conditioners (Micromeasurements Inc, Raleigh NC). The output of each conditioner was connected to one channel of a National Instruments Data Acquisition board (NIDAQ, National Instruments, Austin TX). A Virtual Instrument created in National Instruments Labview version 7.1 that ran on a Macintosh G4 was used to acquire, plot and save the strain readings from the three channels.
In vivo measurements were collected by the handheld and the computer based system that was coupled to an AC powered bench top receiver or a battery powered receiver while test animals walked and ran on a treadmill.
2.2. Transmitter
An implanted strain gauged scaffold connected to a subminiature, inductively powered, four channel (time multiplexed) radio transmitter [28,29] (Microstrain Inc, Burlington, VT) was setup to measure and transmit load. The transmitter (Figure 1) operated at a frequency of 418.05 MHz and transmitted data at 9600 bauds (i.e. approximately 86 data points per second). Each of the three strain gauges were assigned a channel in the transmitter and a fourth channel was connected to 1000 ohm precision resistor to monitor radio noise.
")
Figure 1. Radio frequency digital transmitter (approximately 25 mm diameter), which has an built-in multiplexer, differential amplifier, A/D converter and Pulse Code Modulator next to a dime.
2.3. Computer Based Load Monitoring System
This system (Figure 2) consisted of:
- A Macintosh G3 power book
- An AC powered coil that inductively powered a radio frequency transmitter (Microstrain Inc, Burlington, VT) and
- An AC powered Radio Frequency (RF) bench top receiver (Microstrain Inc, Burlington VT)
- Custom data measurement and analysis software written in C specifically for this application, running on the Macintosh G3 power book [32]
The RF bench top receiver collected the data, demultiplexed it to produce measurements corresponding to each of the four transmitter channels, checked the data for errors and passed the data packets to the Macintosh G3 Power book. The measurements were displayed on the computer screen and were saved to a file.

Figure 2. Computer Based Measurement System showing a Macintosh G3 powerbook (right) connected to the AC powered receiver via a serial cable and the power supply for the coil that inductively powers the transmitter.
 connected to the AC powered receiver via a serial cable. Also shown (top right) is the power coil.")
Figure 3. Figure 3.a. A Dell handheld computer (right) connected to the AC powered receiver via a serial cable. Also shown (top right) is the power coil. Figure 3.b. A Dell handheld computer connected to the portable wireless receiver via a serial cable
2.4. Development of Handheld based Load Monitoring System
A Dell handheld ran Microsoft Windows Mobile Version 5.0 on a 416 MHz IntelR PXA270 processor with 64 MB of Random Access Memory and displayed information with a resolution of 240×320 pixel TFT 65k color display. LabView 8.2 (National Instruments Inc, Austin, TX) along with an additional plug-in, the LabView PDA module 8.2 (National Instruments Inc, Austin, TX) that included functions specifically targeting Microsoft Windows Mobile 5.0 was used to develop software for the handheld. In order to develop the code, LabView was installed on a computer running Microsoft Windows XP on a Pentium 4, 3 GHz processor with 512 MB memory and 80 GB hard-disk capacity.
The Dell handheld did not have a serial port to connect the RF serial receiver. So a compact flash slot, to which a serial communication card (CF232-5 is a tiny Type I format Compact Flash, single RS232 asynchronous serial port card (Elan Digital Systems, UK)) was connected, was used to connect the RF receiver. The card was automatically configured to become a serial communication port by using the built-in OS drivers that are optimized to work in the Windows Mobile 5.0 environment. This card provided:
- High speed and reliable communications via a 16C550 UART with 16-byte TX and RX FIFOs.
- A maximum transmission rate of 115.2 K Baud.
- Less power consumption (Active mode: 20 mA and a Standby mode: 14 mA typical), which was very important especially for an application that ran on a handheld.
- A Vcc output on Pin 9 (instead of the standard RI signal) that facilitated powering of the wireless miniature RF receiver (Microstrain Inc, Burlington, VT).
The wireless receiver operated in TTL mode, which was a variant of RS 232. Since the serial communications card in the CF slot could take only RS 232 signals, an additional adapter (TTL Converter – 232LPTTL, B & B Electronics) that converted TTL level output signals to RS 232 compatible signals was used (Figure3.b). The wireless receiver was powered by pin 9 of the serial card. The complete setup of the handheld system is shown in Figures 3a and 3b.
2.5. Handheld Software Development
Strain Monitor, the application developed using the LabView PDA module was installed on the handheld. The user interface was carefully developed and tested to minimize user-induced errors that could lead to measurement loss. At the same time, efforts were also made to keep the user interface as simple as possible. Strain monitor was designed to operate in three modes: Idle, Data Collection and Plot [33,34].
The application was programmed to start in the idle mode when it was launched from the start menu. The application provided four controls or buttons to the user to perform various operations. They are: “Open Port”, “Pause”, “Plot” and “Save and Exit”. The application stayed in the idle mode until the filename was given and the “Open Port” button was pressed.
Real time strain measurements could be collected and saved to a file only in the “Open Port” mode. After launching the application, selecting the “Open Port” button opened the serial port of the serial communications card and the application started collecting strain measurements. This was denoted by an indicator in the center of the screen that turned green and displayed “receiving data.” The application continued to collect strain measurements until the “Pause” or “Save and Exit” button was pressed.
In order to avoid data loss and increase the accuracy of the measurements collected in the handheld, the application was programmed so that the unformatted strain measurements were directly saved to a file whenever the number of bytes in the receive buffer reached 255. Even though the receive buffer could hold more data before saving to a file, this was done to simplify the checksum operation. The process of data collection (255 bytes of data) and saving to a file continued until the “Pause” button was pressed or the “Save and Exit” button was pressed. Only after the “Save and Exit” button was pressed, did the program format the data. A checksum calculation was done on the formatted data. Next the data was saved in four columns. Each column represented data collected from one of the four channels of the transmitter. The checksum calculation was done to determine if the data received was valid data. Failed checksum tests were not saved in the file.
2.6. Experimental Setup Used to Test Measurement Collection Systems
The handheld based system was tested by comparing its measurements with a hardwired system during bench top testing and in vivo measurement. Bench top measurements were collected from scaffolds directly loaded with a Material Testing System (MTS, Eden Prairie, MN) servo hydraulic test machine with a cyclic sine wave loading pattern. Three one thousand ohm, uniaxial strain gauges were attached to an implantable scaffold along the longitudinal axis and 120° apart from each other. The scaffold was made from polybutylene terephthalate using a rapid prototyping process [31] and was designed to be used as carriers for tissue-engineered cartilage (Figure 4). Strains from four channels were simultaneously monitored using the hardwired, the computer based and the handheld based measurement systems. During evaluation of the telemetry system, the loading on the scaffold was interrupted at specific time points, to introduce a marker that could later be used to synchronize the strain measurements collected from all the systems. The measurements were compared after loading the scaffolds at 1 Hz, 3 Hz and 10 Hz in order to evaluate the monitoring capabilities of the systems at load rates expected during normal gait, low impact slow exercises and high impact rapid activities such as cutting sports. The accuracy was also checked to determine consistency with results of previous experiments [18,19,20].

Figure 4. An implantable scaffold with one uniaxial strain gauge showing. The scaffolds used in this study were approximately 11.3 mm long and 8.9 mm in diameter.
In vivo testing utilized the strain-gauged scaffolds coupled to a subminiature transmitter, implanted into a hound dog using a published procedure [28] to monitor changes in knee loading by measuring strain changes. Transmitters were powered by placing an external power coil on the dog’s skin so that it was parallel to the orientation of the subcutaneous transmitter. The external coil was connected to a battery power pack on a circuit board, which generated a high frequency power wave. Powering of the coil powered the transmitter and caused strain measurement transmission. The dog was walked on a treadmill at three different speeds (1.6 miles/hr, 2.6 miles/hr and 3.7 miles/hr respectively) and strain measurements were collected for a period of approximately 1 minute. At the highest speed, the power was turned off briefly to simulate the slipping of the power coil from the transmitter at high speeds, which stopped the data transmission briefly. The computer based and the handheld based receiver setups collected these strain measurements, which were compared. Six sets of measurements were collected for each speed, which were later used to compute average accuracy.
3. Results
3.1 Bench Top Testing
3.1.1. Comparison of Measurements collected using Computer Based and Hardwired Systems—Testing the computer based receiver system by axially loading the strain gauged scaffolds on an MTS at 1 Hz, 3 Hz and 10 Hz with a sine wave pattern for a period of 1 minute and comparing the results to those collected from the hardwired system showed that each of the four channels tracked the measurements collected with the hardwired system exactly (Figure 5).
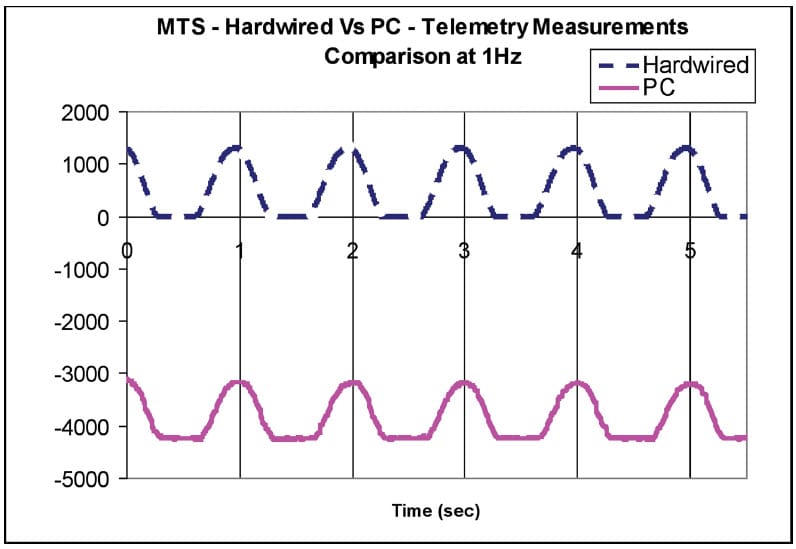
Figure 5. Measurements from a single channel collected by hardwired (upper line) and telemetry (lower line) setups at 1Hz. The point of intersection of the vertical lines and the curves represent the peak strain value. Note that strains collected with the PC were offset by 3000 µ strain to allow easier comparison of the two curves.
The sine waves appear flattened in the second half of each cycle since the testing procedure only loaded the specimens in compression. The average data rate of the transmitter used in the telemetry setup was determined to be 87.2 points per second based on calculation of the average number of data points between adjacent wave peaks on the sine wave plot.
3.1.2. Comparison of Handheld Based and Computer Based Receiver System— Measurements collected simultaneously at 1 Hz by the computer and the handheld when using ‘Strain Monitor version 1 (SMv1)’ of the software coupled to bench top receiver showed that the peak strain values of the two systems did not coincide exactly with each other. The peak values were temporally shifted by 0.69 seconds after 8 seconds of data collection (Figure 6). The same shift was observed in the measurements collected by all three active channels. The fourth baseline channel was setup to collect a single fixed value over time to monitor radio noise. The first peak of the two systems coincided perfectly and the shift gradually increased. The handheld missed data points at frequent but aperiodic intervals throughout the duration of data collection. This caused the pulses displayed on the handheld curve to have a narrower width (Figure 6). While debugging the program, the flaw in the code was found in the section that did checksum calculation and formatted the data points. The formatting code skipped data whenever zeros were transmitted leading to this error.

Figure 6. Strain values collected by the two systems corresponding to one of the measurement channels. The first strain peak of both PC and handheld recorded measurements coincided exactly. The final peak strain of the measurements collected with the handheld is shifted by 0.69 seconds. Note that strains were recorded with an offset. Actual strain magnitudes are the difference between the base line and peak values.
Measurements collected at 1 Hz when version 2 (SMv2) of the software was installed in the handheld also showed that the peak strain values still had a temporal shift. In this case a shift of 0.38 seconds was noted after 8 seconds of data collection (Figure 7). This error was due to some of the high priority system signals that interrupted the writing of the formatted data to the file and was overcome in the third version of the code. Measurements collected at 1 Hz with version SMv3 of the software installed in the handheld showed that the peak strain values of the two systems exactly coincided with each other and there was no temporal shift in the peaks observed (Figure 8).

Figure 7. Strain values collected by the two systems corresponding to one of the measurement channels. The first strain peak of both PC and handheld recorded measurements coincided exactly. The final peak strain peak measured with the handheld is shifted by 0.38 seconds. Note that magnitudes are the difference between the base line and peak values.

Figure 8. Strain values collected with the PC and handheld systems. All strain peaks collected with both the PC system and the handheld system running program Smv3 coincided exactly when scaffolds were loaded at 1 Hz. Note that magnitudes are the difference between the base line and peak values.
The measurements collected with the handheld using SMv3 and the computer from test specimens loaded at 3 Hz (Figure 9) and 10 Hz (Figure 10) were identical both in magnitude and temporally.

Figure 9. Strain values collected with the PC and handheld systems. All strain peaks of both the PC and handheld systems running (SMv3) coincide exactly when scaffolds were loaded at 3 Hz. Note that magnitudes are the difference between the base line and peak values.

Figure 10. Strain values collected with the PC and handheld systems. All strain peaks of both the PC and handheld systems running (SMv3) coincide exactly when scaffolds were loaded at 10 Hz. Note that magnitudes are the difference between the base line and peak values.
Comparing the strain measurements collected by the handheld coupled to the bench top receiver and the handheld coupled to the wireless receiver, showed that the measurements recorded by the two systems matched almost exactly at all three frequencies. However, there were a few points on the waveforms recorded at 1 Hz (Figure 11.a), 3 Hz (Figure 11.b), and 10 Hz (Figure 11.c) of the wireless receiver coupled handheld that did not match the bench top receiver coupled handheld measurements. The average rate of mismatch was observed to be 0.98 data points/sec. Considering the transmission rate of 86 data points per second, this implies that the accuracy of the wireless receiver coupled handheld based system was between 98.6% and 98.9% when compared to the bench top receiver coupled handheld based system.

Figure 11. Figure 11. a. Strain values corresponding to one of the four channels collected by the two Dell handheld-based systems (bench top receiver and wireless receiver) at 1 Hz. Note that magnitudes are the difference between the base line and peak values. Figure 11. b. Strain values corresponding to one of the four channels collected by two Dell handheld systems (one with a bench top receiver and one with a portable wireless receiver) at 3 Hz. Note that magnitudes are the difference between the base line and peak values. Figure 11. c. Strain values corresponding to one of the four channels collected by the two handheld systems (one with a bench top receiver and one with a portable wireless receiver) at 10 Hz. Strains were recorded with an offset and actual strain magnitudes are the difference between the base line and peak values. Note that an occasional signal spike is observed with the wireless receiver.
3.2. In vivo Testing Using Handheld Based System
In vivo strain measurements collected simultaneously using computer based and handheld based telemetry systems running the SMv3 code showed similar measurements (Figure 12). However, when the power coil slipped off the transmitter momentarily, an average loss of 10 data points was observed as the handheld system continued to lose data points even after the power coil came back into position (Figure 13). Utilizing an SMv4 code provided better results under some conditions (Table 1). The six sets of measurements collected with this code at each speed were identical for the both the systems.

Figure 12. These in vivo strain recordings were collected while test animals ran at three different speeds on a treadmill. They were recorded with an offset and the actual strain magnitudes are the difference between the base line and peak values. Note that the strain measurements collected with the PC and those collected with the handheld computer overlap perfectly.

Figure 13. This recording shows two artifacts caused by the slipping of the power coil from the transmitter. These artifacts are easily detected because they are generally very short in duration and large in magnitude. As such they can be identified without difficulty and removed from a data set.

Table 1. Accuracy of different versions of the software running on the Dell handheld computer:
Six sets of measurements taken at the highest speed while intentionally removing the power coil when the handheld ran the fourth version of the software (SMv4) showed there was no loss of data after the power coil was brought back into position (Figure 14). Since this approach had the effect of temporarily switching off the power to the transmitter the curves did show a time shift (as was expected) relative to the hardwired measurements.

Figure 14. These two curves overlap up to data point 400, which shows an artifact produced by switching off the power supply. There is a time shift between the two curves beyond the artifact. This is easily detected when a second artifact is produced by switching off the power supply a second time.
Measurements taken simultaneously using the handheld coupled to the bench top receiver and the handheld coupled to the wireless receiver at three different speed levels showed an average mismatch of 2 to 3 data points per second. This leads to an overall error which varies from approximately 99% to 100% during bench top testing by comparison to errors ranging from 91% to 94% for measurements collected in vivo (Table 2).

Table 2 Accuracy of two configurations of the Dell handheld computer using version SMv4 software.
4. Discussion
Osteoarthritis is the most common form of arthritis. It affects more than 70% of the people older than age 65 [35,36] and 33% of them have osteoarthritis in the knee [37]. Total knee arthroplasty is the current treatment of choice in which the joint is replaced with metal and plastic parts. Cartilage tissue engineering has shown promise as a potential technique for cartilage defect repair [38]. The accurate measurement of forces acting on the knee will facilitate better cartilage tissue engineering strategies and improve rehabilitation activities that will accelerate recovery following knee surgery. In the long term it will also allow development of tissue engineering approaches to repair any damage observed in osteoarthritic joints.
The implantable strain monitoring system described in this study coupled to a computer based receiver allows measurement collection from knees providing accurate assessment of the joint loads. This system which included a bench top computer based receiver and data collection system was not portable and could not be carried by test animals or patients during various activities limiting its usefulness. The overall goal of this study was to design and test a completely portable system that could be used to measure loads during normal activities and would bring about a better understanding of approaches to improve rehabilitation regimens.
Rydell [17] was the first to measure hip forces in vivo using direct connection to transcutaneous leads. Perry et al [39] demonstrated the measurement of tibial forces in vitro using a tibial plate connected to an instrumented shaft and showed an average error of 6% between calculated and measured forces in a 2-D model of the knee. Kaufman et al [16] reported that a tibial prosthesis instrumented with strain gauges could measure forces in vitro. Davy et al [8] was the first to report hip forces measured in vivo using telemetry and claimed a measurement accuracy of 98.4%.
Lutz et al [4] measured femoral forces using an external load and angle measurement system and combined this with a model to determine in vivo loads. They reported forces 30% lower compared to those collected with other direct measurements. Taylor et al [40] reported femoral forces using an instrumented distal limb replacement prosthesis, and reported an error of 4% – 5%. This study represented a significant advance toward direct measurement of femoral forces and provided evidence that telemetry was a useful method of measuring joint forces.
D’Lima’s group [26,27] first used an implantable micro-transmitter developed by Microstrain Inc in collaboration with our lab, inside an artificial knee that successfully transmitted data through bone, bone cement and soft tissue. However, they removed this system immediately after collecting measurements. Heinlein et al [41] have also described a calibrated implantable knee system that allows load measurement directly from inside a patient’s knee and are planning clinical use of this device to evaluate rehabilitation procedures. More recently D’Lima et al [42] have reported using their instrumented artificial knee to measure shear loads after 3 months in one patient.
Szivek’s group [25,32] was the first to report on the development of a telemetrized system to collect measurements from an artificial knee. In those studies, the peak strain values collected by hardwired and telemetry systems were compared and showed that even at very high load rates, the peak stain values collected by the two systems matched exactly. The telemetry system [22,23] consisted of a PC and a bench top receiver that was not easily portable and hence not readily used as a load-monitoring device after surgery. This system was also used to report the first in vivo telemetry based measurements of bone stiffness changes in a patient during spine fusion [22].
In the current study a portable wireless miniature receiver and a handheld computer that can be worn by patients after knee surgery involving cartilage regeneration was successfully developed for use with a miniature implantable transmitter. A software program written for a Windows OS based handheld computer using Labview, provided accurate and reliable in vivo measurements on a totally portable platform.
An application was developed using LabView 8.0 and the LabView PDA Module 8.0 (National Instruments, Austin TX) to be used with a Dell handheld. The advantages of this system are: a simple user interface, ease of use, extended data collection times, easy file transfer and an alarm mode.
Data could be collected over an extended period of time and saved in comparison to the computer based system, which could only save 10 seconds worth of data due to the buffer size. The data collection into the Dell handheld was only limited by battery life (20 minutes) and hard disk space (a 1 minute data file is 1.5 MB). The 128 MB disk capacity of the Dell handheld would allow it to hold 85 minutes of data.
The Dell’s large memory and fast processor also allowed the development of an alarm mode, which can alert a patient when specific measurements are detected. At this time the program causes the handheld to sound an alarm when a predetermined strain is measured indicating the knee surface is being overloaded. This feature does require a considerable amount of memory, which slows down data collection. Future formulations are expected to include more sophisticated warning codes as processor speed increases and more memory becomes readily available.
Software errors that affected the accuracy of data collection were fixed in successive versions of the program starting from SMv1 to SMv3 after extensive testing, on both the bench top and in vivo. When a test animal was run at a high speed (3.67 miles/hr), the power coil slipped at random points creating artifacts. Whenever this occurred, the handheld missed data points, bringing down its accuracy. This was fixed in the final software formulation of the Strain Monitor (SMv4) so that there was no loss of data (Table 1 and Table 2).
Acknowledgments
The authors thank the National Science Foundation for support through BES-0427483.
References
- Brand RA, Pedersen DR, Davy DT, Kotzar GM, Heiple KG, Goldberg VM. Comparison of hip force calculations and measurements in the same patient. The Journal of Arthroplasty 1994;9(1):45–51. [PubMed: 8163975]
- Komistek RD, Stiehl JB, Dennis DA. Mathematical model of the lower extremity joint reaction forces using Kane’s method of dynamics. Journal of Biomechanics 1998;31:185–189. [PubMed: 9593214]
- Komistek RD, Dennis DA, Mabe JA, Walker SA. In vivo determination of patellofemoral contact positions. Clinical Biomechanics 2000;15:29–36. [PubMed: 10590342]
- Lutz GE, Palmitier RA, An KN, Chao EY. Comparison of tibiofemoral joint forces during open-kineticchain and closedkinetic- chain exercises. Journal of Bone and Joint Surgery American 1993;75A:732– 739.
- Nisell R, Ericson MO, Nemeth G, Ekholm J. Tibiofemoral joint forces during isokinetic knee extension. American Journal of Sports Medicine 1989;17:49–54. [PubMed: 2929836]
- Seireg A, Arvikar RJ. The prediction of muscular load sharing and joint forces in the lower extremities during walking. Journal of Biomechanics 1973a;8:89–102. [PubMed: 1150683]
- Seireg A, Avikar RJ. A mathematical model for evaluation of forces in lower extremeties of the musculo-skeletal system. Journal of Biomechanics 1973b;6:313–326. [PubMed: 4706941]
- Davy DT, Kotzar GM, Brown RH, Heiple KG, Goldberg VM, Heiple KG Jr, Berilla J, Burstein AH. Telemetric force measurements across the hip after total arthroplasty. Journal of Bone and Joint Surgery 1988;70-A(1):45–50. [PubMed: 3335573]
- Anderson FC, Pandy MG. Dynamic optimization of human walking. Journal of Biomechanical Engineering 2001;123:381–390. [PubMed: 11601721]
- Andriacchi, TP.; Natarajan, RN.; Hurwitz, DE. Musculoskeletal dynamics, locomotion, and clinical applications. In: Mow, VC.; Hayes, WC., editors. Basic Orthopaedic Biomechanics. Vol. 2. Lippincott-Raven; Philadelphia: 1997. p. 37-68.
- Komistek RD, Kane TR, Mahfouz M, Ochoa JA, Dennis DA. Knee Mechanics: a review of past and present techniques to determine in vivo loads. Journal of Biomechanics 2005;38:215–228. [PubMed: 15598448]
- Miller RK, Murray DW, Gill HS, O’Connor JJ, Goodfellow JW. In vitro patellofemoral joint force determined by a non-invasive technique. Clinical Biomechanics 1997;(12)(1):1–7. [PubMed: 11415665]
- Miller RK, Goodfellow JW, Murray DW, Gill HS, O’Connor JJ. In vitro measurement of patellofemoral force after three types of knee replacement. Journal of Bone and Joint Surgery [Br] September;1998 80-b(5):900–906.
- Benjamin JB, Szivek JA, Hammond AS, Kubchandhani Z, Matthews AI. Contact Areas and Pressures between Native Patellae and Prosthetic Femoral Components. J Arthroplasty 1998;13(6):693–698. [PubMed: 9741448]
- Tanzer M, McLean CA, Laxer E, Casey J, Ahmed AM. Effect of femoral component designs on the contact and tracking characteristics of the unresurfaced patella in total knee arthroplasty. Canadian Journal of Surgery April;2001 44(2):127–13.
- Kaufman KR, Kovacevic N, Irby SE, Colwell CW. Instrumented implant for measuring tibiofemoral forces. Journal of Biomechanics 1996;29(5):667–671. [PubMed: 8707796]
- Rydell NW. Forces acting in the femoral head prosthesis. Acta Orthop Scand 1966;37(Supp 88):1– 132. [PubMed: 5937976]
- Szivek JA, Johnson EM, Magee FP. An In Vivo Strain Analysis of the Greyhound Femoral Diaphysis. J Investigative Surgery 1992;5:91–108.
- Szivek JA, Johnson EM, Magee FP, Emmanual J, Poser RD, Koeneman JB. Bone Remodeling and In Vivo Strain Analysis of Intact and Implanted Greyhound Proximal Femora. J of Investigative Surg 1994;7(3):213–233.
- Szivek JA, Anderson PL, DeYoung D. In Vivo Strain Measurements Collected using Calcium Phosphate Ceramic Bonded Strain Gauges. J of Investigative Surg 1997;10(5):263–273.
- Rabkin BA, Szivek JA, Schonfeld J, Halloran BP. Long-Term Measurement of Bone Strain In Vivo: The Rat Tibia. JBMR (Applied Biomaterials) 2001;58(3):277–281.
- Szivek JA, Roberto RF, Margolis DS. In vivo strain measurements from hardware and lamina during spine fusion. J Biomed Mater Res B Appl Biomater Nov;2005 75(2):243–50. [PubMed: 16161111]
- Szivek JA, Roberto RF, Slack JM, Majeed bS. An Implantable Strain Measurement System Designed to Detect Spine Fusion. Spine 2002;27(5):487–497. [PubMed: 11880834]
- Graichen F, Bergmann G, Rohlmann A. Hip endoprosthesis for in vivo measurement of joint force and temperature. J Biomech Oct;1999 32(10):1113–7. [PubMed: 10476850]
- Maan HS, Szivek JA, Benjamin JB. Development of a knee telemetry data capture and feedback system. J Invest Med Feb;1999 47(2):40A–40A.Suppl. S
- Morris BA, D’Lima DD, Slamin JE, Kovacevic N, Arms SW, Townsend C, Colwell CW Jr. e-Knee: evolution of the electronic knee prosthesis: telemetry technology development. Journal of Bone and Joint Surgery American 2001;83-A(Suppl 2):62–66.
- D’Lima DD, Townsend CP, Arms SW, Morris BA, Colwell CW Jr. An implantable telemetry device to measure intra-articular tibial forces. J Biomech Feb;2005 38(2):299–304. [PubMed: 15598457]
- Szivek JA, Bliss CL, Geffre CP, Margolis DS, DeYoung DW, Ruth JT, Schnepp AB, Tellis BC, Vaidyanathan RK. An Instrumented Scaffold can Monitor Loading in the Knee Joint. J Biome Mater Res –B, Appl Biomats 2006;79B(2):218–228.
- Geffre CP, Bliss CL, Szivek JA, DeYoung DW, Ruth JT, Margolis DS. Sensate Scaffolds Coupled to Telemetry Can Monitor In Vivo Loading From Within a Joint Over Extended Periods of Time. J Biome Mater Res –B, Appl Biomats 2008;84B(1):263–270. 218–228.
- Lin YH, Jan IC, Ko PC, Chen YY, Wong JM, Jan GJ. A wireless PDA-based physiological monitoring system for patient transport. IEEE Trans Inf Technol Biomed Dec;2004 8(4):439–47. [PubMed: 15615034]
- Tellis BC, Szivek JA, Bliss CL, Margolis DS, Vaidyanathan RK, Calvert P. Trabecular Scaffolds Created Using Micro CT Guided Fused Deposition Modelling. J Materials Science and Engineering –C 2008;28/1:171–178.
- Maan H, Szivek JA. Development of Data Capture Software for an Artificial Knee with Sensors and telemetry. Rehabilitation R&D Progress Reports. 1998section 10, Article 171
- Labview Fundamentals. National Instruments; Austin, Texas, USA: Aug. 2005
- Labview Online Examples – www.ni.com.labview/examples
- Hinton R, et al. Osteoarthritis: Diagnosis and therapeutic considerations. American Family Physician 2002;65(5):841–848. [PubMed: 11898956]
- Wise, C. Osteoarthritis. In: Dale, DC.; Federman, DD., editors. ACP Medicine. New York: WebMD; 2004. section 15, chap. 10
- Centers for Disease Control and Prevention. Prevalence of self-reported arthritis or chronic joint symptoms among adults United States, 2001. MMWR 2002;51(42):948–950. [PubMed: 12437034]
- Redman SN, Oldfield SF, Archer CW. Current strategies for articular cartilage repair. Eur Cell Mater 2005;9:23–32. [PubMed: 15830323]
- Perry J, Antonelli D, Ford W. Analysis of knee-joint forces during flexed-knee stance. Journal of Bone and Joint Surgery American 1975;57:961–967.
- Taylor SJ, Walker PS, Perry JS, Cannon SR, Woledge R. The forces in the distal femur and the knee during walking and other activities measured by telemetry. Journal of Arthroplasty 1998;13:428– 437. [PubMed: 9645524]
- Heinlein B, Graichen F, Bender A, Rohlmann A, Bergmann G. Design, calibration and pre-clinical testing of an instrumented tibial tray. J Biomechanics 2007;40:S4–S10.10.1016/j.jbiomech. 2007.02.014
- D’Lima DD, Patila S, Steklova N, Chienb S, Colwell CW Jr. In vivo knee moments and shear after total knee arthroplasty. Journal of Biomechanics 2007;40:S11–S17.10.1016/j.jbiomech.2007.03.004 [PubMed: 17462659]