Article
Related Links
Yeh-Hung Lai *, Pinkhas A. Rapaport, Chunxin Ji, Vinod Kumar
Fuel Cell Activities, General Motors Corporation, Honeoye Falls, NY 14472, United States
Abstract
The effect of gas diffusion medium (GDM) intrusion on the performance of proton exchange membrane (PEM) fuel cells is investigated. The mechanical behaviors of various GDM are characterized in compressive, flexural, and shear tests. The results are used in a numerical model to calculate the channel intrusion of GDM. The intrusion calculation from the numerical model agrees well with the measurements from an intrusion measurement setup and a pressure drop measurement device for various GDM. A simplified reactant flow redistribution model of parallel channels developed in this study suggests that a 5% variation in GDM intrusion can result in a 20% reduction of reactant flow in the most intruded channel. The GDM intrusion and intrusion variation are found to induce significant performance discrepancy among cells of a 30-cell automotive fuel cell stack consisting of two different production lots of commercial GDM. The study suggests that in the future mass production of fuel cell stacks,GDM manufacturers need to greatly tighten their product variations in mechanical property and thickness to ensure reliable PEM fuel cell operations.
© 2008 Global Technology Inc. Published by Elsevier B.V. All rights reserved.
Keywords: PEM fuel cell; Gas diffusion media; Channel intrusion; Flow distribution
* Corresponding author. Tel.: +1 585 624 6329; fax: +1 585 624 6680.
E-mail address: [email protected] (Y.-H. Lai).
1. Introduction
A proton exchange membrane (PEM) fuel cell stack is comprised of a series arrangement of repeating cell units, each of which consists of a membrane electrode assembly (MEA) where the electrochemical reaction takes place; two layers of gas diffusion media (GDM) for the distribution of fuel and oxidant gases over the catalytic surfaces; and a bipolar plate which directs fuel and oxidant gases from the inlet manifolds through a network of flow channels. During the fuel cell stack assembly, these repeating cells are stacked together with intermediate seal gaskets and then compressed to provide adequate gas sealing, as well as to reduce contact resistances at the material interfaces. The GDM plays an important role in PEM fuel cells by (1) acting as a buffer layer between the softer MEA and stiffer bipolar plates; (2) acting as diffuser for reactant gases traveling to electrodes; (3) transporting product water to the gas flow channels; (4) conducting electrons; (5) transferring heat generated at MEA to the coolant within the bipolar plates. GDM is normally composed of porous non-woven carbon fiber paper or carbon fiber cloth. The effect ofGDMcompression on the fuel cell performance has been investigated by many researchers mostly on electrical, thermal, and mass transport resistances within the bulk material and across the contact interfaces [1–9]. To minimize contact resistance, high contact pressure between the lands of reactant gas flow field and gas diffusion media is usually desired. However, these studies generally found that optimal compression pressure would need to be determined by balancing its conflicting effect on GDM’s porosity, diffusivity, permeability, electrical conductivity, and thermal conductivity.
It is worth noting that most papers on the fuel cell compression and its effect on the PEM fuel cell performance considered only a relatively small domain for the purpose of understanding material behavior. These included a half-channel-and-half-land domain in computational modeling; ex situ clamping setups for samples of several cm2 in size; and/or small-scale single cells of 5 to 50cm2. When considering the compression in full-scale (stacks with 100 or more cells) PEM fuel cell applications, the flowdistribution factor starts playing a significant if not dominating role [10]. Flow distribution in channels of manifold devices is a topic inherited from plate heat exchangers comprising discrete minichannels, for example, with inlet and outlet manifolds opening on one side (U-configuration) or on opposite sides (Zconfiguration) [11,12]. In recent years several papers on flow distribution in fuel cells and fuel cell stacks were published. Barrears et al. [13] reported on flow velocity distribution measured in a single 50 cm2 cell. Grega et al. [14] studied velocity distribution in a scaled up model of a 21-cell stack. Maharudrayya et al. [15,16] modeled flow distribution for a variety of single cell flow field configurations. Koh et al. [17] proposed a systematic algorithm for computation of pressure and flow distribution in internal gas manifolds of a 100-cell stack. Because the number of cells is relatively large, the flow in manifolds has to be treated as turbulent whereas in most previous publications both channel and manifold (header) flows are considered laminar. In all these papers, deviation from uniform channel-to-channel or cell-tocell flow distribution is attributed mainly to the geometry. The results may serve as a design guide. For example, Park and Li [18] considered the effect of flow and temperature distribution on the performance of a 51-cell stack, and one of the conclusions is that the hydraulic diameters of the inlet and outlet manifolds should be at least 20 times larger than the channel diameter.
A more comprehensive approach to flow distribution was implemented by Chang et al. [19]. A conventional finite element approach to flowbranching and merging back along the inlet and outlet headerswas coupled with reactant consumption andwater production along the channels, which defined the actual cell performance. The model was validated against experimental data for a 190-cell Ballard Mk 7 stack, and the fitted friction factors were averaged over the length of the channel and header. The most distinctive part of this paper is the case study of so called deviation from manufacturing tolerances, which was achieved by introducing friction coefficient variation for a single cell, or by imposing some distribution of friction coefficients on all 100 cells of the model stack. By introducing this simulated perturbation, the authors proved that a relatively small deviation may cause significant changes of flow in a single cell or the entire cell to cell flow distribution in the stack.
Due to the compression difference in the GDM over channels and lands, the unsupported portion of the GDM can intrude into reactant gas channels upon assembling fuel cell stacks. The direct consequence of GDM intrusion is that it can increase the pressure drop of the reactant gases in the intruded cha
nnels. Nitta et al. [7] reported the measurement of GDM intrusion at various degrees of compression and channel widths using a dial indicator in an intrusion measurement setup. They reported that the intrusion increased as the degree of compression increased. However, the sensitivity to channel width was much less significant, which could be caused by very thick and softGDMused for testing. In a subsequent paper by Hottinen et al. [8] the effect of inhomogeneous land versus channel compressionwas taken into account in a fuel cell model, which showed significant impact on the fuel cell performance. In this study, because the model domain was limited to single channel/channel, the difference in performance was mostly attributed to the under-the-land conditions (contact resistance and permeability), while the possibility of channel-to-channel reactant flowmaldistribution due toGDM intrusion was not considered at all. More recently, Basu et al. [20] investigated the two-phase reactant flow maldistribution resulted from GDM intrusion caused by uneven compression distribution over the active area of a single cell. The authors also gave a more comprehensive explanation for the implications of reactant flow maldistribution. It was concluded that poor reactant distribution not only can cause performance and stability problems, but also create conditions for catalyst corrosion, and therefore affect durability.
Until recently, relatively little attention has been paid to studying GDM’s mechanical behavior and its effect on fuel cell performance. Mathias et al. [1] reported the mechanical characterization of GDM. The compressive behaviorwas characterized by placing a GDM between two flat plates and the deflection was measured as a function of compressive force. It was found that after the first loading, the GDM generally showed different unloading and reloading curves, suggesting weakening of the material from the first loading. To characterize the bending behavior of GDM, Mathias et al. proposed the use of flexural tests such as ASTM D790. With the load/deflection response from the flexural test, flexural modulus and flexural strength could be determined. Lai et al. [21] investigated the compressive pressure between GDM and MEA over the lands and channels in a single-channel cell and in fuel cell stack. They found that fuel cells could lose significant compression pressure due to the hysteresis in GDM’s compressive behavior. Because of the relatively small ratio between the channel width and the GDM thickness, typically ranging from 2 to 10, the shear behavior of GDM can also affect the compressive pressure distribution. From finite element modeling and testing using PressureXTM (Sensor Product Inc.) film, they suggested that a higher transverse shear modulus was preferred in the GDM to increase the contact pressure over the channels and to reduce the potential MEA buckling.
In this paper, an effort to develop a GDM intrusion model based on the finite element method (FEM); experiments to measure the GDM intrusion and flow field pressure drop to validate the intrusion model; and a simplified reactant flow redistribution model to estimate the effect of channel intrusion on the reactant flow redistribution will be reported. How PEM fuel cell performance can be affected by GDM channel intrusion and intrusion variation as a direct consequence of GDM’s property and thickness variations will also be discussed.
2. GDM channel intrusion model
In this study, a 2D finite element model was used to determine the intrusion of GDM into the gas channel. The model was built using the commercial finite element software, ABAQUS®. Fig. 1 illustrates the deformed shape of the model, which consists of a single channel flow field and a single GDM layer constrained at the lower surface. The GDM intrusion is defined as the vertical distance from the apex of GDM surface facing the reactant gas channel to the plane of lands. The land and channel profile is modeled as rigid surface. Contact condition is considered between the rigid surface and the GDM upper surface. Two element types, a gasket and a plane strain element, are superposed together and used to model the GDM. Three mechanical tests, a compressive test, a flexural test, and a shear test, were conducted to determine the material properties to be used in the model. It should be noted that there is yet no standardization of methods to measure the GDM’s mechanical properties. Although a more comprehensive analytical and experimental effort would be needed to completely characterize the GDM mechanical properties, it is found that the tests used in this study can satisfy our needs to calculation the GDM intrusion.
Following Mathias et al. [1], the GDM compressive behavior was characterized by placing a GDM between two flat circular steel blocks. The load and deflection relationship was measured to obtain the compressive stress–strain curve in the thickness direction. The in-plane elastic behavior was characterized by a flexural test described in ASTM D790 from which the modulus of elasticity was determined. To measure the shear property of GDM, a punch-and-die type of shear test was developed. In the test fixture schematically shown in Fig. 2(A), a GDM sample was clamped between two sets of rectangular clamping blocks separated by a fixed distance. A rectangular shear piston was pushed down on the unsupported GDM to generate a load–defection (P vs. b) curve. An effective transverse shear modulus was then determined by using the initial linear portion of the load–deflection curve as seen in Fig. 2(B). It should be noted that the flexural and shear tests used in this study may provide only an approximation to the Young’s modulus and shear modulus of the GDM. However, as will be seen in the later discussion, the good agreement between the intrusion measurement and the model calculation for several different GDM types suggests that these tests can generate useful material information for model calculations.

Fig. 1. The schematic of GDM intrusion of a GDM compressed by a single channel flow field.

Fig. 2. Shear test setup and stress–strain schematic for the transverse shear modulus of GDM.
In the finite element model, the compressive stress/strain curve from the compressive test was used to model the behavior of the gasket elements. The solid elements were assigned orthotropic elastic properties with a very small through-plane modulus. Moduli of elasticity from the flexural test were used as Young’s modulus in the in-plane directions. Apparent shear moduli from the shear test were used as the shear moduli. Since GDM has a very high open porosity (commonly at 80%), a very small Poisson’s ratio was used.
To understand the GDM intrusion behavior, a carbon paperbasedGDMdenoted as “GDM X” was used as the model GDM. The thickness of the GDM is about 0.260 mm. The effective transverse shear modulus from the shear test is about 14.2MPa in the first in-plane direction (denoted as “Dir. 1”) and 9.2MPa in the second in-plane direction (denoted as “Dir. 2”). The moduli of elasticity determined from the flexural test are 900MPa and 300MPa in Dir. 1 and Dir. 2, respectively. The measured compressive strains in the thickness directions are tabulated in Table 1.
Fig. 3 illustrates the intrusion versus compressive pressure over the land for a sheet of GDM X compressed by a flow field of 1 mm-wide channel and 2 mm-wide land against a rigid plane. Note that the GDM intrusion i
n this configuration is equivalent to the one in a single fuel cell with a symmetrical plane at the mid-plane of the MEA. In Fig. 3, the line denoted“GDMX—Dir 1” represents the case where the first in-plane direction corresponds to the channel width direction. At a compressive pressure of 2.8MPa over the land, the intrusion is 0.073mm in Dir. 1 and 0.079mm in Dir. 2. For the whole compression range, it is seen that the intrusion for the case with lower stiffness in both shear and bending (Dir. 2) is higher than the case with higher stiffness (Dir. 1), which illustrates that stiffer GDM can have less intrusion.

Fig. 3. GDM intrusion vs. the compressive pressure over the lands of a model GDM X for the case of 1 mm-wide channel.

Table 1
Compressive stress and strain data of GDM X
3. GDM channel intrusion experiment and model validation
To validate the intrusion model calculation, an intrusion measurement setup, as schematically shownin Fig. 4,was developed. In this intrusion fixture, a slot coupon was machined to mimic the geometry of single channel flow field. A floating bar was placed in contact with the GDM in the slot. Two extensometers were mounted at the two ends of the floating bar to monitor the movement of the floating bar when compression load was applied from the top of the fixture. Two tests were performed. The first test was carried out by placing a rigid shim on top of the GDM as shown in Fig. 4(A). The extensometers were zeroed at 35 kPa when the load was applied from the top of the fixture. As the compression loadwas increased, the displacement of floating bar was recorded as X, which represents the thickness change of the GDM over the lands. A second test as shown in Fig. 4(B) was performed in a similar way by monitoring the GDM thickness change in the slot under compression. In the second test, the rigid shim was not used, and the movement of the floating bar was recorded as Y, which was also zeroed at 35 kPa.
Fig. 5 illustrates schematically a typical set of data collected using the intrusion test fixture. The difference between X and Y under the compression load of interest gives the absolute GDM intrusion into the slot.Arelative intrusion can also be determined by (X-Y)/X.
To validate the model calculation, a sheet of GDM X was compressed at 2.8MPa over the land and the intrusion was measured. Fig. 6 illustrates the relative intrusion comparison between the model calculation and experimental results. Good agreement is seen for both in-plane directions.
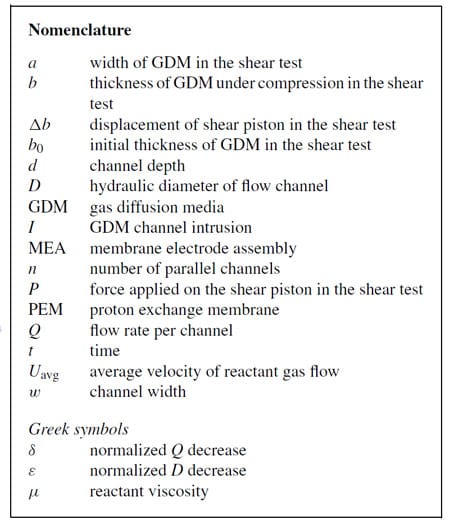
Fig. 7 illustrates similar comparisons for five types of GDM from four different manufacturers. Good agreement is also seen for all cases in spite of a various degree of compressibility, bending stiffness, and shear moduli, which is reflected by a relatively wide spread of the relative intrusion ranging from about 75% to more than 95%. The good agreement between the experiment and model calculation further suggests that the GDM’s intrusion behavior can be reasonably captured using the mechanical tests and the intrusion model described in this paper.

Fig. 4. Schematic of the GDM intrusion test setup.

Fig. 5. Schematic of load–displacement curves obtained from intrusion test.

Fig. 6. Comparison in relative intrusion between the model calculation and experimental measurement in GDM X samples of two different orientations.
Fig. 7. Relative intrusion comparison between experimental and model calculation for a wide range of GDM types and manufacturers.
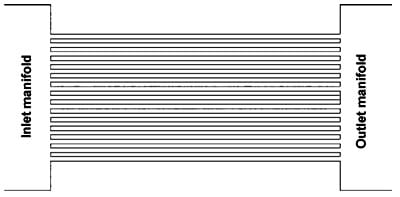
Fig. 8. Schematic of a header fed parallel-channel configuration. 5. Results and discussions Since channel intrusion reduces the hydraulic diameter of reactant gas
4. Reactant flow redistribution model
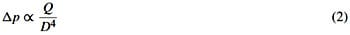
In order to estimate the effect of GDM intrusion into flow field channels on flow distribution, an n parallel-channel configuration is considered as shown in Fig. 8, which consists a set of n parallel channels of the same length with a nominal hydraulic diameter D and a nominal flow rate per channel Q. Using a simplified model based on Hagen–Poiseuille equation for incompressible laminar flow in cylindrical conduits [23]:
where p is the pressure of reactant gas; x is the distance from the inlet; µ is the viscosity of the reactant gas; Uavg is the average velocity, all the channels would have the same pressure drop p from inlets to outlets, given by
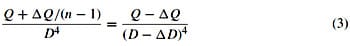
To investigate the flow redistribution, the case where a channel has more GDM intrusion than the nominal channels is considered. Due to this additional intrusion the hydraulic diameter of the more intruded channel is decreased by D compared to the rest of the channels. In this case the flow through this channel will decrease by an amount of Q. Because the system is maintaining a constant flow rate, the amount Q will be redistributed among the remaining (n-1) channels. Provided that the pressure drops in the nominal and the more restricted channels are still equal and the change in channel hydraulic diameter of the more intruded channel is relatively small, the following equation can be derived:
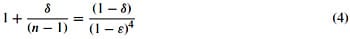
Dividing Eq. (3) by Q/D4, and substituting d =Q/Q, and e =D/D, Eq. (3) can be rewritten in a dimensionless form of
Solving Eq. (4) relative to ¯d = (1 – d) the flow in the more restricted channel as a percentage to the nominally expected flow is given by
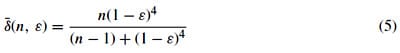
Eq. (5) is presented in Fig. 9 for the cases of 2, 5, 15, and 100 channels. As one would expect, in the case of 100 channels, the excessive flow coming from the single restricted channel is much more easily distributed between the remaining 99 channels than the case of 2 channels. Therefore, the flow rate in the more restricted channel changes with the magnitude of the restriction much more significantly for the case with more channels.
Note that this simplified flow redistribution model is just to provide an estimate for a header fed set of parallel channels, which is aimed at demonstrating the strong correlation between GDM intrusion and flow distribution. Similar to Chen et al. [22], where the flow distribution in the PEM fuel cell stack was estimated without accounting for any electrochemistry or heat transfer, we consider isothermal dry reactant distribution. In this case, if assuming uniform compression over the active area and perfect reactant gas distribution in the manifolds, the approach can be ea
sily applied to fuel cell stacks in which GDM intrusion from channel to channel within each cell is uniform but not from cell to cell, i.e. some of the cells will have higher than nominal hydraulic resistance. For example, this can happen in fuel cell stacks where a small batch of thicker or softer GDM is mixed with a larger batch of thinner or stiffer GDM, where intrusion is similar within the same batch ofGDMbut significantly different between the two batches. According to the 100-channel case in Fig. 9, a stack comprising hundreds of cells that are operated at relatively high reactant utilization conditions (i.e. at a low stoichiometry), a 5–15% additional decrease in hydraulic diameter can cause a 20–50% decrease in flow in the cells with the most severe GDM intrusion. Therefore, if the stack is operated at relatively high reactant utilization conditions (i.e. at low stoichiometry), then the cells with the highest GDM intrusion will experience reactant starvation, which can lead to failure.

Fig. 8. Schematic of a header fed parallel-channel configuration.

Fig. 9. Reactant flow in the cell with additional blockage compared to the nominal cells.
It should be once again noted that the flow redistribution model described in this paper represents a greatly simplified model. Many aspects of this model can be further refined to better reflect the reality of a rather complicated problem. Ultimately, a two-phase flow 3D CFD model accounting for electrochemical reaction should be a better choice if required. However, the simplified model presented in this paper is believed to serve the purpose for an initial understanding of how GDMintrusion variation may contribute to the problems in fuel cell performance. It is also believed to provide useful information for the direction of further improvement in materials and flow field designs. As will be seen in the later discussion on the performance of a 30-cell fuel cell stack, the model is useful enough to explain observed cell-to-cell performance variations.
5. Results and discussions

Fig. 10. Comparison of pressure drop measurement and model calculation for GDM samples representing various mechanical property variations.
Since channel intrusion reduces the hydraulic diameter of reactant gas channels, a direct effect of channel intrusion is the increase of the reactant gas pressure drop from the inlet to outlet of a flow field. Thus, pressure drop measurement can also provide an estimate of channel intrusion and intrusion variation, and vice-versa. To measure the pressure drop, a series of flow fields with various land and channel designs were fabricated and tested. The data to be discussed in Fig. 10 were from a flow field that was composed of 6 straight channels of 300mm long, 0.4mm wide, and 0.26mm deep with a land width of 2 mm. In each measurement, a single piece of GDM was clamped between this flow field and a flat plate with an average of 1.46MPa compression. Air flow rate of 1 slpm was introduced at the inlet and pressure drop was then measured. To investigate the effect of GDM intrusion variation on pressure drops, a number of samples from several lots of another commercial gas diffusion media, dubbed GDM Y, from several production lots were used. These samples exhibit a range of mechanical property variation in compressibility (compressive strain measured at 1.2MPa of compressive pressure, slightly lower than 1.46MPa used in the pressure drop test), shear modulus, and modulus of elasticity. Fig. 10 illustrates the pressure drop versus compressive strains of various GDM samples measured at 1.2MPa of compressive pressure. The compressive strain from different lots of GDM at 1.2MPa has a range of 0.212–0.268. It is seen that the measured pressure drop increases from 44 kPa to 54 kPa as the compressive strain increases.
Although it is possible to directly calculate the pressure drop analytically, e.g., from a CFD program, it has not been attempted since the current interest is in the relative change in pressure drop for GDM with different intrusion. Instead, the hydraulic diameters of the intruded channels are estimated from the wellknownhydraulic diameter equation of a rectangular flowchannel [23]
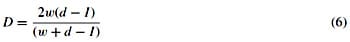
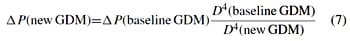
where w is the channel width; d is the channel depth; I is the GDM intrusion. Noting from Eq. (2) that the pressure drop at a fixed flow rate is inversely proportional to the fourth power of hydraulic diameter, one can use the experimentally measured pressure drop for the GDM of compressive strain of 0.218 at 1.2MPa as a baseline and then calculate the pressure drops for other GDM samples using Eq. (7):
It is seen in Fig. 10 that the calculated pressure drop agrees very well with the measured pressure drop, which further suggests the usefulness of the channel intrusion model and simplified flowmodel. The wide variation in pressure drop observed for various lots of GDM Y also demonstrates that pressure drop is indeed very sensitive to the GDM channel intrusion variation, which is the consequence of GDM property and thickness variations.
Fig. 11 illustrates the sensitivity of the reactant gas flow, expressed in fraction of the nominal flow, in the channels with the additional GDM intrusion compared to the nominal channels. A flow field of 1 mm-wide channel and 2 mm-wide land is used for this study. Four cases are considered with increasing deviations in compressive strain, thickness, shear modulus, and modulus of elasticity from Case 1 to 4, which are tabulated in the insert of Fig. 11. In addition, four different channel depths of 0.25 mm, 0.5 mm, 0.75 mm, and 1mm are considered. In this example, the intrusion is calculated using the intrusion model by applying a 2.76MPa of compressive pressure over lands with GDM X. The intrusion is then used to estimate the reduction in hydraulic diameter from Eq. (6).With the normalized hydraulic diameter change e determined, the normalized flow rate in the restricted channel is calculated using Eq. (5). In the nominal case, denoted “Case 1”, the GDM X is oriented so that Dir. 1 is in the width direction of lands and channels, which results in a GDM intrusion of 0.073 mm. As expected in Fig. 11 the flow in the nominal channels is 100% for all channel depths. In Case 2, a compressive strain deviation of +0.06 at 2.76MPa is introduced to the channel of interest. At a channel depth of 1 mm, the deviation of reactant gas flow for the cell using this GDM is about 5.6%. As the channel depth decreases, the flow deviation increases. At a channel depth of 0.25 mm, the flow deviation is about 27%. In Case 3, a thickness deviation of +0.015mm is further added to Case 2 for the channel of interest, which shows a gas flow deviation of 7.6% at 1 mm-deep and 35.2% at 0.25 mm-deep channels. In Case 4, a shear modulus deviation of -5.4MPa and modulus of elasticity deviation of -600MPa are added to Case 3. Case 4 is analogous to a situation such that a few cells in a 100-cell stack use Dir. 2 of GDM X in the channel width direction while the rest of the cells use Dir. 1. In this case, one can find a flow deviation of 10.5% at 1 mm-deep and 46.3% at 0.25 mm-deep channels. Note that the deviation in compressiv
e strain, thickness, and shear modulus illustrated in Fig. 11 are not unusual. In fact, they all have been observed in the commercial GDM X from different production lots in our study.

Fig. 11. Reactant gas flow in fraction of nominal flow in the more intruded channel for four GDM with increasing deviation in compressive strain, thickness, shear modulus, and modulus of elasticity at various channel depths.
Figs. 10 and 11 provide an intriguing glimpse into how GDM properties are tightly related to flow distribution and flow field geometry. This implies that GDM manufacturers have to improve the variation to a much tighter specification. For fuel cell producers in general, there is a continual drive to operate fuel cells at as low stoichiometry as possible in order to increase the efficiency of fuel cell systems. Therefore, the threshold of performance instability is decreasing. A simple example is that if a fuel cell stack operates at 1.1 stoich and the flow rate in one of the cells drops below 90% of the nominal flow, the performance in that cell would become unstable. Thus, to use the GDM X with the given variation found in Case 4, the flow field would have to be designed with a channel depth larger than 1mm or the fuel cell would have to be operated at a stoich much higher than 1.1. Neither option is desirable when the fuel cell industry pursues an increasingly higher volumetric power density and reactant gas utilization. Therefore, it is important that GDM manufacturers can produce GDM of superior mechanical properties—higher compressive, shear, and bending stiffness while significantly tightening thickness and property variations.
To investigate the GDM intrusion effect on automotive fuel cells, a 30-cell fuel cell stack which contained equal number of GDM Y from two different production lots was tested. For convenience, the two lots are denoted as Lots A and B and the corresponding cells are called Lot A and Lot B cells. In the single fuel cell testing with 50 cm2 active area of graphite flow field and a channel depth of about 1 mm, both lots of GDM produced nominally the same polarization curves under the same fuel cell operating condition, suggesting that they had the same thermal, electrical, and mass transport properties. The only noticeable difference between the two production lots were in the mechanical properties and thickness. Under the stack compression, the intrusion of Lot A GDM is determined to be 0.069±0.006 mm. The intrusion of Lot B is 0.078±0.009 mm. It should be noted that the intrusion and its variation are calculated based on 18 samples for each lot. The intrusion value suggests that the Lot A GDM is generally stiffer than Lot B. Furthermore, the intrusion variation in Lot A is tighter than Lot B, suggesting that the mechanical properties in Lot A GDM are more consistent from sample to sample. The pressure drop measurements as discussed for Fig. 10 also support intrusion calculation since the 44 kPa pressure drop in Lot A GDM is much lower than that of 51 kPa in Lot B, also suggesting that Lot A GDM has less intrusion than Lot B. In the subsequent fuel cell testing, the 30-cell stack was tested under various cathode stoichiometry at a current density of 1.2Acm-2 to investigate the cell voltage sensitivity to cathode stoichiometry.
Fig. 12 illustrates the cell voltage of Lot A and B cells normalized with respect to the averaged cell voltage at a cathode stoichiometry of 1.8. It is seen that for all cathode stoichiometry, Lot A cells have higher mean cell voltages than those of Lot B cells, which correlates well with the lower calculated intrusion and pressure drop measurement. As the cathode stoichiometry is decreased, the separation of mean cell voltages between Lots A and B increases. Although the cell voltage variation in both lots of cells increases as the cathode stoichiometry is decreased, the variation increase in Lot B cells is much more pronounced than in Lot A. Finally, as the cathode stoichiometry dropped below 1.3, the Lot B cells became so unstable that the stack ceased to operate. To determine the performance anomaly in a fuel cell stack is often a difficult task as the number of the root cause is often more than one. In this study, it is believed that the GDM intrusion has played an important role leading to the observed stoichiometry sensitivity because the stack performance data have correlated well with the GDM intrusion data in many aspects which can be summarized as follows: (1) The higher mean cell voltage in Lot A cells than Lot B could be caused by the lower intrusion and hence, the higher flow rate in Lot A cells. (2) Since Lot B cells have worse intrusion and intrusion variation, the flow maldistribution in Lot B cells would make them increasingly sensitive to the decreased cathode flow, which leads to increasing spread in cell voltage as the cathode stoich is decreased. (3) Finally, in the few most intruded Lot B cells, the reduced overall cathode flow rate could bring the flow rate in these cells to such a low level that it impedes the ability to remove water, which could lead to the rapid decrease in cell voltage and the eventual failure of the whole stack.

Fig. 12. Cell voltage variation at various cathode stoichiometry for two different production lots of GDM Y.
6. Conclusions
The GDM intrusion in PEM fuel cells were investigated both analytically and experimentally. The mechanical behaviors of various GDM were characterized in compressive, flexural, and shear tests and used in a finite element-based numerical model to calculate the channel intrusion of GDM. To measure the intrusion ex situ and to validate the model calculation, a test fixture with a 1mm slot was devised to measure and to simulate the intrusion of GDM in a flow field with 1 mm-wide channel. Intrusion of six types of GDM from four manufacturers were measured and compared with the model calculation. Excellent agreement was found among these samples in spite of a wide range of GDM type and mechanical property, suggesting the material tests adapted in this study could be useful tools for GDM manufacturers in product development and quality control. To investigate the effect of GDM intrusion on the fuel cell performance, a simplified flow redistribution model was developed, which showed that a 20% flow reduction could be induced if reactant gas channels were to have an additional 5% intrusion beyond that of the nominal ones.
Combining the flowredistribution model and theGDMintrusion model, a parametric study was conducted to investigate the impact of GDM material properties and flow field geometry on the reactant flow distribution. The study showed that for flow fields with a smaller channel depth, the reactant gas flow could be very sensitive to the variation in GDM thickness, compressibility, shear modulus, and modulus of elasticity. Within the measured variation in a commercially available GDM, it was found that the reduction of reactant gas flow could range from 10.5% for the flow field with 1 mm-deep channels to 46% for the one with 0.25 mm-deep channels.
When a set of GDM from two different production lots was used in the performance testing of a 30-cell fuel cell stack, it was found that the cells with the GDM lot of higher intrusion not only had lower cell voltage but also higher cell-to-cell voltage variation. Itwas concluded that theGDMintrusion and intrusion variation had contributed to the anomalous behavior of this fuel cell stack. The results from this study showed that the
product variation in GDM would need to be more tightly controlled in order to produce robust, efficient, and compact automotive fuel cells.
Acknowledgments
The authors would like to express appreciation to Dr. Julie Wang, for generating initial set of experimental data leading to this study; to Mr. Adam Cook, Mr. Paul Nicotera, and Mr. Greg Tudryn, for assistance with test fixture development and intrusion measurement; and to Mr. Dave Dobulis for fuel cell stack testing.
References
- M. Mathias, J. Roth, J. Fleming,W. Lehnert, in:W. Vielstich, H. Gasteiger, A. Lamm (Eds.), Handbook of Fuel Cells—Fundamentals, Technology and Applications, vol. 3, John Wiley & Sons, Ltd., 2003.
- W.-K. Lee, C.-H. Ho, J.W.V. Zee, M. Murthy, J. Power Sources 84 (1999) 45.
- S.-J. Lee, C.-D. Hsu, C.-H. Huang, J. Power Sources 145 (2005) 353–361.
- H.S. Chu, C. Yeh, F. Chen, J. Power Sources 123 (2003) 1–9.
- J. Ge, A. Higier, H. Liu, J. Power Sources 159 (2006) 922–927.
- J. Ihonen, M. Mikkola, G. Lindbergh, J. Electrochem. Soc. 151 (8) (2004) A1152–A1161.
- I. Nitta, T. Hottinen, O. Himanen, M. Mikkola, J. Power Sources 171 (1) (2007) 26–36.
- T. Hottinen, O. Himanen, S. Karvonen, I. Nitta, J. Power Sources 171 (2007) 113–121.
- Y. Zhou, G. Lin, A.J. Shih, S.J. Hu, J. Power Sources 163 (2007) 777–783.
- P. Rodatz, F. Buchi, C. Onder, L. Guzzella, J. Power Sources 128 (2004) 208–217.
- A. Acrivos, B.D. Babcock, R.L. Pigford, Chem. Eng. Sci. 10 (1959) 112–124.
- M.K. Bassiouny, H. Martin, Chem. Eng. Sci. 39 (1984) 693–700.
- F. Barrears, A. Lozano, L. Valiano, C. Marin, A. Pascau, J. Power Sources 144 (2005) 54–66.
- L.M. Grega, M. McGarry, M. Begum, The Fourth International Conference on Fuel Cell Science, Engineering and Technology, ASME paper FUELCELL2006-97073, 2006.
- S. Maharudrayya, S. Jayanti, A.P. Deshpande, J. Power Sources 144 (2005) 94–106.
- S. Maharudrayya, S. Jayanti, A.P. Deshpande, J. Power Sources 157 (2006) 358–367.
- J.-H. Koh, H.-K. Seo, C.G. Lee, Y.-S. Yoo, H.C. Lim, J. Power Sources 115 (2003) 54–65.
- J. Park, X. Li, J. Power Sources 162 (2006) 444–459.
- P.A.C. Chang, J. St-Pierre, J. Stumper, B. Wetton, J. Power Sources 162 (2006) 340–355.
- S. Basu, C.-Y.Wang, K.S. Chen, ASME J. Fuel Cell Sci. Technol., in press.
- Y.H. Lai, D.P. Miller, C. Ji, T.A. Trabold, Proceedings of FUELCELL2004, Second International ASME Conference on Fuel Cell Science, Engineering, and Technology, Rochester, NY, 2004.
- C.-H. Chen, S.-P. Jung, S.-C. Yen, J. Power Sources 173 (2007) 249–263.
- J.R. Welty, C.E. Wicks, R.E. Wilson, G.L. Rorrer, Fundamentals of Momentum, Heat, and Mass Transfer, John Wiley & Sons, New York, 2001.