Article
Related Links
Prasun K. Majumdar, Zihong Liu, John J. Lesko, Tommy Cousins
Virginia Tech, Blacksburg, VA, USA
Abstract
Fiber reinforced polymer (FRP) composites are increasingly being used in bridge deck applications. However, there are no comprehensive standards or design guidelines to characterize FRP deck systems. Current practice has mostly utilized trial and error approaches based on case studies involving laboratory tests on deck panels and field tests. One of the areas often neglected is the need for proper loading method for the FRP deck with cellular structure. It has been observed that the type of loading patch greatly influences the failure mode of cellular FRP composite deck. The contact pressure distribution of real truck loading is non-uniform with more concentration near the center of the contact area. Conversely, conventional steel patch loading on FRP composite cellular decks produces stress concentration near edges. A proposed simulated tire patch has been examined for loading on FRP deck with the load distribution characterized by pressure sensitive sensors and 3D contact analysis using ANSYS 11.0. A new conformable pressure profile has been proposed for loading on FRP composite deck systems. Proposed profile loading has been applied in FEA simulation of a cellular FRP deck panel installed at Hawthorne Street Bridge in Covington, VA. Results showed much higher strain and displacement values with proposed profile loading compared to those for uniform pressure profile. Parametric studies have also been carried out to better understand the effect of cell size. This provides additional insight to cost-effective design. Detailed experimental and finite element simulation results are documented in this paper.
Introduction
There is a growing concern for the deterioration of reinforced concrete bridges and their decks. According to the Transportation Statistics Annual Report (TSAR) [1], nearly thirty percent of 600000 US bridges are either structurally deficient (15%) or functionally obsolete (14%). To be structurally deficient and functionally obsolete means these bridges suffer from loss of material properties due to degradation and age, and are experiencing more traffic than they were originally intended for. The annual direct cost of corrosion for highway bridges is $8.3 billion and life-cycle analysis estimates indirect costs to the user due to traffic delays and lost productivity at more than 10 times the direct cost of corrosion [2]. Therefore, there is a need for cost-effective and durable technologies for bridge repair, rehabilitation and replacement.
FRP composite can provide significant advantages over conventional materials for construction of bridges such as reduction in dead load and subsequent increase in live load rating, rehabilitation of historic structure, widening of a bridge without imposing additional dead load, faster installation, reducing cost and traffic congestion, and enhanced service life even under harsh environment. The future of infrastructure can be envisioned as bright if FRP composites are implemented successfully to its full potential.
However, there are significant challenges to implement a fiber reinforced bridge deck [3], including higher initial material cost, efficient design of panel-topanel connections, lack of comprehensive standards and design guidelines, and uncertain durability characteristics under combined mechanical and environmental loads. Most researchers over the last decade have focused primarily on performance evaluation and characterization of FRP composite deck systems on a case study basis. There is little or no effort has been made to develop test methods and design guidelines for FRP composite deck.
To be cost-effective, FRP composite deck systems should be designed to meet the need at service conditions for a long period of time (usually 50-75 years). Lack of proper understanding of the structural behavior of FRP deck can lead to either over design or poor design leading to premature failure and unexpected failure modes. The key element in investigating the response of a deck is to apply proper loading in critical locations to produce the maximum load effect consistent with its application. The current practice is to follow a set of standards and guidelines to apply design wheel load uniformly distributed over a finite surface area (tire contact area) of the deck and characterize the response. This is known as “Patch loading” among bridge designers and usually applied through a rectangular steel plate or reinforced bearing pad.
The design loads and tire contact areas for patch loading on conventional bridge decks (reinforced concrete, steel and wood) are specified by the American Association of State Highway and Transportation Officials (AASHTO) and AASHTO LRFD specifications [4-5]. Many researchers have used these specifications to analyze and test FRP decks over the past years without any consideration for the differences between FRP decks and conventional bridge decks.
The important distinctions between FRP deck and conventional decks are the differences in stiffness and geometry. As a result, the load transfer mechanisms are quite different and also the response is complex due to orthotropic properties. The stress distribution profile for steel patch loading has been explored and its applicability in FRP deck systems examined. Interaction of tire with deck surface develops conformable pressure distribution which is far from uniform. A new simulated tire patch loading has been proposed which mimics the stress profile of actual truck tire. Tire contact area and contact pressure are characterized using pressure sensitive film sensors. A 3D surface-to-surface contact model has been developed using finite element software ANSYS 11.0 to approximate the conformable pressure behavior of simulated tire patch. Proposed conformable pressure profile has been applied to finite element simulation to further explore the issues and analyze response of FRP composite deck systems. The detail characterization of the proposed tire loading patch and its application to FRP bridge deck system have been documented in this paper.
Conventional Loading Method and its Applicability for FRP Deck Systems
It is commonly perceived that steel patch loading provides uniform stress distribution in FRP deck and the possible effect of relative stiffness (between deck and loading patch material) is often neglected. However, a number of researchers have reported severe localized stress concentrations along the edges of the steel loading plate and a local punching shear identified as typical mode of failure [6-8].
To further explore effect of relative stiffness, a 3D contact model has been developed. Surface-to-surface contact theories calculate
contact pressure at the interface between two contacting bodies and give quantitative information about the load transfer mechanism. For a series of test run, load has been applied through a rectangular steel plate area and the stiffness of the deck surface varied from soft (E=1msi) to stiff (E=30msi). Three example cases (Elastic equivalent solid FRP composite deck, concrete deck and a steel deck) are considered and the corresponding contact stress distributions are shown in Fig. 1. The contact stress values are normalized by average pressure (calculated as applied load divided by actual contact area). It has been observed that the stress distribution is far from uniform for soft deck system and tends towards some sort of uniformity as the stiffness of the deck increases. However, there are still significant stress concentrations near edges which might be attributed to punch shear failure mode cited in the literature.
Due to differences in stiffness, steel patch loading could not provide a uniform stress distribution in solid FRP deck (approximated elastic equivalent deck). It will be interesting to know what the distribution might be if the cellular geometry of the FRP deck system is considered. In a separate 3D finite element contact model with steel patch on a representative cellular FRP deck, it is observed that contact stress distribution is again not uniform. Moreover, there are localized peaks at the locations of vertical stiffeners and high stresses near the edges (Fig. 2). From the principles of mechanics, it is known that stresses always go through the stiffest path and the higher stresses are therefore expected at vertical stiffener location compared to center span. This phenomenon has been further explored with visualization of the differences in stress profile using pressure sensitive sensor analysis in later sections.
At this point it is evident that conventional steel or reinforced bearing patch loading can not provide uniform stress distribution for solid or cellular deck system if there is significant difference in stiffness. A relevant question is whether this effort for achieving uniform distribution of stress is realistic in actual bridge deck application or not. What is the actual in-service load profile?
Actual Truck Tire Loading Profile and Proposed Simulated Tire Patch
There has been extensive research on tire induced stress profiles and tire-pavement interaction mechanisms over the last 10 years [9-13]. Although the primary focus of those researches had been the effect on pavement, the knowledge on actual tire induced contact stress information can be useful to structural community as well. Traditional design guidelines assumed that contact stress is uniformly distributed over a rectangular or circular area and stress value is equal to tire inflation pressure. However, a number of studies including tire footprint analysis by Pottinger [9] and Stress-in-Motion (SIM) sensor analysis by de Beer [14] have demonstrated that tire induced normal contact stress is far from uniform. Contact stresses were found to be very much dependent on tire pressure, tire load, and tire type. It is also noteworthy that the behavior of truck tire is significantly different from performance tires in passenger cars. From test results of a range of truck tires, it was observed that inner treads carry significantly higher normal stress compared to out treads and for passenger car it is fairly uniform or shows only a small lateral variation. In addition to higher axle load, this observation of concentrated stress profile also explains why truck tire loading is considered severe from structural point of view. A typical truck tire contact pressure profile by Pottinger [9] is shown in Fig. 3 and it will be considered as reference in subsequent analysis.
Based on previous discussions, the possible effect of nonuniform contact pressure profile of actual truck tire on FRP composite deck systems should be investigated further. For design and performance evaluation of FRP composite deck, there is a need for a new method of loading which will be more realistic considering in service considerations and structural behavior of FRP composite deck system.
This has led to the development of a proposed simulated tire patch for loading on FRP composite decks and is expected to mimic the contact loading conditions of an actual truck tire. The simulated tire patch consists of a quarter section of a truck tire half-filled with hyperelastic silicone rubber as shown in Fig. 4. Maximum height of silicone is 3 inches at central location and the rest of the height of tire section is filled with steel plate. When load is applied on this simulated tire patch, it deforms and develops conformable pressure, and transfers load on to the FRP deck.
Characterizing Proposed Simulated Tire Patch: Experiment
For the proposed simulated tire patch to be used in evaluating performance of FRP deck systems, the behavior of this tire patch need to be characterized. Important parameters of interest are contact area and contact pressure as a function of applied load.
Experimental Procedure:
A series of tire contact tests were conducted at different load levels (5, 10, 15, 22, and 30 kips) on a 6 ft by 6 ft FRP composite deck panel manufactured by Strongwell Corporation [15] . The FRP deck is made of pultruded box shapes (6 inch by 6 inch) adhesively bonded together to form cellular structure. There are also 3/8 inch thick top and bottom plates bonded to the square tube assembly. Load was applied through simulated tire patch and a pressure sensitive film called Pressurex® [16] was placed between tire and deck surface to measure contact pressure (Fig. 5). Pressurex® is a Mylar film that contains a layer of tiny microcapsules. The application of force upon the film causes the microcapsules to rupture, producing an instantaneous and permanent high resolution “topographical” image of pressure variation across a contact area. Contact area can be measured from the footprints obtained from pressure film sensor. Even further, the color intensity of Pressurex® is directly related to the amount of pressure applied to it. The greater the pressure, the more intense is the color. Based on color intensity and pressure correlation chart, the recorded footprint of simulated tire patch was analyzed to find magnitude of tire pressure along contact path.
Pressure Sensor and Image Analysis:
A representative set of tire footprint images are shown in Fig. 6 and these images were analyzed by pixel based image processing software to map the color intensity contour. The footprint of the simulated tire showed a nonuniform contact pressure profile similar to the actual truck tire (Fig. 7). On the other hand, the normal stress contour for the bearing pad shows that stress concentrations at vertical stiffeners similar to previous results from FEA contact analysis (Fig. 2). This visualization contact pressure distribution supplements previous discussions on the need for new simulated tire patch.
The tire footprint images from Pressurex® sensor films were further developed into complete pressure contour plot using TOPAQ pressure analysis system [16]. TOPAQ system provided color coded mapping of pressure profile and magnitude between two surfaces that come into contact. With advanced statistical data of color intensity, contact pressure distribution can be obtained at any point and along any line. A representative plot showing contour map by TOPAQ along with line scan (along two edge treads and center tread) plots are shown in Fig. 8. At each applied load level, such plots are generated and average of three line scans are taken as pressure profile at that particular load level. Contact pressure plots for different load levels a
nd actual tire profile plot are summarized in Fig. 9 which again demonstrates nonuniform pressure profile characteristic of this proposed simulated tire patch.
Characterizing Proposed Simulated Tire Patch: Finite Element Contact Analysis
A three dimensional finite element model utilizing the contact theory has been developed to simulate the contact behavior of proposed tire patch loading. The deck was modeled using solid elements with quadratic shape functions and orthotropic material properties were used (Fig. 10). A simplified tire patch was modeled using higher order 18X series of solid elements in ANSYS 11.0 capable of hyper elasticity, large strain and mixed up formulation. The surface-to-surface contact algorithm was chosen to simulate the behavior along with a number of advanced analysis options to account for large deformation and Neo-Hookian hyper elastic model was used to describe nonlinear material response. The detail of finite element contact theory will not be discussed in this paper as it is well documented in ANSYS theory reference and advanced analysis guide [17].
For the simulated tire patch, it was observed that stress concentrations occurred at the central part of the contacting area. However, no concentration was observed at the contacting edges for the simulated tire patch. The contact pressure distribution is normalized with average contact pressure and compared with experimental results (Fig. 11). It is observed that both experimental data from sensor analysis and finite element predictions fall within a small range of values compared to actual tire profile. Such collapse of normalized data in a nice narrow band allow for a curve fit to obtain pressure profile which can account for variation of tire size, inflation pressure and applied loading. The proposed curve for pressure profile and contact area will be discussed in later sections.
Calculation of tire contact area:
Tire contact area is defined as length of contact path along length of tire patch multiplied by length of contact path in the tire patch width direction. Tire contact length was measured from tire footprint images obtained from sensor film analysis and also from 3D contact model using finite element method. Tire contact length is plotted as a function of applied load in Fig. 12 and the plot shows gradual increase in tire contact length with increase in applied load. Form experimental data it has been found that tire contact in width direction is fairly constant up to 30kips load and therefore tire contact width is considered to be equal to tire width. A plot of tire contact area as a function of applied load is shown in Fig. 13 for different tire width. This plot provides approximate tire contact area of simulated tire patch constructed with different sizes of tire.
Proposed Model for Tire Contact Area and Contact Pressure Profile
Based on tire contact data, a power law type curve fitting has been done to express tire contact length as a function of applied load.
Contact area, A = 7.52*P0.212 * W
Here, P = Applied load on single tire (kips) and W = Width of tire patch (inch). For applied load above 30 kips, a 10% increase in width may be used as an approximation.
Average contact pressure can be easily calculated from applied load and contact area. Average contact pressure as a function of applied load is plotted in Fig. 14 for various tire patch width.
Average contact pressure = 1000 * P / A
Normalized contact pressure profile from experimental data and finite element simulation were plotted in Fig. 11. A curve fit to those data can provide an expression of approximate contact pressure profile for the proposed simulated tire patch. The contact pressure profile can be expressed by a polynomial approximation as follows:
p = p0 + 0.1 x6 – 0.14 x5 -1.46 x4 + 0.11 x3 – 0.29 x2 + 0.02 x
Where, p0 is the intensity factor defined as max pressure divided by average pressure and in this current study p0 is equal to 1.66. However, for different stiffness of silicone rubber this factor will change. The variable x is the normalized distance defined as path distance divided by half of the total contact length and it varies from -1 to 1.
In the literature it has been stated that an increase in tire inflation pressure will decrease the tire contact area and eventually result in higher contact pressure intensity. This behavior can be achieved with simulated tire patch also by choosing a silicone with different stiffness. If the modulus of the silicone is higher, tire contact area will be less and contact pressure intensity will be higher.
Application to Cellular FRP Deck
The proposed simulated tire patch has been used in performance evaluation of FRP composite deck manufactured by Strongwell Corporation and this deck system was installed at Hawthorne Street Bridge, Covington, VA. Extensive lab testing of full scale bridge sections are conducted using the simulated tire patch [18]. From laboratory test results it has been observed that the response of the deck is substantially different under tire patch loading compared to the case when a conventional steel patch or bearing pad was used. Previous research at Virginia Tech has reported punching shear failure mode while using steel patch [19-20]. However, using the simulated tire patch, a transverse tension failure was observed at the top flange of the tube of the cellular deck [18]. This difference in failure mode (Fig. 16) can be attributed to the fact that stress-strain distribution for tire patch loading is quite different than uniform patch loading. The simulated tire patch provides more localized effects on the deck. This difference in failure mode indicates completely different damage accumulation areas on the deck and this will affect long term performance of the deck.
In this current study, the proposed pressure profile has been used as input to finite element model of a 6 ft by 6 ft cellular FRP composite deck panel (Fig. 15). The deck is modeled using higher order solid elements (solid95 in ANSYS 11.0) and the conformable pressure profile applied though user defined programming feature using ANSYS Parametric Design Language (APDL). The response of the deck panel from finite element simulation is compared with experimental results obtained using proposed tire patch. A representative displacement response for applied load of 47 kips over double tire patch placed at 11 inch apart is summarized in Table 1. It is observed from experimental and FEA results that displacement at top flange and bottom of the deck were initially identical until 7.5 kips. However, as the load increased, the difference gradually increased and the displacement of the top flange was found 15-17% higher than displacement at the bottom of the deck at 47kips load. The response of the deck at ultimate load (94kips) is summarized in Table 2. Higher transverse strain and displacement at top flange again demonstrates local deformation characteristics of the cellular FRP deck and is consistent with failure mode result.
Parametric Study on Behavior of Cellular FRP Deck
Parametric studies have been carried out to investigate the effect of deck geometry (plate thickness and web spacing) on displacement-strain behavior. For five cases, the same normalized displacement can be achieved at the bottom of the deck by varying thickness and web spacing. However, the transverse strain at the top flange of the tube can be very different for each of those cases (Fig. 17). From this parametric study it is observed that the concept of global deflection may be inadequate for design criteria of cellular FRP composite deck. This demonstrates that local effec
ts should be considered during design of cellular FRP composite deck.
Conclusion
The contact pressure distribution of real truck loading is non-uniform with more concentration near the center of the contact area, but conventional steel patch loading produces stress concentration near edges. Due to the localization of load under the tire, conventional uniform patch loading is not suitable for performance evaluation of FRP composite deck systems with complex geometry and relatively low modulus. A new simulated tire patch has been proposed for loading on FRP deck and the load distribution has been characterized by contact area studies using pressure sensitive sensors and 3D contact analysis using finite element method. The proposed profile can be a useful design tool for performance evaluation of FRP deck. The conformable pressure profile obtained from experimental observations has been applied in FEA simulation of a cellular FRP deck. A simulated tire patch yielded larger maximum deflection and strain than the uniform patch loading. The tire patch produced significantly different failure mode (local transverse failure failure under the tire patch) compared to the punching-shear mode while using steel plate. Such difference in damage accumulation areas will contribute to long term behavior of the FRP deck. In summary the authors conclude that due to the local effects of a real tire load and relative stiffness effect, a simulated tire loading patch would be more appropriate for performance testing of FRP deck accounting for the conformable contact between the tire and the cellular FRP deck.
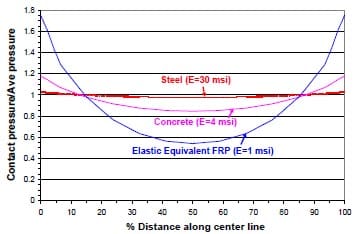
Figure 1 Contact pressure profile for Steel patch loading on deck systems with different stiffness
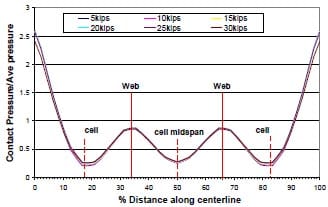
Figure 2 Contact pressure profile for steel patch loading on cellular FRP deck
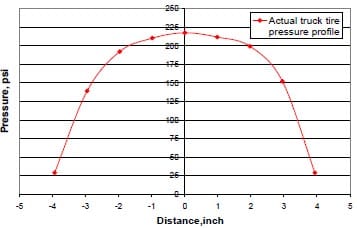
Figure 3 Truck tire (295/75R22.5) contact pressure at applied load of 6182 lb and 125 psi inflation pressure
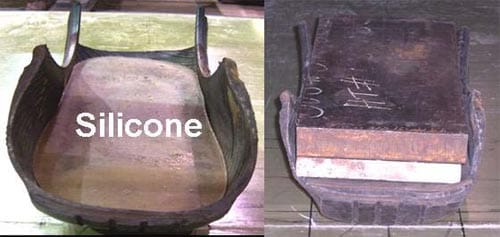
Figure 4 Proposed Simulated Tire Patch with hyper elastic silicone
Figure 5 Tire patch contact test setup and cross sectional view of Pressurex® film sensor
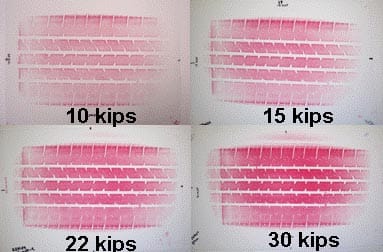
Figure 6 Simulated tire patch footprints from Pressurex® sensor film at different load levels
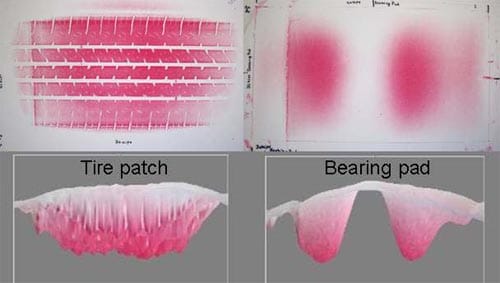
Figure 7 Contact pressure profile difference between conventional and simulated tire patch at 30 kips load
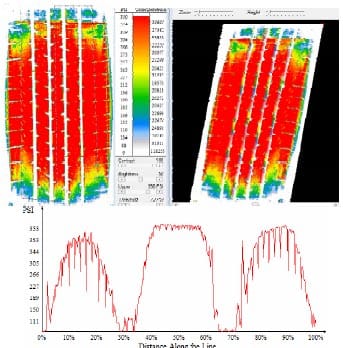
Figure 8 Contact pressure contour plot and line scan plot using TOPAQ analyzer
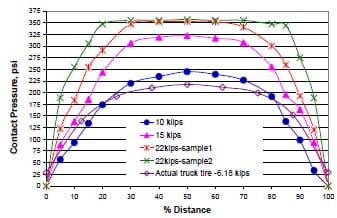
Figure 9 Contact pressure distribution at different load levels from experiment
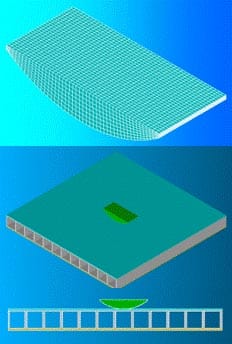
Figure 10 FEA model of the proposed tire patch contact with FRP composite deck
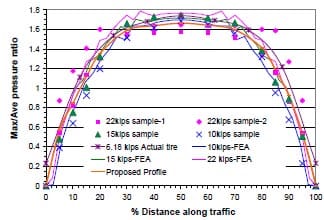
Figure 11 Normalized contact pressure distribution- Experiment vs. FEA
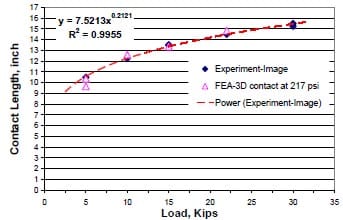
Figure 12 Contact length as a function of applied load
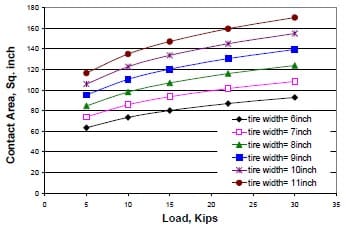
Figure 13 Variation of contact area with applied load
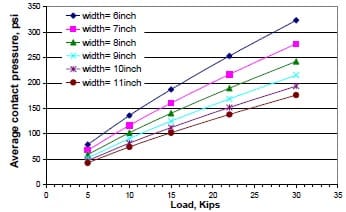
Figure 14 Tire contact pressure as function of applied load for different tire width
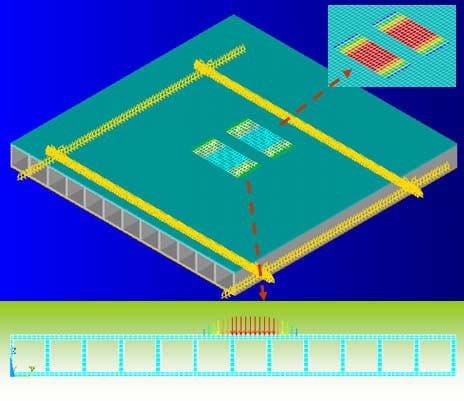
Figure 15 Proposed contact pressure profile applied to cellular FRP composite deck
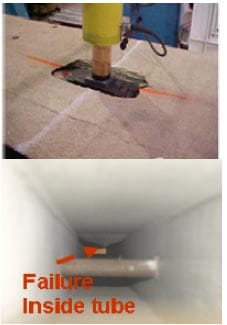
Figure 16 Failure using steel patch [19] and Tire Patch [18]
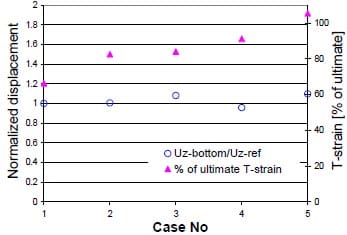
Figure 17 Effect of geometry on global displacement and local strain
| FEA | Experiment | ||
| Displacement (inch) | Tire Profile load | Uniform load over contact area | Proposed tire patch |
| Top flange of the tube | 0.222 | 0.149 | 0.214 |
| Bottom of the deck | 0.194 | 0.141 | 0.182 |
| % difference between top and bottom | 14.4 | 5.6 | 17.5 |
Table 2 – Deck response at 94kips load with double tire
| FEA | ||||
| Tire Profile load | Uniform load over contact area | AASHTO 20 by10 inch patch area | ||
| L-strain (µε) | Top | -4633 | -3066 | 117 |
| bottom | 4029 | 2872 | 3444 | |
| T-strain(µε) | Top | 10045 | 5604 | 20708 |
| bottom | 542 | 346 | 1291 | |
| Displacement (inch) | Top | 0.48 | 0.328 | -0.66 |
| bottom | 0.436 | 0.3096 | 0.399 | |
REFERENCES
- TSAR 2005. Transportation Statistics Annual Report, Federal Highway Administration and United States Department of Transportation (FHWA/USDOT), 2002.
- FHWA 2002 (FHWA-RD-01-156). Corrosion costs and preventative strategies in the United States. https://www.corrosioncost.com/pdf/main.pdf
- American Society of Civil Engineers (ASCE). Emerging Materials for Civil Infrastructure- State of the Art Review. Edited by R. A. Lopez-Anido and T. R. Naik.
- American Association of State Highway and Transportation Officials (1996), Standard Specifications for Highway Bridges. Washington, D.C.
- American Association of State Highway and Transportation Officials (1998), AASHTO LRFD Bridge Design Specifications (Second edition). Washington, D.C.
- Zhou, Aixi. Stiffness and Strength of Fiber Reinforced Polymer Composite Bridge Deck Systems. PhD Di
ssertation, Virginia Polytechnic Institute and State University, Blacksburg, Virginia. (2002). https://scholar.lib.vt.edu/theses/available/etd -10072002-164345 - Temeles, A. B.. Field and Laboratory Tests of a Proposed Bridge Deck Panel Fabricated from Pultruded Fiber- Reinforced Polymer Components. M.S. Thesis, Virginia Polytechnic Institute and State University, Blacksburg, Virginia. (2001).
- Zhou, A., Lesko, J. J., Coleman, J. T., and Cousins, T. E. (2001a), Behavior of Multicellular Orthotropic FRP Composite Bridge Deck Under Static Loadings. Proceedings of 16th Annual Technical Conference, American Society for Composites, Blacksburg, Virginia (CD-ROM).
- Pottinger, M. G., and J.E. McIntyre. Effects of Suspension Alignment and Modest Cornering on the Footprint Behavior of Performance Tires and Heavy Duty Radial Tires. Tire Science and Technology, TSTCA, Vol. 27, No. 3, 1999, pp.128-160.
- Pottinger, M. G. The Three-Dimensional Contact Path Stress Field of Solid and Pneumatic Tires. Tire Science and Technology, TSTCA, Vol. 20, No. 1, 1992, pp.3-32.
- Feng Wang. Mechanistic-empirical study of effects of truck tire pressure on asphalt pavement performance. www.lib.utexas.edu/etd/d/2005/wangf3190 3/wangf31903.pdf
- Feng Wang and Randy Machemehl. Predicting Truck Tire Pressure Effects upon Pavement Performance. Southwest Region University Transportation Center, Texas Transportation Institute. SWUTC/06/167864-1.
- See-Chew Soon, Andrew Drescher, Henryk K. Stolarski. Tire-induced surface stresses in flexible pavements. Transportation Research Board (TRB) Annual Meeting CDROM proceedings. 2003.
- de Beer, M., Fisher, C., and Jooste, F. C. Determination of Pneumatic Tire/Pavement Interface Contacts Stresses Under Moving Loads and Some effects on Pavements with Thin Asphalt Surfacing Layers. Proceedings of 8th International Conference on Asphalt Pavements, Seattle, Washington, 1997, Vol. 1, pp. 179-227.
- Strongwell Corporation, Bristol, Virginia 24203, USA. https://www.strongwell.com . 16. Sensor Products Inc. Madison, NJ 07940 USA. https://www.pressurex.com .
- ANSYS, INC. https://www.ansys.com
- P.K. Majumdar, Z. Liu, J.J.Lesko, T.E. Cousins. Evaluation of FRP Composite Deck for Bridge Rehabilitation. Published in the proceedings of SAMPE 2007 conference. June 3-7, 2007, Baltimore, Maryland.
- A. B. Temeles “Field and Laboratory Tests of a Proposed Bridge Deck Panel Fabricated from Pultruded Fiber-Reinforced Polymer Components,” M.S. Thesis, Virginia Polytechnic Institute and State University, Blacksburg, Virginia. (2001).
- J. T. Coleman. “Continuation of Field and Laboratory Tests of a Proposed Bridge Deck Panel Fabricated from Pultruded Fiber- Reinforced Polymer Components,” M.S. Thesis, Virginia Polytechnic Institute and State University, Blacksburg, VA. (2002).