Article
Related Links
Glenn Cada*, John Smith, and Jessica Busey
Environmental Sciences Division, Oak Ridge National Laboratory, Oak Ridge, Tennessee 37831, USA
Abstract
We examined the use of pressure-sensitive film (PSF) to estimate pressures experienced by fish exposed to potentially damaging mechanical and fluid structures during downstream passage at hydroelectric dams. The films responded well to a wide range of applied pressures (0.5–50 MPa), providing reliable estimates of pressures even when contained within waterproof plastic packaging, stacked under other films, and exposed at low water temperatures or low and high relative humidities. Waterproof packages of PSF were field-tested by wrapping them around polycarbonate plastic cylinders and passing them down the spillways of hydroelectric dams. Most of the spillway-passed PSF samples had marks indicating impacts. Many of the marks revealed high values of pressure (e.g., .40 MPa) that are likely to injure fish.
In many areas of fisheries management, the interactions between fish and mechanical or hydraulic structures that might lead to physical trauma must be understood. For example, fish may be injured by contact with solid structures (e.g., water intake screens, passage through pumps, pipes, and hydroelectric turbines and spillways) or fluid structures (e.g., submerged jets and shear stresses and turbulence associated with turbine discharges, spillways, boat wakes, and vessel propellers). These interactions have been studied most extensively in association with hydroelectric power production, where developing safe downstream passage for fish has been a major topic of research for decades (Wittinger et al. 1995; Carlson 2001; Cada 2001; USACE 2004).
Cada et al. (1997) described different types of mechanisms that may inflict injury to fish as they pass through a turbine: water pressure changes, shear stress, turbulence, grinding, and strike (Figure 1). In addition to changes in water pressure that are brought about by changes in depth, the rapid and extreme pressure decreases following passage through the turbine runner can injure fish by causing swim bladder distension and gas embolisms (Abernethy et al. 2001). Shear stress results from the intersection of water masses of different velocities, as occurs when water moves rapidly along a wall or when turbulent water masses collide. These stresses can be sufficient to injure and kill fish (Nietzel et al. 2000). Similar to pressure, shear stress is also expressed as force per unit area. Chaotic changes in direction and velocity of the water (turbulence) are often very great in the turbine draft tube, spillways, and tailwaters of the dam. Turbulence also exerts varying forces on a fish’s body surface.
Strike and grinding occur when a fish interacts with a solid structure in the turbine or spillway. Strike is a result of a fish colliding with structures such as the fixed stay vanes; moving runner blades; and walls in the scroll case, runner housing, and draft tube (C? ada et al. 1997). A fish experiences grinding when it is drawn through small openings between the runner housing and the runner blades, or through gaps between adjustable blades and the runner hub. Field studies of fish passage through turbines attribute localized bruises and abrasions, as well as deep cuts and decapitation, to strike and grinding. Alternative routes downstream through the dam (e.g., over spillways or intake diversion screens and bypass pipes) also pose risk to fish from contact with fluid and mechanical structures.
The severity of all potential fish injury mechanisms must be quantified to improve the environmental performance of existing turbines and the design of new turbines (C? ada 2001). Although the distribution of potentially injurious fluid forces associated with turbine passage can be predicted with computational models (e.g., Garrison et al. 2002), actual physical measurements of the hydraulic environment are difficult. Measurements of some hydraulic phenomena (pressure and acceleration) within the turbine are just beginning (Carlson and Duncan 2003). There are no published studies in which the frequency of strikes and the magnitude of forces associated with strikes, grinding, and shear stress have been measured for turbine-passed or spillway-passed fish.
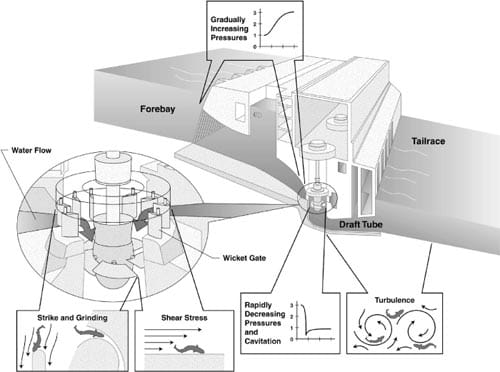
FIGURE 1. — Schematic depicting potential injury mechanisms for fish passing through a hydroelectric turbine.
Pressure-sensitive film (PSF) was developed to measure variations in pressure in industrial or medical applications. We sought to determine if PSF could be used to estimate pressures experienced by fish exposed to strike, grinding, and changes in water velocity during downstream passage at hydroelectric dams. All of these potential fish injury mechanisms can be expressed as force per unit area (pressure). If the magnitude and likelihood of these mechanisms can be measured with suitable instruments, such as PSF, and related to known effects of pressure on fish, their adverse effects can be quantified and possibly reduced.
Methods
Pressure-sensitive film detects a range of pressures resulting from either extended application of pressure, such as an increase in depth, or from momentary impulses, such as strike, grinding, or jet bursts. Application of pressure mixes two chemicals to form a pink or red stain that is instantaneous, permanent, and with an intensity proportional to the applied pressure. The PSF designed to measure low pressures is assembled in two layers in which one layer of the film contains small capsules of a chemical and the second layer is a white absorbent layer containing a second chemical that reacts with the first to form a red dye. When pressure is exerted on the film, the capsules burst and the resulting dye stains the second layer, recording the mark. The PSF for higher pressures combines both chemicals in a single layer. For both single-layer and two-layer PSF, the greater the pressure, the more capsules are burst and the darker the stain. Because the intensity of the color is directly proportional to pressure, PSF can record both the area and magnitude of applied pressure. A handheld optical densitometer measures the density of the stain, and software supplied with the instrument converts the color density into the corresponding pressure (Liggins et al. 1992).
Pressure-sensitive film is available in a range of grades (i.e., sensitivities to pressure) that detect pressures of 0.2–150 MPa. The film is not waterproof but, when placed in a waterproof package, can be used to measure pressures exerted underwater by high-speed water jets (Soyama et al. 1996).
Three grades of P
SF were tested for their sensitivities to strike: LLWfor pressures of about 0.5– 2.5 MPa, LWfor 2.5–10.0 MPa, andMWfor 10.0– 50.0 MPa. The films were cut into 15.2-cm 3 19.1- cm rectangles. We used two brands of PSF (Prescale PSF by Fuji and Pressurex® PSF by Sensor Products, Inc.), but the pressure ranges and responses of the two products are the same.
Preliminary tests.—Because PSF is not waterproof, we tested the effects of enclosing the film samples in plastic packages on pressure response. Each piece of PSF was placed in separate Kapak heavy-duty plastic pouches (wall thickness 5 0.11 mm). A set of stacked PSF was also used to examine the ability of a package containing all three film grades to measure a wider range of pressures than is possible with a single film. This was done by stacking a piece of each grade of film (MW on the bottom, LW in the middle, and LLW on the top) and placing the stack of films in a plastic pouch. Air was evacuated from the pouch by gentle pressure, and the package was sealed with a heat sealer. The temperature and relative humidity in the room were recorded. The sealed packages were placed in thick envelopes to keep out light and stored at room temperature before measuring the color density.
The response of PSF is affected by temperature and relative humidity, so the optical densitometer must be adjusted to provide accurate pressure readings for particular temperatures and relative humidities. We compared responses of PSFs to different temperature and humidity conditions by dropping wooden and metal balls on the film from known heights. A range of pressures was derived from different sizes and weights of falling balls that resulted in a range of color densities. The balls were dropped from a ring stand set 25 cm above the tabletop. Several different kinds of balls were used, ranging from 2-cm-diameter, 1.5-g wooden balls to 5-cm-diameter, 535-g chrome steel balls. After exposure to the ball drops, the films were stored in the dark for 24 h at room temperature.
To test for the film’s response at lower temperatures, sealed packages of PSF were refrigerated at 108C before testing. After experimental treatment, each package was placed back in the refrigerator in a heavy envelope for 15 min, removed, and allowed to return to room temperature. This procedure simulated the use of PSF in cold water, both before an exposure to strike and for an amount of time that would be needed to recover a PSF package after exposure. The effect of acclimating the MW grade to different relative humidities (52, 65, and 80%) before packaging was tested at a constant temperature of 238C. Normal humidity in the laboratory was about 65%. To test the effects of relative humidity, the MW film was stored in glass bell jars that contained either desiccant or a tray of water before being sealed in the waterproof package. This resulted in relative humidities of 52% and 80%, respectively.
For temperature and relative humidity tests, color density was read at least 24 h after exposure to pressure (Liggins and Finlay 1992). For each film sample we made 99 readings of stain density via a calibrated optical densitometer (Fuji Prescale Densitometer FPD-305E). Color densities were converted into pressures using the Fuji Prescale pressure analysis software. This procedure was repeated for each set of ball drops and film type.
Effects of stacking and packaging.M—To verify that the PSF accurately measured pressure when stacked together or when placed in a waterproof package, known forces were applied to the films using an Instron 4465 testing instrument with a 454-kg load cell. The Instron gradually applied force to the PSF up to a predetermined value through a 1.37-cm-diameter cylindrical metal rod. The applied force was divided by the size of the resulting color stain to derive applied pressure (MPa). The stains were always smaller than the 1.47-cm2 area of the rod, ranging from 0.84 to 1.12 cm2. The LW and MW grades of film were tested (1) singly and unpackaged, (2) singly and packaged, and (3) stacked and packaged. The LW film was stacked on top of MW film. Tests were conducted at a temperature of 238C and 50% relative humidity. Color densities were measured at least 24 h after the tests, and estimates of pressure provided by the pressure analysis software were compared with actual pressures applied by the pressure testing instrument. Pressure applications were replicated five or six times for each condition of PSF grade, packaging, and stacking. Three replicates (circular stains) were chosen for measurements based on uniformity of stain, and color density was measured 20 times on each of four replicates. Actual pressures applied by the Instron were compared with pressures estimated from measurements of the color densities.
Analysis of covariance (ANCOVA; Zar 1999) was used to test the hypothesis that the slopes of treatment regression lines were equal (i.e., whether packaging or stacking affected the PSF response). In all analyses, the dependent variable was pressure estimated from the film; the independent variable was the known pressure applied to the films. Separate regression lines were developed for packaged and unpackaged films and for stacked and unstacked films. Unequal slopes would indicate that the film did not respond the same across different levels of pressure. A perfect relationship between the independent variable (applied pressure) and dependent variable (estimated pressure) would result in a regression line with a slope of 1.0 and an intercept of 0.0, which would be expected if stacking or packaging did not affect film response. Consequently, the following hypotheses were tested: (1) slopes of treatment regression lines were equal to 1.0, and (2) intercepts of regression lines were 0.0. These two hypotheses were respectively tested with an F-test and a regression analysis (Zar 1999). Statistical Analysis System software and procedures were used for all statistical tests (SAS 2000), and for all analyses a 5 0.05.
Sensor fish application.—We used a sensor fish to examine the potentials for altering power plant design and operation to enhance safe downstream passage of fish. The sensor fish, an autonomous multisensor device that can acquire pressure and triaxial linear acceleration data during passage through severe hydraulic conditions (Carlson and Duncan 2003), measures physical conditions that fish experience during passage through hydroelectric turbines, spillways, and other high-discharge outfalls. Measuring instruments for one of the sensor fish designs are contained within a neutrally buoyant, cylindrical polycarbonate plastic tube measuring 18.8 cm long and 5.1 cm in diameter.
In August, October, and November 2002, sensor fish devices were used to collect information on water pressure and acceleration associated with passage down spillways of The Dalles and Bonneville dams on the Columbia River. Sensor fish were deployed through an injection pipe that directed them to specific areas within the spillway and subsequently retrieved in the tailrace via attached radio transmitters and balloon tags. River flow conditions and experimental procedures are detailed in Normandeau Associates et al. (2003, 2004). To assess the likelihood of strike or other potentially damaging localized pressure events, 13.3-cm 315.2-cm sheets of LW film were placed on top of MW film, heat-sealed in waterproof packaging, wrapped around the cylindrical sensor fish, and attached with nylon cable ties along the package seams. Because of the sensitivity of the PSF to impacts, care was taken in handling the PSF-wrapped cylinders to avoid inadvertent marks before release into the spillway or during retrieval. We retrieved 38 of the PSF packages following spillway passage and mailed them back to the laboratory in insulated containers that were reinforce
d and cushioned. Densities and sizes of stains caused by impacts during passage were measured in December 2002. Color density and pressure from the spillway-passed PSFs were measured by Sensor Products, Inc. using their Topaq Pressure Analysis System.
A linear regression analysis (Zar 1999) was used to test for possible relationships between the volume of water exiting the dam over the spillbay (independent variable) and the percentage of PSF area recording impacts above three values of pressure (dependent variable). There were two levels of the independent variable (individual spillbay and total spill flow rates), and three levels of the dependent variable (film areas that reflected impacts .13.8 MPa, .27.6 MPa, and .41.4 MPa). Additionally, a regression analysis was used to test for a possible relationship between the two beforementioned levels of spillway flow and the maximum impact pressures detected on the PSF samples. The null hypothesis—that the slope of the regression equaled zero—was rejected (P , 0.05). There were insufficient data to perform separate analyses for each dam; therefore, data from both dams were combined in all analyses.
Results
Preliminary tests indicated that PSF responded well to different weights dropped, regardless of temperature and relative humidity. Upon impact, a permanent red stain developed instantly. The greater the force applied, the darker the red stain on the film; these differences were apparent visually, and were readily quantified by the optical densitometer. The smallest weights (wooden balls) created faint, uneven marks on the LLW film, whereas heavier steel balls created circular stains with uniform edges, even on the MW film stacked beneath LLWand LWfilms contained in the plastic packages. Rapid formation of red stain occurred at all temperatures (23, 15, and 108C) and relative humidities (80, 65, and 52%) tested. The software that calculates pressures from the densitometer readings can be adjusted for temperature and relative humidity.
Effects of stacking and packaging.—The range of pressures applied by the Instron testing instrument was limited (Figures 2, 3), but the consistently high r2 values (≥0.95 in all tests) suggest that the performance of the films would probably be uniform across a broader range of applied pressures. Slopes for single packaged and unpackaged films were not different (F1,216 5 0.15, P 5 0.70), which indicated that packaging did not affect the films’ estimates of applied pressure (Figure 2). Slopes of regression lines for packaged film (F1,98 5 0.40, P 5 0.53) and unpackaged film (F1,118 5 0.83, P 5 0.36) did not differ significantly from 1.0, indicating that applied and estimated pressures were equal. Hence, sealing single sheets of PSF inside plastic packaging did not alter their response across the range of pressures tested. In contrast, intercepts differed significantly from zero for single sheets of both packaged film (y-intercept 5 20.83, P 5 0.04) and unpackaged film (y-intercept 5 21.56, P 5 0.01), indicating that the films slightly underestimated true pressures.
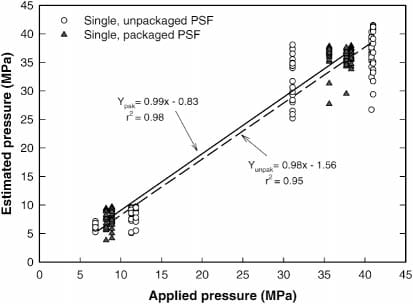
FIGURE 2.—Relationships between estimated and applied pressures of packaged (df 5 1, 98) and unpackaged (df 5 1, 118) single sections of LW (pressure sensitivity about 2.5–10.0 MPa) and MW (about 10.0–50.0 MPa) grades of pressure-sensitive film (PSF).
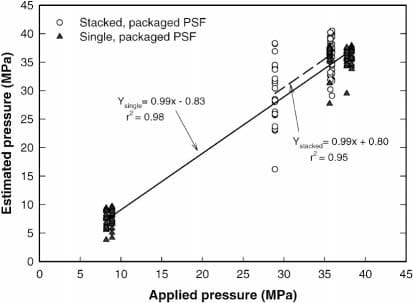
FIGURE 3.—Relationships between estimated and applied pressures of packaged stacked (df 5 1, 58) and packaged single (df 5 1, 98) sections of LW (pressure sensitivity about 2.5–10.0 MPa) and MW (about 10.0–50.0 MPa) grades of pressure-sensitive film (PSF).
Stacking LWfilm on top ofMWfilm and placing them inside a plastic package resulted in estimates of pressure that were similar to those of unstacked film (F1,156 , 0.01, P 5 0.99; Figure 3). Over the range of pressures applied, slopes did not differ significantly from 1.0 for either single, packaged films (F1,98 5 0.40, P 5 0.53) or stacked, packaged films (F1,58 , 0.01, P 5 0.97). The y-intercept for stacked, packaged film (0.80) did not differ significantly from 0.0 (P 5 0.89). These tests indicate that LW and MW film provide consistent estimates of pressure across a wide range of applied pressures, even when stacked together and sealed inside an air-evacuated plastic package.
Sensor fish application.—Thirty-eight packages of PSF containing 76 sheets of film were passed down the spillways at Bonneville and The Dalles dams. Between introduction of the sensor fish at the top of the spillway and their subsequent retrieval in the tailrace, water leaked into 10 of the packages through inadequate heat seals. However, when the PSF samples were removed and air dried at room temperature, they still showed discrete marks, similar to those in packages that did not leak. Neither smearing nor running of the red dye was evident in leaking packages.
Of the 76 PSF samples, 67 had small marks caused by strikes, and 7 of the 38 packages showed marks only on the top (LW) film. Of the 9 samples that did not have a mark, 8 were MW films, but in most cases, the MW film underlying the LW film also displayed red marks from the strike (Figure 4). Consequently, pressures associated with these marks were often greater than the range detected by LW film (i.e., maximum of 10 MPa). Pressures were recorded as low as 2.5 MPa (the lower range of the LW film) and as high as 53.1 MPa (approximately the upper range of the MW film; Table 1). There were no significant relationships between the volumes of water flowing through the spillbays and the maximum pressure measured by the PSF samples (df 5 1,15; r2 , 0.22; P . 0.05 for all analyses). Pressures were not applied to the entire surface of the PSF, but rather reflect relatively small areas of impact. Most films had multiple, small marks; as many as 15 marks were counted. Estimates of the total marked area of the film samples ranged from 0.25 to 3.75 cm2. (Table 1).
Of the 17 MW samples, 13 had marks that were caused by impacts of greater than 41.4 MPa (Table 2). These data indicate that relatively small areas of the surface of the film were exposed to high pressures during passage through spillways, presumably as a result of the sensor fish striking some structure. For these samples, the size of marks was not related to gross characteristics of the spill (rate of flow in the sampled spillbay or total spill flow: df = 1,15; r2 , 0.20; P . 0.05 for all analyses). Similarly, magnitudes of pressures were not associated with spill flow characteristics at either dam.
Discussion
Different grades of PSF responded well to a range of pressures caused by the impact from dropped balls. For example, the LLW film is sensitive enough to record slight scratches and small pressures created by the impact of a 0.9-cm-diameter, 2.7-g metal ball dropped from a height of 25 cm. The LLW film would probably be able to detect and record pressures exerted by jets and turbulent pulses of water. On the other hand, MW film was capable of measuring the impact of a 5- cm-diameter, 535-g steel ball bearing dropped from 25 cm, an impact that would undoubtedly injure fish.
To be useful for quantifying the pressures experienced by fish passing downstream through a hydroelectric turbine or spillway, the film must be packaged in a flexible, waterproof container that accurately transmits applied pressure. Also, stacking different grades of film allows measurement of a wider range of pres
sures than is possible from a single grade. Soyama et al. (1996) used PSF to estimate pressures as high as 120 MPa from the collapse of cavitation clouds, but did not describe the waterproofing material used to protect the film or whether this material affected film response. Liggins et al. (1995) sealed LLW film (0.5–2.5 MPa) in packets of self-adhesive surgical dressing and compared the response to unpackaged film. Their waterproof packet had a thickness of 60 mm, about half the thickness of the plastic packaging used in our study. Although they found significant differences between test and control film response in two of eight pressure and relative humidity combinations, data from sealed films were all within 3% of corresponding values from unpackaged film. Liggins et al. (1995) felt that sealed and unpackaged films differed little but recommended performing a separate calibration with sealed film if exact pressure resolutions are needed. Although sealing LLW films in waterproof packages has been successful, to our knowledge no one has reported stacking the films to increase the range of measurable pressures.
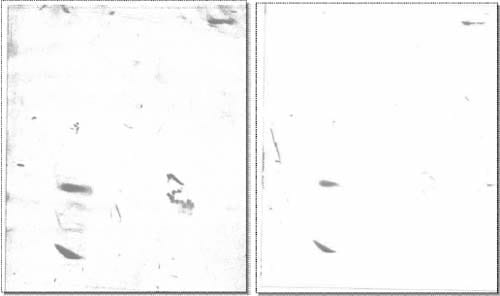
FIGURE 4.—Example of marks on LW (pressure sensitivity about 2.5–10.0 MPa; top panel) and MW (about 10.0–50.0 MPa; bottom panel) grades of pressure-sensitive film that were wrapped around a sensor fish and passed down the spillway of Bonneville Dam on August 28, 2002. The designated PSF numbers,16a and 16b (see Table 1), means that these sections of film were the sixteenth tested and were stacked together in the same package.
As noted by Liggins and Finlay (1992), the response of PSF can be affected by temperature, relative humidity, the rate at which pressure is applied, and the time between application of pressure and reading the film. Current versions of the optical densitometer and associated software are designed to correct for the effects of the first three factors, and stain densities stabilize by 24 h after application of pressure. In any case, we believe these effects to be small compared with the uncertainty about damage to a fish caused by 20 MPa versus 25 MPa. In our study, stacking two film samples and enclosing them in waterproof plastic packaging did not substantially alter the response of the LW and MW film to pressure. Thus, a wide range of pressures and impacts, probably encompassing the range that is injurious to fish, can be tested underwater.
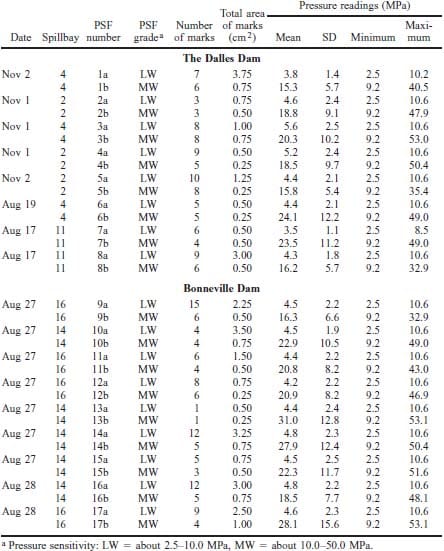
TABLE 1.—Mean, minimum, and maximum pressures associated with marks on pressure-sensitive film (PSF) passed through spillways of Bonneville and the Dalles dams in 2002. Films with common PSF numbers (e.g., 1a and 1b) were stacked together in the same package. Total area of a PSF film sample is 202 cm2.
The spillway passage tests at Bonneville and The Dalles dams also included releases of balloontagged Chinook salmon smolts. Passage conditions that resulted in the highest impact pressures at The Dalles (Table 2; November 1, 2002) coincided with higher fish mortalities and injuries (Normandeau et al. 2004). On the other hand, conditions that caused the lowest fish survival at Bonneville Dam (through spillbays 14 and 16 on August 28, 2002; Normandeau et al. 2003), did not result in unusual impact pressures in the two PSF samples that had marks (Table 1). The numbers of PSF samples used at these dams were too small to draw any conclusions about the relationship between impacts measured with PSF-wrapped cylinders and injury or mortality of spillway-passed fish. However, the results at these two dams illustrate the desirability of combining different techniques to better characterize the potential injury mechanisms experienced by fish passing through spillways: (1) PSF to detect the likelihood and magnitude of impacts, (2) instruments such as the sensor fish to measure an object’s changes in position and velocity, and (3) live fish to measure consequent injury and mortality. Ideally, all three approaches would reflect identical passage conditions by fitting a living fish with PSF and other instruments. Alternatively, separate PSF samples, instruments, and live fish could be introduced into the spillway at the same time and place, although they would take different paths through the water and therefore measure somewhat different conditions. Spillway passage is considered to be a relatively safe downstream passage route; direct injuries and mortalities often affect only a few percent of fish. Consequently, while our data suggest that spillway-passed fish may experience damaging impacts, many more PSF samples would be needed to fully characterize the probabilities and to develop a relationship between impact and response of spillway-passed fish.
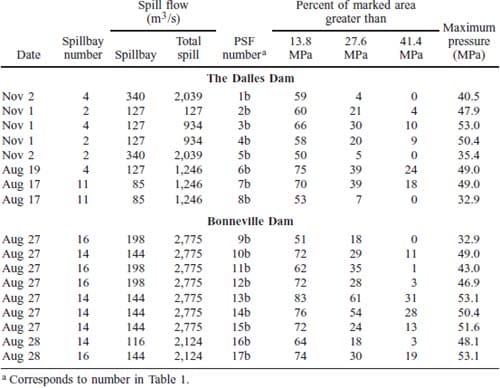
TABLE 2.—Strike test results using stacked pieces of pressure-sensitive film (PSF) applied to sensor fish and passed down spillways at the Dalles and Bonneville dams in 2002. Percentages of marked areas (not the entire surface area of the film section) on MW (pressure sensitivity about 10.0–50.0 MPa) film that were greater than the three indicated pressures are listed. Marked areas are usually small portions of the overall 202-cm2 surface area.
Some of the plastic packages that were wrapped around sensor fish and sent down spillways had small permanent dents or distortions. The PSF under those dents recorded high pressures (e.g., 40 MPa or greater). We believe that small, high-pressure impacts of this nature could cause punctures or severe bruising in fish, but little information is available to confirm such an assumption. To evaluate the effects of particular impact pressure magnitudes on particular locations on a fish, concurrent tissue-damage studies are needed. For example, what pressures cause bruising on different species and life stages of fish? Is the total surface area over which the pressure is exerted important? Is a large area of low-pressure impact as damaging as a small, but high-impact area? What areas of the fish’s body are most sensitive to an impact? Some information about the impact pressures that damage fish tissue can be found in literature related to the handling of fish for food products. For example, Jonsson et al. (2001) gradually applied pressures to Atlantic salmon fillets in a fashion similar to our PSF tests with the Instron testing instrument. They found that the yield point (at which muscle fibers began to be torn) occurred at about 48 MPa. Similarly, Sigurgisladottir et al. (1999) measured a yield or breaking point of about 40 MPa in refrigerated Atlantic salmon fillets. Such pressures were measured in many of the PSF samples that were recovered after passing down dam spillways (Tables 1, 2). Although data from food industry studies may have some relevance, it will be necessary to perform directed studies, using appropriate applications of pressures to living fish, to develop the information needed to improve the design and operation of hydraulic structures.
Studies are also needed to determine whether the downstream passage experience is different between live fish and fish-sized, rigid cylinders that may be used as a carrier for PSF. Compared with sensor fish, real fish are flexible and deformable. Deformation of fish tissue would spread an impact over a greater area of the fish body but with lower pressures per unit area at any particular point. This difference between fish tissue and rigid polycarbonate would be more significant if impact occurs against a narrow structure (like a runner blade edge) than uniformly against a flat wall. Further, live fish may, by swimming, avoid obst
ructions or mitigate impacts in the spillway, thereby reducing the likelihood or severity of impact compared to a passive cylinder. However, we believe that given the high velocities and chaotic flows in a spillway, inanimate, fish-sized and shaped objects do not differ substantially from real fish in terms of the odds of experiencing mechanical or hydraulic impacts.
All spillway-passage and turbine-passage injury mechanisms (shear stress, turbulence, changes in water pressure, grinding, and strike) can be expressed as pressure on the surface of the fish (force per unit area). Consequently, PSF is a rapid and inexpensive method to quantify downstream-passage injury. However, PSF is not capable of distinguishing among the mechanisms. That is, PSF could not be used to determine whether a given stain was caused by contact with a metal structure or a forceful jet of water. However, PSF could be used to quantify areas on the surface of an object exposed to pressures of a particular threshold value. For example, if bioassays determine that a pressure of 20.0 MPa on the general body surface will cause bruising, the area of color stains that equal and exceed that value (if any) can be summed. With enough replicates, the likelihood of exceeding the threshold value for damaging pressure (from strike, shear stress, etc.) under different downstream passage routes or different turbine operating conditions can be ascertained. Pressuresensitive film can be used to compare the injury potential of conventional versus advanced turbines or turbine passage versus other downstream passage routes (spillways, fish bypass screens and pipes, trapping and truck/barge transport).
Although our study was oriented toward assessing and mitigating the effects of hydropower operations on fish, PSF may be more broadly useful. Any situation in which fish interact with hydraulic or mechanical structures would be amenable to analysis with PSF. For example, effects of navigation vessels (shear stresses generated by the ship’s hull and propellers) have been the subject of experimental studies in which forces that are damaging to fish were estimated (Killgore et al. 2000; Maynord 2000; Keevin et al. 2002). Screens for cooling water intakes and other water diversions must not inflict damaging pressures on fish, whether from impingement or high-pressure screen washing techniques. By enabling the pressures experienced by fish to be quantified, PSF has the potential to address a variety of fisheries issues.
Acknowledgments
This research was supported by the Office of Wind and Hydropower Technologies, Office of Energy Efficiency and Renewable Energy, U.S. Department of Energy (DOE), under contract DEAC05- 00OR22725 with UT-Battelle LLC. Busey was a student at Middle Tennessee State University and participated under the aegis of the DOE Energy Research Undergraduate Laboratory Fellowship program at the Oak Ridge National Laboratory (ORNL). We thank Kitty McCracken, Mike Sale, and Linda Armstrong of ORNL’s Environmental Sciences Division for their assistance. Dixie Barker of the Metals and Ceramics Division, Oak Ridge National Laboratory, conducted the pressure validation tests with the Instron testing instrument. Tom Carlson and JoAnn Duncan of the Pacific Northwest National Laboratory performed the sensor fish tests. We thank Chuck Coutant and Mike Ryon for their reviews of the manuscript and Peggy Brookshier and John Flynn of DOE for their support and encouragement in the early development of this technique.
REFERENCES
- Abernethy, C. S., B. G. Amidan, and G. F. C? ada. 2001. Laboratory studies of the effects of pressures and dissolved gas supersaturation on turbine-passed fish. U.S. Department of Energy, Idaho Operations Office, DOE/ID-10853, Idaho Falls, Idaho.
- Cada, G. F., C. C. Coutant, and R. R. Whitney. 1997. Development of biological criteria for the design of advanced hydropower turbines. U.S. Department of Energy, Idaho Operations Office, DOE/ID-10578, Idaho Falls, Idaho.
- Cada, G. F. 2001. The development of advanced hydroelectric turbines to improve fish passage survival. Fisheries 26(9):14–23.
- Carlson, T. 2001. Proceedings of the Turbine Passage Survival Workshop. U.S. Army Corps of Engineers, Portland, Oregon.
- Carlson, T. J., and J. P. Duncan. 2003. Evolution of the sensor fish device for measuring physical conditions in severe hydraulic environments. U.S. Department of Energy, Idaho Operations Office, DOE/ID- 11079, Idaho Falls, Idaho.
- Garrison, L. A., R. K. Fisher, Jr., M. J. Sale, and G. F. Cada. 2002. Application of biological design criteria and computational fluid dynamics to investigate fish survival in turbines. Proceedings of HydroVision 2002. HCI Publications, Inc., Kansas City, Missouri.
- Jonsson, A., S. Sigurgisladottir, H. Hafsteinsson, and K. Kristbergsson. 2001. Textural properties of raw Atlantic salmon (Salmo salar) fillets measured by different methods in comparison to expressible moisture. Aquaculture Nutrition 7:81–89.
- Keevin, T. M., S. T. Maynord, S. R. Adams, and K. J. Killgore. 2002. Mortality of fish early life stages resulting from hull shear stress associated with passage of commercial navigation traffic. U.S. Army Engineer Research and Development Center, ENV Report 35, Vicksburg, Mississippi.
- Killgore, K. J., S. T. Maynord, M. D. Chan, and R. P. Morgan II. 2000. Evaluation of propeller-induced mortality on early life stages of selected fish species. U.S. Army Engineer Research and Development Center, ENV Report 30, Vicksburg, Mississippi.
- Liggins, A. B., and J. B. Finlay. 1992. Recording contact areas and pressures in joint interfaces. Pages 71– 88 in E. G. Little, editor. Experimental mechanics: technology transfer between high-tech engineering and biomechanics. Elsevier Publishers, Amsterdam.
- Liggins, A. B., J. C. E. Stranart, J. B. Finlay, and C. H. Rorabeck. 1992. Calibration and manipulation of data from Fuji pressure-sensitive film. Pages 61–70 in E. G. Little, editor. Experimental mechanics: technology transfer between high-tech engineering and biomechanics. Elsevier Publishers, Amsterdam.
- Liggins, A. B., K. Surry, and J. B. Finlay. 1995. Sealing Fuji Prescale pressure-sensitive film for protection against fluid damage: the effect on its response. Strain 31(2):57–62.
- Maynord, S. T. 2000. Concentric cylinder experiments of shear mortality of eggs and larval fish. U.S. Army Engineer Research and Development Center, ENV Report 23, Vicksburg, Mississippi.
- Nietzel, D. A., M. Richmond, D. Dauble, R. Mueller, R. Moursund, C. Abernethy, G. Guensch, and G. Cada. 2000. Laboratory studies of the effects of shear on fish: final report. U.S. Department of Energy, Idaho Operations Office, DOE/ID-10822, Idaho Falls, Idaho.
- Normandeau Associates, Inc., Mid Columbia Consulting, Inc., and J. R. Skalski. 2003. Juvenile salmonid survival and condition in passage through modified spillbays at Bonneville Dam, Columbia River. Report prepared for the U.S. Army Corps of Engineers, Portland District, Portland, Oregon.
- Normandeau Associates, Inc., Mid Columbia Consulting, Inc., and J. R. Skalski. 2004. Direct effects of differential spill volumes on mortality and injury rates of juvenile salmonids at the Dalles Dam spillway, Columbia River, in fall 2002 and spring 2003. Report prepared for U.S. Army Corps of Engineers, Portland District, Portland, Oregon.
- SAS Institute. 2000. PC SAS, version 8.02. Cary, North Carolina.
- Sigurgisladottir, S., H. Hafsteinsson, A. Jonsson, O. Lie, R. Nortvedt, M. Thomassen, and O. Torrissen. 1999. Textural properties of raw salmon fillets as related to sampling method. Journal of Food Science 64(1): 99–104.
- Soyama, H., Y. Yanauchi, K. Sato, T. Ikohagi, R. Oba, and R.
Oshima. 1996. High-speed observation of ultra-high-speed submerged water jets. Experimental Thermal and Fluid Science 12:411–416. - USACE (U.S. Army Corps of Engineers). 2004. Turbine survival program phase I report, 1997–2003. U.S. Army Corps of Engineers, Portland District, Walla Walla District, Hydroelectric Design Center, and Engineer Research and Development Center Waterways Experiment Station, Portland, Oregon.
- Wittinger, R., J. Ferguson, and T. Carlson. 1995. Proceedings: 1995 Turbine Passage Survival Workshop. U.S. Army Corps of Engineers, Portland District, Portland, Oregon.
- Zar, J. H. 1999. Biostatistical analysis, 4th edition. Prentice- Hall, Upper Saddle River, New Jersey.