Article
Related Links
A.B. Liggins and J.B. Finlay
Orthopaedic Research Laboratory, University Hospital, University of Western Ontario, London, Canada, N6A SAS
Abstract
The anatomy and physiology of the normal joint determines the distribution of contact areas and hence pressures across the interface between articular surfaces. In artificial joint replacements, these factors will be determined by the design of the individual components and any sensitivity to manufacturing tolerances or insertion technique. Simple techniques have been sought to record contact areas and interface pressure in both normal and prosthetic joints in vitro (and in vivo, if possible). This paper discusses the execution, properties, advantages and disadvantages of three recording techniques (ink staining, joint-space moulding and Fuji Prescale film) and the correlation between them.
Introduction
In any normal joint, the anatomy and physiology will determine the distribution of both contact areas (based on joint congruency) and pressures across the interface between the articular surfaces, for any flexion angle or weight bearing situation.
In an artificial replacement joint, contact areas will be determined by the topographical design of the surfaces of the articulating components. In conjunction with the altered physiology caused by the presence of the implant, there will be a non-anatomic pressure distribution. In addition, design factors such as material properties [1] or dimensional mismatch between articulating surfaces (due to inappropriate manufacturing tolerances) may reduce congruency and hence increase interface pressures.
Determination of the distribution of contact areas and pressures within both normal and artificial joints is of great interest for a number of reasons. They can be an indication of the function and biomechanics in the normal joint. Recording contact areas and pressures after pathological changes such as cartilage defects [2] or osteoarthritis [3] or operative procedures such as meniscectomy [4] can indicate additional potential problems, such as high-pressure regions likely to cause further cartilage damage or maltracking problems for the patellofemoral joint.
Most current designs of artificial replacement joints consist of metallic components articulating on components of ultra-high-molecular-weight-polyethylene (UHMWPE). The polyethylene has a suggested maximum working surface contact pressure of S MPa [S], requiring care with component design, to avoid excessive interface pressure. Methods are therefore required for determining pressure and contact area distributions at the design stage. Five methods, both readily available and custom designed, are discussed to record both contact areas and pressure distributions.
1.1. Pressure Transducers
Miniature piezoelectric polymer transducers have been set into the physiological patellar articular surface in vitro [6]. In the artificial hip replacement, an array of strain gauged pressure transducers have been built into a femoral head in vitro [7]. Piezoelectric transducers have also been described which pass into the acetabulum via holes drilled in the pelvis. These were used to record acetabular pressures from the normal femoral head or the artificial acetabular cup in vitro [8].
These systems have the advantage of recording both static and dynamic pressures; however, the spatial coverage of recordings is necessarily limited and they may require modifications to the anatomical or prosthetic structure.
1.2. X-ray Methods
Methods have been reported [9,10] whereby a joint immersed in contrast medium is loaded and a transverse radiograph is taken. Contact is indicated by a radiolucent area. Recordings can be made at several flexion angles, as the contrast medium can be evacuated and the joint washed prior to re-testing. It does, however, require a method of applying a quantitative load whilst taking the radiograph.
1.3. Dye Methods
Here, an ink or dye is applied to one articular surface. Contact with the opposing articular surface causes it to be stained by the ink, producing a pattern of the contact area. The use of this method has been reported for the physiological patellofemoral [11,12], tibiofemoral [4] and elbow [13] joints in vitro.
In the physiological joint, careful selection of the ink is required, so that it can be neutralized after each test [13], so as not to leave a permanent stain, which would make several observations difficult. The use of two different coloured dyes – Methylene Blue and Cosin Red has been reported in order to overcome this problem [4].
1.4. Casting Techniques
Several authors have described the use of casting techniques to produce a model of the joint space [3,13-1S]. A casting material, such as an acrylic polymer [14], polymethylmethacrylate (“bone cement”) [IS] or silicon rubber [3,13] is inserted into the joint. Load is applied until the material has set and the cast is removed. The application of load squeezes the casting material away from the contact areas, producing a cast in which the absence of material indicates articular contact.
This approach gives similar information to that provided by the radiographic methods and in most cases will allow the joint to be re-tested if the cast can be removed without causing damage to the joint. It has been reported, however, that when testing within the knee joint, the menisci must be removed to produce a “coherent cast shape” [IS]. One advantage is that loading can be applied using a standard compressive testing machine, rather than the custom made apparatus required for loading when using X-rays.
1.5. Pressure Sensitive Films
Three forms of pressure sensitive film have been described [2,3,5,13,16-24], one commercially available and three custom made. All three will record both interface pressures and the contact areas over which they occur.
Fuji Prescale pressure-sensitive film (Fuji Photo Co., Ltd., Japan) is a readily available two-part medium, consisting of an A-film and a C-film, both having an active coating on a polymer substrate. Equal size pieces of each film are cut and placed, with their active surfaces in contact, into the interface under test.
The active surface of the A-film consists of microscopic bubbles (2-26 μm diameter) adhered to the substrate (Fig I), within which is encapsulated a colourless liquid. On the application of pressure, a number of bubbles will be burst, depending on the pressure magnitude. The active surface of the C-film reacts with the liquid released from the A-film, producing a pink stain. The optical density at any point on this stain is related to the amount of dye absorbed at that point and hence to the pressure acting at that point; a higher pressure will produce a deeper stain.
Four grade
s of film are available, covering four pressure ranges. These have recently been upgraded to give an extended pressure range, which could lead to some confusion when reviewing the literature. Film grades and their corresponding original and current pressure-ranges are given in Table 1. These ranges are accommodated by the use of smaller sized bubbles on the A-film as the pressure range is increased.
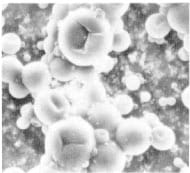
Figure 1 – SEM of Fuji A-Film
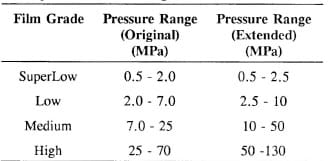
Table 1 – Fuji Film Pressure Ranges
Fuji film is sensitive to changes in ambient temperature and humidity, necessitating some form of calibration. The recommended method of pressure determination is to compare the recorded stain to a chart of samples either visually or using an optical densitometer. Pressure is read off a pressure/stain-density graph corresponding to a calibration index determined from a calibration chart utilizing the ambient temperature and relative humidity. Digital methods have also been described for producing more accurate calibration stains and analysis [2,16-19,22].
Use of this medium has been described for the hip [17], patellofemoral [16,18-20], tibiofemoral [3 , 19], ankle [19], elbow [13] and radioulnar [22] joints and for investigating the effects of osteochondral defects on cartilage interface pressures [2], all in vitro.
One custom-made pressure sensitive film uses a controlled reaction between an acid indicator and a mild acid, which are each suspended in a absorbent sheets, placed together in a composite sandwich [21]. A colour change occurs as a function of the applied pressure, for pressures between approximately 0.014 MPa and 8.3 MPa (2-1200 psi). It has been used to record pressures under the ischial tuberosity in an ischial weight bearing orthotic socket In VIVO.
The other custom-made film consists of a multi-layered sheet [23 ,24]. One layer acts as an indenter into a plastic layer, which is permanently deformed with interface pressure. Pressure distribution is determined from the indentation pattern remaining on the plastic layer after load. This device has been used to determine the pressure distributions on the tibial surface in vitro.
A comparative study between ink, casting and Fuji film techniques utilized within the elbow joint [13] has concluded that the casting method appears to be the best method for contact studies in this joint.
2. Practical Recording of Contact Area and Pressure Distributions
In order to discuss a number of techniques, reference will be made to a current study aimed at assessing the contact area and pressure distributions on the articulating surfaces of the polyethylene tibial component in a new total knee replacement. Both the upper condyles and the flat under surface were to be studied in this component, which was designed to slide on a flat tibial tray. This motion was constrained by a stud on the tray running in an anteroposterior slot in the underside of the tibial component.
2.1 Loading Technique
In vitro loading was applied using a custom-built jig mounted onto an MTS Bionix 858 universal testing machine, as shown in Fig 2 (with Fuji film shown in-situ on the upper and lower tibial aspects). An aluminium yoke, the lower arms of which can be seen in Fig 2, was attached to the actuator of the MTS machine via a self-centring joint to reduce eccentric loading. The femoral component of the artificial knee replacement was mounted onto an aluminium block, utilizing the threaded holes in its internal surface which would normally be used for the attachment of locating pegs. This block was in turn attached to two steel axle units which inserted into the arms of the yoke, allowing rotation of the femoral component to any desired flexion angle. It was locked in position by a locking bolt acting on one axle. A protractor was provided on one axle to provide measurement of flexion angle.
One surface of a 90 mm x 90 mm x 90 mm urethane foam block (Pacific Plastics Research Laboratories, Vashon Island, WA, USA) was machined to allow insertion of the metallic tibial tray component, giving a flush fit to the surface of the block. The urethane material was chosen for its relatively uniform material properties and an elastic modulus close to those reported for tibial cancellous bone [25]. The block was placed on the upper surface of a 20 kN load cell, which was bolted to the table of the MTS machine.
A pressure/contact area assessment technique could then be applied to the system, during which the polyethylene tibial plateau was inserted and the joint loaded.
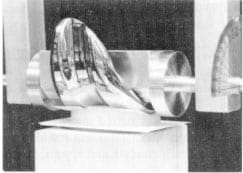
Figure 2 Tibiofemoral Loading Jig
2.2. Recording Techniques
2.2.1. Ink Staining
The MTS actuator was raised and the femoral component rotated to approximately 1200 of flexion. The tibial tray was removed and placed on a drape. Both were then liberally sprayed with Crown 6001 “Blue Toolmaker’s Ink” (Crown Industrial Products Co., Hebron, IL, 60034, USA).
The system was re-assembled and the femoral component set to the desired flexion angle. The actuator was carefully lowered, checking alignment of the femoral and tibial plateau componcnts by eye, until light contact was achieved. A 1 or 2 kN load was applied under a loading cycle of one-minute ramp to maximum load, one-minute hold at maximum load and one-minute ramp down to zero load.
This procedure created a blue stain on both upper and lower surfaces of the polyethylene component. Images, such as that shown in Fig 3 for the lower plateau surface at 300 of flexion and 2 kN load, were captured using a copy-stand-mounted CCD video camera linked to a personal computer (PC) running ImagePro Plus image-capture and analysis software (Media Cybernetics Inc., Silver Spring, MD 20910, USA). From here, the contact area could be assessed using the “Auto Area Trace” routine within ImagePro Plus. Contact-area distribution could also be assessed qualitatively by visual inspection.
After testing, all metallic surfaces were cleaned with acetone to remove any traces of blue ink. Polyethylene surfaces were cleaned with a water dampened cloth.
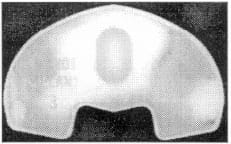
Figure 3 Digitized Image of Blue Stain
2.2.2. Polymethylmethacrylate Casts
This technique was only used on the upper condylar surfaces of the polyethylene component due to difficulties in obtaining substantial casts from the lower surfaces.
The actuator was first raised and the femoral component locked in the desired angle of flexion . Approximately five ounces of polymethylmethacrylate (PMMA) powder were poured into a container suitable for mixing. Liquid monomer was stirred into the powder until a relatively thin solution was produced. A 5 ml syringe (needleless) was loaded with this mixture and was used to place approximately 2 ml on each condyle and approximately 1 ml on the intercondylar protuberance.
The actuator was lowered, again checking the alignment of the femoral and tibial plateau components visually, until light contact was made. The joint was then loaded to either 1 or 2 kN under a regime of one-minute ramped load/unload and five minutes hold at peak load. The actuator was raised, leaving the cast on the polyethylene component. The cast was gently removed, taking great care, since they could be extremely fragile.
It was not found necessary to use any form of releasing agent on the joint components as no adhesion to either the metallic or polyet
hylene components was encountered.
The white cast was placed on a black background, which was found to give the best contrast when recorded with the image processing system (fig 4). The area of contact, indicated by cast translucency, could again be assessed using the “Auto Area Trace” facility on the ImagePro Plus software.
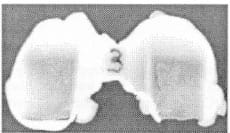
Figure 4 – Digitized Image of PMMA Cast
2.2.3. Fuji Prescale Pressure-Sensitive Film
Our approach to the use of Fuji Prescale pressure-sensitive film was similar to those described previously for calibration and digital image enhancement [2,16-19,22]. The film was calibrated using the apparatus shown in Fig 5. The base plate was placed on a reference surface, which in tum was placed on the table of the MTS bionix 858 universal testing machine. The upper surface of the baseplate was dusted with compressed air to remove any particles. Pieces of Fuji A- and C-tilm, approximately 25 mm square, were first dusted and then placed on the baseplate, with their active surfaces in contact. The 25.39 mm diameter calibration punch was similarly dusted and carefully placed on the film. Load was applicd to the punch using the actuator via a 15 kN load cell (attached to the actuator) and a ball bearing (resting on top of the calibration punch) to reduce eccentric loading effects.
Up to fifteen loads (from across the documented range of the particular grade of film being used [26]) were applied to consecutive pieces of Fuji film under ‘load control’ from Lhe MTS controller. This procedure gave a regime of one-minute ramp to full load, oncminute hold at that load and one-minute ramp down to zero load. AU loads were recorded for later use. Since this medium is sensitive to changes in temperature and relative humidity, these were also recorded; tests were aborted for changes of ±3°C or ±3% relative humidity. Stains were indexed and stored in an envelope.
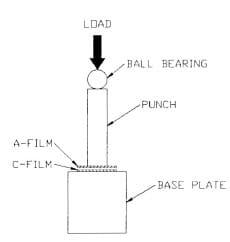
Figure 5 – Fuji Film Calibration Apparatus
Testing was conducted immediately after this procedure to reduce the effect of temperature and humidity fluctuations. Two sets of Fuji film pieces (with equal numbers of both A- and C-film pieces) were cut – strips for the upper condyles and rectangular sections with a hole punched out to accommodate the location stud on the surface of the tibial tray. The tibiofemoral loading jig was mounted on the MTS, the actuator raised and the femoral component set to the desired flexion angle. Rectangular pieces of A- and C-film were laid on the tibial tray, with their active surfaces in contact. The polyethylene component was carefully placed on top of this arrangement. The femoral component was lowered to within 3 mOl of the polyethylene component and the tibial section aligned visually by moving the urethane block on the reference surface. Strips of Fuji A- and C-film were placed on the tibial condyles, slipping them into the gap between the femoral and tibial plateau components. The actuator was lowered under load control until a pre-load condition of approximately 10 N was achieved. The system was then loaded to either 1 or 2 kN, using the one-minute load/hold/unload cycle times, as for the calibration stains.
During the “hold” section of the load cycle, the outline of the polyethylene compenent was traced onto the rectangular Fuji film section using a sharp pl astic indenter, to give a reference border on the stain. No adequate method was found for achieving a similar effect on the condylar pieces of film.
On completion of the load cycle, the actuator was raised and the Fuji stains carefully removed, indexed and stored in an envelope. Both calibration and test stains were digitized at the same time, as there was some question as to the stability of stain density with time after loading, as will be discussed later. The digitization system described above was used, running ImagePro II software (which prcceded fmagePro Plus), since additional software had been custom-written for this version. This addition took the form of a user module for image enhancement which requires modification to run within ImagePro Plus. The CCD video camera was set up so that 10 mm spanned 100 pixels horizontally. The mean pixel value of a 190 pixel x 190 pixel box from within each calibration stain was recorded and used in conjunction with the load data and punch dimensions to produce a pressure/pixel value graph on Sigma Plot Software, version 4.1 (Jandel Scientific, Corte Madera, CA 94925, USA), as shown in Fig 6. Note that pixel value decreases with increasing optical density – pure black returns a value of 0 and pure white returns a value of 255. A fifthorder regression was fitted to the data points and the corresponding coefficients transferred back to the custom user module within ImagePro II. This module was used to convert the original test images into false-colour pressure maps.
Figure 6 – Typical Pressure/Pixel Value Graph For SuperLow Fuji Film
Fig 7 shows a false-colour map from a section of the lower plateau surface, complete with a key relating colour to pixel value. The key included some values beyond the manufacturer’s recommended pressure range to allow for any temperature/humidity effects or further upgrades in film specifications. A colour was also included to indicate areas above the calibrated range (limit exceeded)
Fig 7 also illustrates that the stains recorded from under the plateau component proved to be too large to record at the chosen camera setting. It was found that raising the camera to the height required to obtain a full frame image of the lower plaleau surface made obtaining pixel values from the calibration stains difficult and also necessarily reduced the spatial resolution of all subsequent procedures. Therefore, these stains were digitized in quarters and the four separate images pieced together, if required.
The camera was then raised and full frame images captured for use within ImagePro Plus, as shown in Fig 8, which is an image of the lower tibial plateau surface at 30o of flexion and 2 kN load (the same conditions as for Fig 3). Again, the “Auto Area Trace” routine was applied to the captured images in order to record contact areas on the upper and lower surfaces of the polyethylene component.
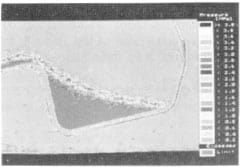
Figure 7 – False Colour Rendition of Fuji Film
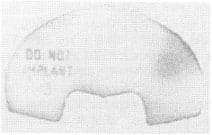
Figure 8 – Digitized Image of Fuji Film Stain
3. Results and Observations
3.1. Ease of Use
Ink staining provided a very quick method of contact measurement with few complications and, since artificial components were used, cleaning surfaces for fe-testing posed no problems.
Po]ymethylmcthacrylate casts proved to be fairly straight-forward to produce; however, great care had to be exercised in their removal since they could be extremely fragile. Releasing agent was not found necessary as there was no evidence of the PMMA adhering to either surface; however, problems were found to arise if excess PMMA flowed over the edges of the condyles. Once set, this would create an obstacle requiring prying of the cast from the tibial plateau; this operation resulted in the demise of several casts and minor cracks in others which survived. It was found that even under 2 kN load, the PMMA was not necessarily forced completely away from th
e contact site, making identification of a sharp transition at the limits of contact very difficult, even after image manipulation within ImagePro Plus.
Further problems were experienced when lighting the PMMA casts for digital image capture. The reflective nature of this material produced bright spots which interfered with the subsequent image processing. This problem was cured by using a diffuser between the light source and the cast; however, this procedure reduced the light levels, as the camera lens aperture was opened up to f2 from fit, thereby reducing the depth of field.
The main drawback with using Fuji film was the calibration procedure which was required prior to testing in order to give quantitative pressure recordings in addition to the contact area. This process, including the taking of calibration stains, additional digitizing time, the transfer of data to and from Sigma Plot and the conversion of test stains to false colour images produced an additional experimental time of at least three hours. Thus the technique was somewhat time consuming.
The film itself should be handled extremely carefully due to its pressure sensitive nature. All pieces of film were cut larger than required to allow an area which could be handled with forceps. Care also had to be taken when cutting this medium.
Difficulty arises when attempting to place Fuji film sheets into a complex threedimensional interface as it tends to crinkle, causing apparent high-pressure regions to appear on the final stain. While methods for “crinkle artefact” removal have been described [2], it has been found that a simpler method is to cut the Fuji film in a two-dimensional projection of the three-dimensional contact surface. This procedure was not required for the example discussed, since the tibial condyles were essentially a uniplanar curve; however, this technique has been used on the saddle-shaped patellofemoral joint of the same knee replacement and on a hip, in a similar manner to that described previously [17].
Difficulty was often experienced when using the “Auto Trace” Routine within ImagePro Plus, since Fuji film stains are granular in nature, due to their being composed of a combination of stains from the ink of many bubbles.
3.2. Typical Results
3.2.1. Contact Area Measurements
Figs 9 and 10 show data recorded from the tibial condyles using Blue staining, Fuji film and PMMA casting respectively at 90° of flexion and 2 kN load. From these figures, several observations can be made. The first point of note is that nature of the blue staining and PMMA casting methods allowed the positions of the contact areas relative to the polyethylene plateau component to be defined. With the Fuji film stains, however, it was difficult to index the stain position to the plateau geometry since no landmarks are visible. While a border was marked on the film under the plateau, the geometry of the contacting components on the condyle made it difficult to produce any indexing marks.
The Fuji film results appear to indicate symmetrical loading between the condyles with a horizontal band of non-contact on each, indicating a poor intersection between the curved posterior section of the condyle and the flat (angled) anterior section. When comparing these findings to the results from blue stains, the right hand condyle (as seen in Figs 9 and 10) gave a similar result for both, although evidence can be seen of an uneven application of ink, leading to fast drying areas on the femoral condyles which leave gaps in the overall stain. A similar pattern can be seen on the PMMA cast as a translucent area. A non-contact area may be indicated by the opaque region on the lower right side of the translucent contact area. Contact areas, as indicated by Auto Area Traces of digitized images from each of these methods are given in Table 2, as a percentage of the total area on one condyle (available contact area). It should be noted that vertical distances in these views of the blue stains and PMMA cast will be fore-shortened, due to the effect of looking down at a curved surface, whereas the Fuji stain is essentially a flattened image from that surface. Consequently, areas calculated from the blue stains and PMMA casts will be under-estimates.
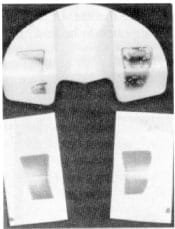
Figure 9 – Typical Blue Ink and Fuji Film Stains
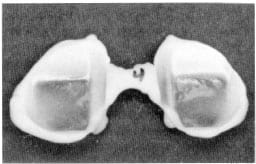
Figure 10 – Typical PMMA Cast
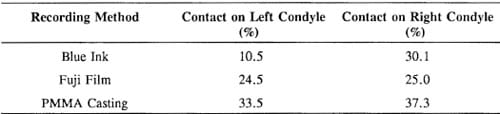
Table 2 – Indicated Contact Areas For Blue Ink, Fuji Film and PMMA Cast Recordings at 90o Flexion and 2kN Load
The uniformity of the results from the Fuji film and the PMMA cast suggest that the blue ink stain is in error. This was a consistent problem with this method when applied to the tibial condyles; it appeared to be related to the adhesion properties of the drying ink when applied to the smooth polyethylene surface. One solution was to ensure that a thick coat of ink was applied to the femoral condyles; however, this tcnded to cause ink to spread on the contact surface, as can be seen on the lower left in stain in Fig 9.
Looking at the results for the right condyle, it can be seen that the blue stain and PMMA cast return a greater area than for the Fuji film stain, even with fore-shortened vertical distances, giving a variation of 12.3%, which will be an under-estimate. A number of observations have been made which may account for variations between methods.
As mentioned above, blue ink could be subject to some spreading, giving a slightly larger stain than the contact area, particularly if a large amount of ink was being used to over-corne adhesion problems. The edge of the contact area was very difficult to asses from a PMMA cast, even with digital image enhancement, particularly since the PMMA was not totally removed from the contact site. Both of these phenomena appeared to be leading to over-estimation of the contact area.
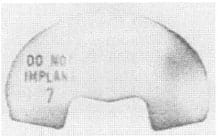
Figure 11 – Fuji Film Stain from Lower Plateau Surface
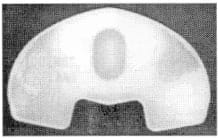
Figure 12 – Blue Ink Stain from Lower Plateau Surface
Two problems have been observed when using Fuji film stains for contact area measurement. As has been noted previously [13], Fuji film will only give a stain for pressures above the minimum pressure limit for the grade of film in use. Assuming that a pressure gradient occurs towards the edge of the contact area, which would be expected with a metallic component on polyethylene, the film’s response will end at a point inside this edge. Therefore, an artificially small contact area will be recorded. For this reason, results from the SuperLow film stains were analyzed, reducing the pressure threshold to at least 0.5 MPa. Low pressure edges caused a low level, granular, response from the Fuji film, making it extremely difficult to locate the edges of the contact area and impossible for digital manipulation of the image to allow the” Auto Area Trace” to be used. This effect can be seen in Fig 11, for the lower plateau surface at 90° of flexion and 2 kN load. Fig 12 shows the same contact conditions as recorded by the blue ink stain method and digitized in preparation for area tracing with ImagePro Plus. Since the lower plateau surfaces had a “frosted” finish, a granular effect was also seen with the blue ink, leading to area tracing problems; however, adhesion problems were not observed with this surface. These figures also cle
arly illustrate the threshold effect of Fuji Film; while this medium has clearly identified the “DO NOT IMPLANT” stamp on this sample plateau as a high pressure region, the contact area around this region is more apparent on the blue ink stain.
3.2.2. Pressure Measurements
Use of the calibration and digitization system allowed us to produce pressure maps with the characteristics shown in Table 3, for the extended version of SuperLow film and the original versions of Low and High film. One drawback to this method was that differenl grades of film were used to analyze discrete pressure ranges. This could be a problem if the observed interface pressures extended beyond the range of one or more grades of film. Our solution was to produce false colour palettes covering several grades of film; a palette was developed for the above tests covering both SuperLow and Low film grades, as indicated in Table 3.
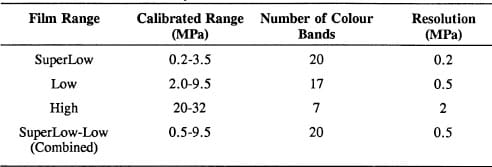
Table 3 – False Colour Palettes Currently Available
A number of observations have been made, which may be of use for other users of this medium. When considering these, it should be noted that, when analyzing the repeatability of the digitization system, no significant difference (p=0.5) was found for multiple recordings of the same calibration stain. When testing a number of stains taken at the same load, the maximum error observed in mean pixel value was 1.4% for a number of loads across the calibration range.
If mean pixel readings were taken from a typical calibration stain over different sized analysis areas, they did not fluctuate greatly for areas above 5 pixels x 5 pixels (0.5 mm x 0.5 mm). Table 4 gives data for a stain taken at 0.6 MPa on SuperLow film. This pressure, at the low end of the film’s range, produced a granular stain of discrete dots of colour. The error, compared to the standard 190 pixel x 190 pixel (19 mm x 19 mm) area of analysis is also provided, these figures being typical for stains produced by pressures across the film’s range. These errors cause pressure reading fluctuations well within the resolution of the false colour palettes.
Table 4 – Mean Pixel Value for a Decreasing Area of Analysis
Small fluctuations in temperature and humidity have been observed to have a noticeable effect on the film’s response. Typical results illustrating this point are shown in Fig 13. Further documentation of these effects will be required before drawing any significant conclusions on the effects of temperature and humidity, however.
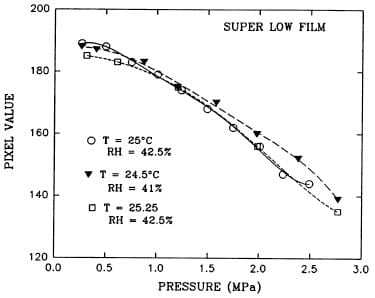
Figure 13 – Temperature and Humidity Effects on the Response of SuperLow Fuji Film
The charts supplied with Fuji Film [26] imply that denser stains will be produced when load is applied over a greater time; however, on examination of this effect, the reverse was found. Fig 14 shows the results for a simple trial of five data points across the pressure range of SuperLow film. It should be remembered that pixel value has an inverse relationship to optical density within ImagePro II. Similar results have currently been observed with Low and Medium grade films.
Stains which had been taken at 0.7, 1.2 and 2.0 MPa on SuperLow Film were digitized and analyzed at a number of time intervals from the initial stain creation. From the typical results shown in Fig 15, it can be seen that gross fluctuations in mean pixel value occurred over the first twenty-four hours, with a general trend towards a darkening (reduction in pixel value) of the stain. Fortunately, all other experiments have required stain digitization at least twenty-four hours after the test procedure due to time constraints on MTS use.
Finally, when using this medium, it should be noted that it has a finite thickness (approximately 0.2 mm) and as such will interfere with the interface into which it is inserted, particularly if this is composed of complex three-dimensional surfaces. Further work is required to quantify these effects.
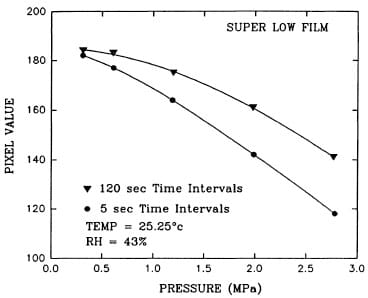
Figure 14 – The Effect of Load Time Intervals on Fuji Film Response
Figure 15 – Mean Pixel Value Against Time After Stain Creation for SuperLow Fuji Film
4. Summary
The three methods for recording contact area and/or pressure distributions each have their own advantages and disadvantages.
Fuji film is the most appealing medium, since this is a straight-forward, completely dry method, which will return both pressure and contact area data. Difficulties exist, however, in recording contact areas with a shallow pressure gradient at the edge; the granular form of this edge makes analysis difficult, while the lower pressure threshold of the film will cause gross under-estimation of the contact edge. Since the latter effect can be expected to some degree in all cases, Super Low film should be used.
Calibration of Fuji film for pressure readings is time consuming and subject to a number of variables which require careful development of the test protocol.
Indexing of the stains to the contact surface may also be difficult. Blue staining can suffer from adhesion problems on certain surfaces, although this feature has not been reported for physiological joints. The stain may also spread if too much ink is applied, leading to over-estimation of contact area. For contact areas with high pressure-gradients at their edges, stains are produced which are easily traced automatically.
Polymethylmethacrylate casts have the advantage that they can be re-applied to the contacting components, giving a direct visualization of contact area positions. The major disadvantage to this method is the difficulty in locating the edge of the contact area, even when using sophisticated image processing equipment. This limitation tends to lead to over estimation of the contact area.
Previously, predominantly qualitative methods were used to assess contact areas and pressures for the media presented here, such as the simple system suggested by Fuji for its Prescale film. Image processing allows for the straight-forward quantitative analysis of contact areas and false colour rendering of pressure stains; however, these analyses run into problems when the borders of a contact area are not clearly defined.
References
- P. Cripton and J.T. Bryant, Effect of UHMWPe Young’s modulus on contact stress in low conformity joint prostheses, Proc. Can. Biomater. Soc, (1991) 22-23.
- T.D. Brown, D.F. Pope, J.E. Hale, J.A. Buckwater and RA. Brand, Effects of osteochondral defect size on cartilage contact stress, J. Orthop. Res., 9(4) (1991) 559-567.
- T. Fukubayashi and H. Kurosawa, The contact area and pressure distribution pattern of the knee: A study of normal and osteoarthrotic knees, Acta Orthop. Scand., 51 (1980) 871-879.
- W.R Krause, M.H. Pope, RJ. Johnson and D.G. Wilder, Mechanical changes in the knee after meniscectomy, J. Bone and Joint Surg., 58A (5) (1976) 599-604.
- M.J. Pappas, G. Makris and F.F. Buechel, Contact stresses in metal-plastic total knee replacements: A theoretical and experimental study, Biomed. Eng. Tech. Report, (1986) 1-7.
- M. Manouel, H.S. Pearlman, A. Belakhlef and T.D. Brown, Minature implantable piezoelectric polymer transducer for in vitro measurement of dynamic contact pressure distribution in the pate
llofemoraljoint, Orthop. Trans., 15(2) (1991) 546-547. (Abstract) - P.D. Rushfeldt, RW. Mann and W.H. Harris, Improved techniques for measuring in vitro the geometry and pressure distribution in the human acetabulum – II. Instrumented endoprosthesis measurement of articular surface pressure distribution, J. Biomech., 14(5) (1981) 315-323.
- P. Christel, P. Derethe and L. Sedel, Periacetabular pressure recording using a hip simulator, Acta Orthop. Bel., 46(6) (1980) 647-661.
- D.B. Kettelkamp and A.W. Jacobs, Tibiofemoral contact area – Determination and implications, J. Bone and Joint Surg., 54A(2) (1972) 349-356.
- P.G. Maquet, A.J. Van De Berg and J.C. Simonet, Femorotibial weight-bearing areas, J. Bone and Joint Surg., 57A(6) (1975) 766-771.
- L.S. Matthews, D.A. Sonstegard and J.A. Henke, Load bearing characteristics of the patello-femoral joint, Acta Orthop. Scand., 48 (1977) 511-516.
- P.R Townsend and RM. Rose, The biomechanics of the human patella and implications for chondromalacia, J. Biomech., 10 (1977) 403-407.
- T.J. Stormont, K.N. An, B.F. Morrey and E.Y. Chao, Elbow joint contact study: Comparison of techniques, J. Biomech., 18(5) (1985) 329-336.
- W.H. Simon, Scale effects in animal joints, Arth. Rheum., 13(3) (1970) 244-255.
- P.S. Walker and J.V. Hajek, The load-bearing area in the knee joint, J. Biomech., 5 (1972) 581-589.
- R.C. Haut, Contact pressures in the patellofemoral joint during impact loading on the human flexed knee, J. Orthop. Res., 7 (2) (1989) 272-280.
- N.Y.P. Afoke, P.D. Byers and W.C. Hutton, Contact presures in the human hip joint, J. Bone and Joint Surg., 69B(4) (1987) 536-541.
- H.J. Hehne, H. Haberland, W. Hultzsch and W. Jantz, Measurements of two dimensional pressure distributions and contact areas of a joint using a pressure sensitive foil. In: Biomechanics: Principles and applications, R. Huiskes, D.H. Van Campen and J.R De Wijn (eds.), Martinus Nijhoff, The Hague, (1982) 197-203.
- H.J. Hehne, E. Ficker, W. Jantz, D. Mahr and H.J. Schopf, A new method for measurements of pressure distributions and contact areas in joints, Morphol. Med., 1 (1981) 95-106.
- H.H. Huberti and W.C. Hayes, Patellofemoral contact pressures; The influence of Q-Angle and Tendofemoral contact, J. Bone and Joint Surg., 66A(5) (1984) 715-723.
- W. Frisina and H.R. Lehneis, Pressure Mapping: A preliminary report, J. Biomech., 3 (1970) 526-528. .
- F.W. Werner, D.J. Murphy and A.K. Palmer, Pressures in the distal radioulnar joint: Effect of surgical procedures used for Kienbock’s disease, J. Orthop. Res., 7 (1989) 445-450.
- A.M. Ahmed, A pressure distribution transducer for in-vitro static measurements in synovial joints, J. Biomech. Eng., 105 (1983) 223-226.
- A.M. Ahmed and D.L. Burke, In-vitro measurement of static pressure distribution in synovial joints – Part I: Tibial surface of the knee, J. Biomech. Eng., 105 (1983) 216-225.
- A.J. Dempsey, J.B. Finlay, R.B. Bourne, C.H. Rorabeck, M.A. Scott and J.C. Millman, Stability and anchorage considerations for cementless tibial components, J. Arthroplasty, 4 (3) (1989) 223-230.
- Fuji Prescale Film: Instruction Manual; Fuji Photo Film Co., Ltd., 26-30 Nishiazabu, 2-chome, Minato-ku, Tokyo 106, Japan.