Article
Related Links
A.B. Liggins, J.C.E. Stranart, LB. Finlay and C.H. Rorabeck
Orthopaedic Research Laboratory, University Hospital, University of Western Ontario, London, Canada, N6A 5A5
Abstract
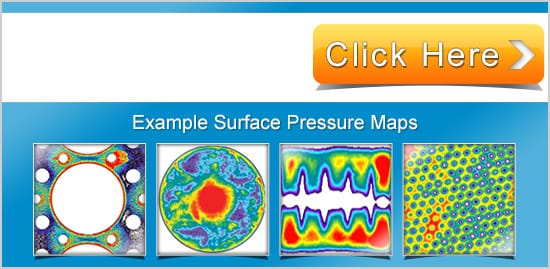
Fuji Prescale pressure-sensitive film is a readily available medium which can be used for investigating both pressure and contact area distributions in normal and prosthetic joints. The application of pressure produces a pink stain for which the optical density at any point is determined by the pressure level at that point. This paper describes a system developed for calibrating this film from a series of standard stains and then using these data for digitally processing test stains and rendering them as false-colour pressure maps.
1. Introduction
Fuji Prescale pressure-sensitive film (Fuji Photo Co., Ltd ., Japan) is a two-part medium, consisting of an A-film and a C-film, both having an active coating on a polymer substrate. Equal size pieces of each film are cut and placed together, with their active surfaces in contact prior to insertion into the interface under test.
The active surface of the A-film consists of microscopic bubbles (2-26 μm diameter) adhered to the substrate (Fig I), within which is encapsulated a colourless liquid. On the application of pressure, a number of bubbles will be burst, depending on the pressure magnitude. The active surface of the C-film contains a medium which reacts with the liquid released from the A-film, producing a characteristic pink stain. The optical density at any point on this stain is related to the amount of dye absorbed at that point and hence to the pressure acting at that point; a higher pressure will produce a deeper stain.
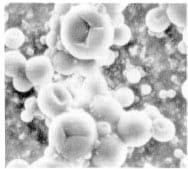
Figure 1 – SEM of Fuji A-Film
Four grades of film are available, each covering a specific pressure range. The manufacturer’s designation and current pressure range for each film grade are given in Table 1. These ranges are accommodated by the use of smaller size bubbles on the A-film for a greater pressure range. Fuji film is supplied in 10 m (5 m for Super-low film) x 0.28 m sheets of individually wrapped matched sets of A and C-film.
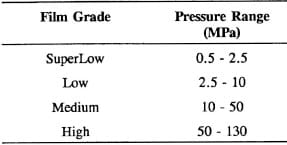
Table 1 – Fuji Film Pressure Ranges
While interface pressure is the main determinant of stain density, the following factors are known to affect this response [1]:
- Ambient temperature
- Relative humidity
- Load rate of the applied pressure
In addition, Fuji suggest that all stains are recorded at a fixed time after application of pressure, suggesting that stain density will change with time.
Given these factors, the film requires calibration for the current temperature and humidity prior to any test protocol, while the load rate and the time between producing a stain and taking measurements must remain constant.
2. Recommended Calibration and Data Recording Procedures
Fuji recommend use of their product between 5 to 35°C and between 20 to 90% relative humidity. A set of charts is provided which allow for rudimentary calibration and pressure determination from a series of standard colour samples. Two sets of charts are provided for each grade of film, allowing for two possible load regimes:
- “Continuous”. Pressure is raised gradually for two minutes and then maintained at this level for a further two minutes.
- “Momentary”. Pressure is raised gradually for five seconds and then maintained at this level for a further five seconds.
The density at any point of interest on a given stain is compared to the standard colour samples provided, either visually or with a hand-held optical densitometer (FDP301 Densitometer, Fuji Photo Film Co., Ltd., Japan) and the closest match chosen. An approximate pressure value is then taken from a response curve which takes account of temperature and humidity effects.
It is recommended that this procedure be conducted at a fixed time from the application of pressure.
These methods allow for a fairly quick estimation of pressure distribution; however, if the film is to be used for a more precise investigation, the following drawbacks need to be addressed:
- The effects of temperature and humidity changes are condensed into four broad calibration ranges, each with its own pressure/density relationship. This approach will introduce initial errors.
- While it is recommended that readings be conducted at a fixed time from the application of pressure, indicating that stain density will change with time, no method of calibration for this effect is provided.
- Only eight density samples are provided for comparison, limiting the resolution of density determination and hence the resolution of pressure readings.
- Even with the density samples for comparison, visual assessment of stain density at any point can be difficult.
- The spatial resolution of the optical densitometer is to a 2 mm diameter, limiting its usefulness over small contact areas, or areas of high pressure gradient.
- Using either visual observations or densitometer reading, it would be extremely difficult and laborious to produce accurate pressure maps across a contact area.
3. Practical Calibration and Data Recording
The use of Fuji Prescale film has been reported for the assessment of contact areas andlor pressures within the hip [2], patellofemoral [3,4], tibiofemoral [4,5], ankle [4] and radio-ulnar [6] joints, as well as under the foot [7] and on a cartilage surface in the presence of defects [8]. While some work has been conducted using the recommended methods of stain assessment [5,7], the limitations in this approach appear to have prompted a move towards development of custom calibration and stain assessment methods [2-4,6,8]. Calibration data are produced from stains taken at known pressures and are used for the digital conversion of stain data from the test site into pressure maps. While applications have been reported for these methods, little has been presented on Fuji film properties.
Our approach to the limitations imposed by the recommended methods of pressure determination has also been to develop both calibration and stain digitization and manipulation systems. The aim was to be able to produce a comprehensive calibration for the film immediately prior to testing, thus allowing for the current ambient temperature and humidity. This calibration would then be used to manipulate the digitized images of subsequent test stains in order to display pressure distributions. The procedure which was developed
to fulfil these requirements can be divided into the following six sections:
3.1. Cutting Fuji Film
Some time prior to testing, Fuji film pieces (both A- and C-film) of the correct size and film grade were cut in a suitable quantity (allowing for an approximate 10% wastage) for the particular protocol. In addition, twenty calibration pieces (again allowing for wastage), approximately 25-30 mm square, of both A- and C-fiIm of the same grade as the test pieces were cut. These were then placed in separate envelopes for A-film, C-fiIm, calibration and test pieces.
3.2. Obtaining Calibration Stains
The apparatus shown in Fig 2 was mounted onto an MTS Bionix 858 universal testing machine. This consisted of a 63.59 mm diameter hardened steel base plate, 25.39 mm diameter hardened steel calibration punch, ball bearing and a 15 kN load cell mounted on the actuator of the MTS machine. The contacting surfaces of the punch and the base plate were finely ground, since Fuji film has been found to be extremely sensitive to surface level fluctuations.
In practice, the base plate was placed on a reference surface, which in turn was placed on the table of the MTS. For each calibration stain, the baseplate was first dusted with compressed air to remove any particles which could show up on the calibration stain. A piece each of A- and C-film were dusted and placed on the baseplate with their active surfaces in contact. The calibration punch was dusted and then carefully placed on top of the film. The ball bearing was then placed in a small circular recess in the upper surface of the calibration punch. This was used to reduce eccentric loading caused by alignment errors between the upper and lower punch and baseplate surfaces and within the MTS itself.
A bolt with a flat-ground head was inserted into the load cell. The actuator was lowered so that the bolt head was within 10 mm of the ball bearing. The base plate was then moved to centre the punch under the axis of the actuator. In order to prevent indentation of the ground surface of the bolt head by the ball bearing, a small piece of aluminium was held close to the bolt head, such that when the actuator was lowered to give an initial contact load of 5-10 N, it was trapped between the ball bearing and bolt.
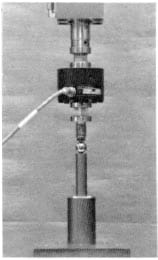
Figure 2 – Fuji Film Calibration Apparatus
A load was then applied under load control from the MTS controller, giving a one minute ramp to full load, one minute hold at that load and a one minute ramp down to zero load. With reference to the data supplied by Fuji [I) this particular regime was chosen so as to give stains of a greater density range than at five second intervals, but at a more acceptable load cycle duration than for two minute load intervals.
This procedure was conducted for ten to fifteen loads across the documented range of the grade of film under calibration [1]. Each stain was given a reference number and stored in an envelope. All loads plus the current temperature and relative humidity were recorded. Tests were aborted for changes of ±3’C or ±3% relative humidity.
Fig 3 shows a series of calibration stains obtained in this manner and illustrates some common characteristics. Thty have been indexed in the following order of ascending load: T26C, T4IC, T46C and 156. While both T26C and T41C are acceptable as being relatively even, T26C contains small blemishes, probably due to poor dusting of either the punches or the paper prior to loading. This would not have a significant effect on the mean pixel value reading from this stain. Stain T41C illustrates the sensitivity of the film. This stain was taken with an optically flat ground glass base plate. Fluctuations in this surface, corresponding to height displacements of 4 wavelengths of Jight or 2 microns are clearly visible. Stains T46C and 156 illustrate rejection criteria for calibration stains. Stain T46C contains a discontinuity in the stain. This has been observed to be due to discontinuities in the A-fi1m coating, necessitating a visual check prior to use. Stain 156 illustrates the effect of eccentric loading due to poor placement of the punch under the actuator. Both of these phenomena may have a significant effect on the mean pixel value reading from the stain. These reading would, therefore, be rejected and re-taken for the same load. It has been observed, however, that a small amount of eccentricity has minimal effect on the mean pixel value, although this has to be assessed qualitatively at the time of calibration stain creation.
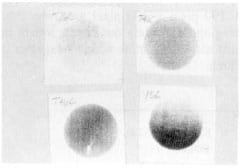
Figure 3 – Fuji Film Calibration Stains
3.3. Testing
The MTS was prepared for the test procedure and the test protocol conducted immediately after calibration had been completed, in order to reduce the possibility of temperature and humidity fluctuations. The one minute load intervals were maintained in order to correspond to the calibration data. Again, all stains were referenced and the maximum load, ambient temperature and relative humidity recorded for each.
3.4. Stain Digitization
The digitization system consisted of a CCD video camera mounted on a copy stand illuminated by a ring lamp, giving even illumination. The camera was connected to a personal computer (PC) running ImagePro II software (Media Cybernetics Inc., Silver Spring, MD 20910, USA) on a Data Translation DT 2851 imaging board. A 55 mm lens was connected to the camera and the height adjusted so that 10 mm spanned 100 pixels horizontally.
All stains were recorded on a black background with the lens set at either f8 or fll, chosen so as not to suffer glare at the lower stain densities or black-out at the higher densities and to give the best range of pixel values.
All digitized images were saved to a filename corresponding to their original recorded designation.
3.5. Obtaining a Calibration Curve
Each calibration stain image was loaded from file and a “median blur filter” applied to the image. The blurring software took each group of four pixels in the image, calculated the mean pixel value and re-wrote the pixels to this value. In this way, the effects of any blemishes in the stain image were minimized. A 190 pixel x 190 pixel area was then selected from the centre of the stain image, this being approximately the largest square to fit within the borders of the stain images. A standard software routine within ImagePro II was used to calculate the mean pixel value for this area.
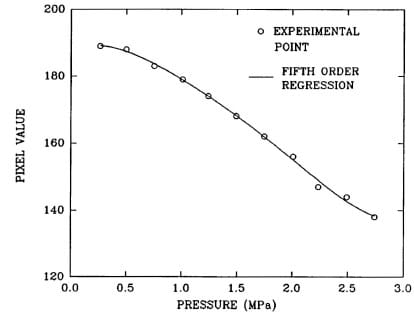
Figure 4 Typical Calibration Curve – SuperLow Fuji Film
The mean pixel value/load data obtained in this manner were transferred to Sigma Plot release 4.1 graph creation and spreadsheet software (Jandel Scientific, Corte Madera, CA 94925, USA). Here, all load values were converted to the corresponding pressure values for the calibration punch, producing a pressure/pixel value curve of the form shown in Fig 4 for SuperLow film taken at 25°C and 42.5% Relative Humidity. Note that pixel value is inversely related to image density; a pure white image returns a value of 255, while a pure black image returns a value of O. Pressure value changes at the upper and lower limits of the film’s pressure range tend to produce a reduced level of pixel value change, as the response flattens out. Therefore, all curves are qualitatively assessed as to the valid range of the calibration.
A fifth-order curve relating pressure to pixel value was filled to the pressure/pixel value data, as this was assessed to give the best fit to the characteristic F
uji film response curves, as indicated in Fig 4. Table 2 gives the original and calculated pressure values for the calibration points in Fig 4, plus the error in MPa. The six coefficients for this curve-fit were recorded for later use within IrnagePro II.
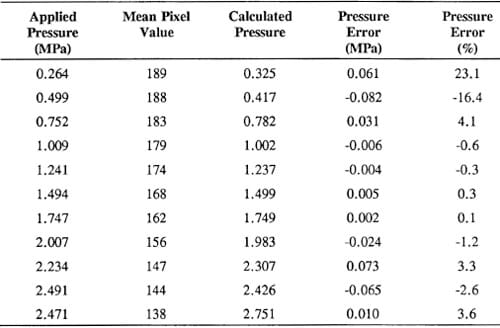
Table 2 – Pressure Reading Errors Due to Calibration Curve-Fit
3.6 Conversion of Test Stains
Complementary software was written in C for use within ImagePro II, in the form of a user module which could be cal1ed up from the main menu.
The coefficients from the calibration curve-fit were first loaded into the module, which created a calibration data file, allowing the calibration to be caBed up as required.
Digitized test images were initially of the type shown in Fig 5 which is from a portion of the underside of the plastic tibial bearing component of a total knee replacement. These were designated as “raw” images and stored in one directory.
Each “raw” image and the corresponding calibration data file were loaded into the calibration module. The image was scanned, such that the value of each pixel was read consecutively. The pressure/pixel value relationship within the calibration data file was then used to calculate the pressure at this point and re-write the pixel to a standard value corresponding to a 0.05 MPa wide pressure band within which the calculated pressure lay. All pixel values above or below the calibrated range were re-written to a under- or overrange value. Thus, the “raw” image of Fig 5 was converted to the “standard calibrated grey scale” image of Fig 6, showing a band of pixels within the calibration range.
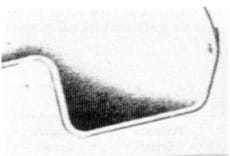
Figure 5 – “Raw” Fuji Film Image
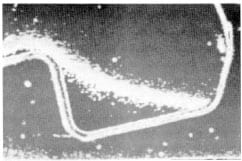
Figure 6 – “Standard Calibrated GreyScale” Image
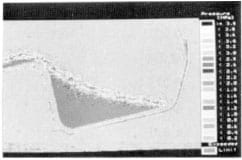
Figure 7 – False Colour Rendition
ImagePro 11 can be used to create custom colour palettes which will assign colours to pixels of a particular value. Custom palettes have been produced which, when applied to a calibrated grey scale image, will assign up to 20 colours to consecutive pressure ranges across the working range of the film, plus additional colours to indicate areas at pressures above or below the working range of the film. Therefore, the “standard calibrated greyscale” image of Fig 6 was converted to the pressure map rendition shown in Fig 7, complete with a pressure/colour key for pressure band identification.
In practice, it was found that for many applications, interface pressure distributions were beyond the range of one film grade alone. Colour palettes are therefore under development which will cover several film ranges, in conjunction with an image indexing system to allow false coloured images taken within the same interface on different grades of film to be overlaid. The palettes currently in use are given in Table 3, each having an allowance in pressure range for any possible fluctuations in the calibrated range. Note that while the palette for Superl.ow film accommodates the pressure range of the current version of this product (0.5 – 2.5 MPa) , the palettes for Low, and High films accommodate the experimentally observed pressure ranges of the previous versions of these films, for which the manufacturer has indicated ranges of 2-7 MPa and 25-70 MPa respectively. It should also be noted that the palette for High grade film is incomplete due to the upper MTS load limit (approximately 15 kN), requiring a smaller diameter calibration punch to obtain the desired pressure levels. A false colour palette for medium grade film is currently under development.
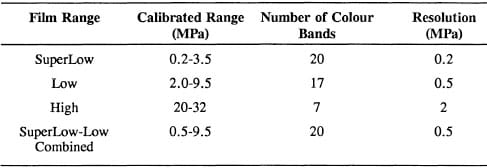
Table 3 – False Colour Palettes Currently Available
Discussion
Calibration immediately prior to experimental testing successfully addresses the film’s changing response with changes in temperature and humidity. From Tables 2 and 3, it can be seen that a fifth-order curve-fit to typical calibration data produces errors (maximum 0.082 MPa for the example provided) well below the resolution of the corresponding false colour rendition (0.2 MPa for SuperLow film). This has been further validated experimentally by reloading all the calibration stains into ImagePro II, applying the calibration which was calculated from them and then overlaying the false colour palette. This has returned the correct pressure range for each stain within the calibration limits in all cases, indicating a good correlation between the results from the calibration and image manipulation procedure and the known applied pressures.
As noted above, the previous versions of Low, and High Fuji film have been utilized, which, according to the supplied documentation, is currently out of date by one year. Using our methods, it has been possible to produce calibration curves for this film, which have been similarly validated.
Development of a standard calibration procedure has provided a method for testing film properties. These will be discussed in detail in the subsequent paper, but include quantification of repeatability, the effect of differing load rates and the time to digitization as well as visualization of temperature and humidity effects.
Producing ten to fifteen stains for a good calibration curve takes about one hour with additional time for re-taking rejected stains. At least fifteen minutes should also be allowed for set-up and cleaning away of the calibration apparatus. Digitization and analysis of the calibration stains can take a further hour. Another thirty minutes should be allowed for obtaining the calibration curve, the fifth-order coefficients and feeding these data into the calibration module in ImagePro II. The method outlined in this paper is, therefore, fairly time consuming when compared to the Fuji’s simple approach [1], but provides a more comprehensive method of calibration and results presentation.
Some further observations which have been made during the use of this system and which may be of use to other investigators are as follows:
- Calibration punches should be finely ground, but not polished, since this has been shown to cause enough dishing of the surfaces to have a noticeable effect on the evenness of calibration stains. This in turn affects the mean pixel reading.
- Great care should be taken when placing or removing the calibration punch, so as to avoid additional staining.
- Fluorescent lighting for the digitization apparatus should be allowed to warm up for at least thirty minutes, as this was found to minimise light-level fluctuations.
- Digitization should take place in a darkened room to avoid background lighting fluctuations. Computer monitors should also be turned away from the digitization platform, as light from these has been shown to affect pixel value readings.
- A mean pixel value reading from a photographic 18% grey card should accompany all sets of readings, to allow direct comparisons between groups of readings.
Calibration of Fuji Prescale pressure-sensitive film in this manner has allowed the quantification of interface pressures within both physiological and artificial replacement joints, with a pressure resolution down to 0.2 MPa (SuperLow film) and a spatial resolution of at least 0.5 square millimetres. This has included observations on the upper and lower surfaces of a polyethylene tibial component, a polyethylene patellar component and the
physiological hip joint.
References
- Fuji Prescale Film: Instruction Manual. Fuji Photo Film Co., Ltd., 26-30 Nishiazabu, 2-chome, Minato-ku, Tokyo 106, Japan.
- Afoke, N. Y.P., Byers, P.D. and Hutton, W.C. J.Bone and Joint Surge 69B(4):536-54l, 1987.
- Haut, R.C. J.Orthop.Res. 7(2) (1989) 272-280.
- Hehne, H.J., Ficker, E., Jantz, W., Mahr, D. and Schopf, H.J. Morphol.Med. 1 (1981) 95-106.
- Fukubayashi, T. and Kurosawa, H. Acta Orthop.Scand. 51 (1980) 871-879.
- Werner, F.W., Murphy, D.J. and Palmer, A.K. J.Orthop.Res. 7 (1989) 445-450.
- Aritomi, H., Morita, M. and Yonemoto, K. J.Biomech. 16(2) (1983) 157-165.
- Brown, T.D., Pope, D.F., Hale, J.E., Buckwater, J.A. and Brand, R.A. J. Orthop. Res. 9(4) (1991) 559-567.