Article
Related Links
Antonello Ganau, MD, Richard B. Devereux, MD, Thomas G. Pickering, MD, PhD,
Mary J. Roman, MD, Peter L. Schnall, MD, Stefano Santucci, MD,
Mariane C. Spitzer, RDMS, and John H. Laragh, MD
The weak relation of systolic blood pressure to left ventricular mass in hypertensive patients is often interpreted as evidence of nonhemodynamic stimuli to muscle growth. To test the hypothesis that left ventricular chamber size, reflecting hemodynamic volume load and myocardial contractility, influences the development of left ventricular hypertrophy in hypertension, we studied actual and theoretic relations of left ventricular mass to left ventricular diastolic chamber volume, pressure and volume load, and an index of contractility. Data were obtained from independently measured M-mode and two-dimensional echocardiograms in 50 normal subjects and 50 untreated patients with essential hypertension. Two indices of overall left ventricular load were assessed: total load (systolic blood pressureX left ventricular endocardial surface area) and peak meridional force (systolic blood pressure x left ventricular cross sectional area). A theoretically optimal left ventricular mass, allowing each subject to achieve mean normal peak stress, was calculated as a function of systolic blood pressure and M-mode left ventricular end-diastolic diameter. Left ventricular mass measured by M-mode echo correlated better with two-dimensional echocardiogram derived left ventricular enddiastolic volume (r=0.56, p<0.001) than with systolic blood pressure (r=0.45, p<0.001) and best with total load or peak meridional force (r=0.68 and 0.70, p<0.001). In multivariate analysis both end-diastolic volume and blood pressure were independent predictors of systolic mass (p <0.001) and explained most of its variability (R=0.75,p <0.001). Theoretically optimal left ventricular mass was more closely related to end-diastolic volume (r= 0.72, p<0.001) than to systolic blood pressure (r=0.46,p<0.001); thus, the relatively weak correlation between blood pressure and optimal mass reflected the influence of left ventricular cavity size, rather than a lack of proportionality between load and hypertrophy. Actual and theoretically optimal left ventricular mass were closely related (r=0.76, p<0.001), indicating that left ventricular hypertrophy in most cases paralleled hemodynamic load. Left ventricular mass was positively related to stroke index and inversely to contractility (as estimated by the end-systolic stress/volume index ratio), the main determinants of left ventricular chamber volume. In multivariate analysis, systolic blood pressure, stroke index, and the end-systolic stress/volume index ratio were each independently related to left ventricular mass index (all p<0.001, multiple R=0.81) and accounted for 66% of its overall variability. These observations suggest that left ventricular chamber size, reflecting hemodynamic profile and inotropic properties, is a major determinant of the degree of left ventricular hypertrophy in hypertension. Theoretic left ventricular mass describes ideal relations among blood pressure, cavity size, and mass, providing evidence that a weak relation between systolic blood pressure and left ventricular mass is compatible with adequate left ventricular load-mass coupling. Total load and peak meridional force, incorporating both pressure and left ventricular geometry, are better predictors of left ventricular mass than systolic blood pressure. (Circulation 1990;81:25-36)
In the presence of arterial hypertension, left ventricular (LV) hypertrophy develops as an adaptive process allowing the heart to normalize afterload and preserve systolic performance. However, despite the established causal link between high blood pressure and LV hypertrophy, clinical studies do not show a close relation between blood pressure level and degree of LV hypertrophy.1-5 A number of explanations for this observation have been suggested, including unreliability of causal blood pressure measurements in estimating long-term pressure load5-9 and promotion or modulation of LV hypertrophy by nonhemodynamic factors.10-14
However, an alternative line of reasoning is suggested by the fact that equal degrees of LV hypertrophy may be induced by pure hemodynamic pressure or volume overload or as part of the adaptive response to myocardial contractile failure.15-17 Furthermore, some patients with mild or even moderate established hypertension have, in addition to elevation of blood pressure, increased cardiac output and/or evidence of increased LV contractile performance. 18-25 These observations suggest that LV muscle mass may be independently and positively related to arterial pressure and stroke volume and inversely related to myocardial contractility since greater myocardial efficiency would allow a given hemodynamic load to be borne by a smaller myocardial mass.
To test this hypothesis, we examined the relations of arterial pressure, LV stroke volume, and an index of myocardial contractility to LV mass in normotensive and untreated hypertensive adults, using independently measured M-mode and two-dimensional echocardiograms to assure that the same primary measurement did not appear in two terms of any evaluated relationship. To explore the contribution of pressure and volume load to LV hypertrophy, theoretic LV mass was also calculated in each patient to attain the “ideal” state in which peak LV wall stress was fully normalized.15-17 Several indices of LV load were also tested as correlates and potential determinants of the extent of LV hypertrophy.
Methods
Subjects
Fifty patients with borderline to moderate sustained hypertension evaluated primarily at the New York Hospital Hypertension Center (n = 12) or referred to the Center from a worksite-based screening program (n=38) were enrolled on the basis of arterial pressure 140 mm Hg systolic or 90 mm Hg diastolic or higher on three measurements at 1-week intervals. Other eligibility criteria were as follows: absence of any previous antihypertensive or cardioactive treatment to avoid possible effects of treatment on hemodynamics and LV hypertrophy; no evidence of secondary causes of hypertension; no history or physical or electrocardiographic signs of valvular, primary myocardial, or coronary artery disease; and serum creatinine 2 mg/dl or higher. Also studied were 50 normotensive adults from a wellcharacterized, employed population26 in whom multiple clinical blood pressure measurements were consistently less than 140/90 mm Hg. Subjects whose body weight exceeded their ideal by 30% or more were excluded; ideal body weight was defined according to the 19
83 Metropolitan Life Insurance Company criteria.27 Only subjects with both M-mode and two-dimensional echocardiographic tracings of good technical quality were included in the study.
Blood Pressure Measurements
Blood pressure was measured with subjects supine in a quiet room at the end of the echocardiogram, using a mercury sphygmomanometer. Measurements were taken in most subjects by a single sonographer experienced in research and in the remainder by a physician who performed the echocardiogram. Twentyfour- hour blood pressure recordings were obtained in eight normal and 36 hypertensive subjects within 2 weeks of the echocardiographic examination. Subjects were fitted with a commercially available, fully automatic recorder (ICR 5200, Spacelabs, Inc., Bellevue, Washington) on the morning of a working day. Methods for recorder calibration, analysis of the tapes, and editing of the artifactual readings have been previously described.5 Average work, home, and sleep blood pressures were determined as median measurements of at least three technically satisfactory readings in each setting. Average awake and 24-hour blood pressures were also measured in those subjects who had enough recordings in at least the first two or in all three conditions, respectively.
Echocardiography
Measurements of LV dimensions and derived variables were made from both M-mode and twodimensional echocardiograms on each subject, read blinded to clinical data, and interpreted independently of each other so that the same primary echocardiographic measurement was not used to calculate more than one term in any of the relations under evaluation. Echocardiograms were performed by expert sonographers using commercially available echocardiographs with 2.25 to 3.0 MHz transducers.
M-Mode Measurements
M-mode tracings were recorded under twodimensional guidance on stripchart paper at 50 mm/ sec and analyzed blinded to blood pressure measurements and to the presence or absence of hypertension by two readers (A.G. or M.J.R. and R.B.D.). Tracings were digitized by a graph-pen interfaced to a PDP 11/23 computer (Digital Equipment Corp.). M-mode measurements were taken at the tip of the mitral valve or just below. LV internal dimensions (LVID) and septal (IVS) and posterior wall thickness (PWT) were measured at end diastole and at end systole as average values of up to seven cardiac cycles. Relative wall thickness (RWT) was measured at end diastole as 2PWT/LVID. LV mass was calculated at end diastole using the Penn convention. 28,29 LV mass was also calculated at end systole using American Society of Echocardiography measurements,30 a method previously shown to yield values closely related to and falling along the line of identity with LV mass measured by antemortem echocardiogram at end diastole (r=0.94, n=42, p<0.001) in necropsied subjects.31 Systolic LV mass was measured because its independence of LV diastolic diameter makes it suitable to obtain unbiased correlations with indices of LV size and load derived from two-dimensional echocardiographic measurements of diastolic chamber dimension or area. The relation between end-systolic and Penn convention diastolic LV mass was tested further in 465 normal and hypertensive subjects; over a wide range of LV mass values (48 to 520 g), the correlation between the two variables was excellent (r=0.89, p <0.0001).
Fractional shortening was assessed as a measure of LV ejection phase performance. Peak and endsystolic meridional wall stress was calculated by the Sandler-Dodge formula for a thin-walled prolate ellipsoid32: Stress= (1,333 x SBP x 2r)/h(2r+h), where 1,333 is the conversion factor from mm Hg to dynes, SBP is cuff systolic blood pressure, and r (radius) and h (thickness) correspond to LVID/2 and PWT, respectively. The measurements were taken at end diastole for peak stress, based on the observation that LV dimensions do not change significantly between end diastole and the time of peak wall stress,16 and at end systole for end-systolic stress. The use of cuff systolic blood pressure instead of intraventricular endsystolic pressure in combination with end-systolic LV measurements resulted in end-systolic stress (ESS) values that systematically overstated but were closely correlated with those obtained using intraventricular pressure recordings in patients not receiving vasodilator or inotropic drugs. The values were the same irrespective of whether intraventricular end-systolic pressure was measured at the time of maximal ventricular elastance (mean noninvasive overestimation 5%, r=0.95 vs. invasive measurements33) or at the time of aortic valve closure. Use of cuff systolic pressure yielded ESS values that closely paralleled those calculated using dicrotic notch pressure from calibrated carotid pulse tracings in 20 normotensive or hypertensive subjects studied in our laboratory (mean overestimation 14%, r=0.96, p<0.001). Thus, the noninvasive method we used provided ESS values that permitted satisfactory comparison among subjects but which slightly overstated values obtained using LV pressure at the time of end systole by different definitions.
Two-Dimensional Measurements. Wide-angle twodimensional images were recorded on 0.5-in. videotapes and analyzed by means of a Diasonics Cardio Revue Center with frame-by-frame contour digitizing capability. Two-dimensional short axis images were obtained at the level of the papillary muscle tips, and long axis images were recorded in apical twochamber and four-chamber views. Two-dimensional measurements were performed blinded to blood pressure level, the presence or absence of hypertension, and M-mode findings by a single reader (A.G.). Videotapes were reviewed carefully in real time, slow motion, and frame by frame in order to obtain the best definition of endocardial and epicardial contours. Four to six stop-frame images were used to obtain average measurements of left ventricular total, cavity, and myocardial cross-sectional areas as well as long axis dimensions at end diastole (Q wave of the electrocardiogram) and end systole (the smallest cavity area). In parasternal short axis view at the papillary muscle level, LV endocardial and epicardial contours were traced directly on the monitor using a graphic tablet.
According to the black-white method for interface definition, endocardial echoes were excluded from LV cavity area (Ac) while the finest outer line of epicardial echoes was excluded from total LV area (At). Myocardial area (Am) was obtained by subtraction of the cavity area from total area. Since recent research34 has showed that with improvements in echocardiographic technology, measurements of total and myocardial cross-sectional areas using conventional transducers and the black-white interface no longer exhibit the overestimation observed in previous reports.35,36 At and Am were not corrected by any empirically derived regression equation. Cavity area might be affected by systematic but mild underestimation. 34 However, since the primary goal of our study was to assess the strength of correlation between LV mass and Ac-derived variables rather than their absolute values, Ac was not corrected. The LV long axis (L) was measured in apical four-chamber view from the midpoint of the mitral valve annulus to the apical endocardium. From these direct measurements other measurements could be derived for calculation of several indices of LV geometry and load: a=major hemiaxis (a=L/2); b=minor hemiaxis (b= √Ac/3.14); h=average LV wall thickness (h= √At/3.14-b); bm=midwall radius (bm=b+h/2). LV end-diastolic volume was measured as an index of
ventricular size with the formula for a biplane ellipsoid: end-diastolic volume=πr/6XLxD1xD2, where Dl and D2 are the right-left and the anteroposterior minor axis, respectively. End-diastolic and end-systolic chamber volumes by this method were used to calculate LV stroke volume as a measure of LV volume load. LV chamber geometry was quantitatively described by the minor/ major hemiaxis ratio (b/a ratio),37 which reflects the degree of sphericity of the LV cavity. Peak circumferential wall stress was derived from the formula for a thin-walled prolate ellipsoid with midwall geometry,38 shown by McHale and Greenfield39 to be the most accurate predictor of measured wall stress in basal conditions and to be relatively insensitive to errors in wall thickness and base-to-apex length measurements: where bm and a represent the midwall radius and the major hemiaxis, respectively.
Peak circumferential stress
dynes/cm2= [(1,333 x SBP x bm)/h] x
[1-(bm3/a2x[2bm4h])]
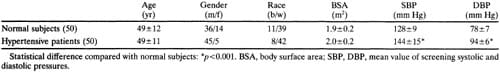
TABLE 1. Characteristics of Normal and Hypertensive Subjects
Indices of LV Load and Contractility
Two indices of LV load, peak meridional force and total load, were assessed. Like wall stress these indices incorporate the main components of ventricular load (LV pressure and chamber size and geometry) but differ from wall stress in that they are independent of wall thickness. Both indices were estimated by twodimensional images in order to obtain more accurate analysis of LV geometry and to allow correlations with M-mode derived LV mass. Peak meridional force represents the pressure load, or maximal force acting in a meridional plane on the wall, based on the fact that at the equator of a prolate ellipsoid the forces stretching and contracting the LV wall must balance at moments of equilibrium of the LV wall16,32,40: Peak meridional force in dynes=LV pressure xLV diastolic crosssectional area=1,333xSBPxAcd. Total load represents the maximal pressure loading acting on the internal surface of a prolate ellipsoid15: Total load in dynes = LV pressure x LV diastolic surface area of an ellipsoid= 1,333 x SBP x 2Π(b2 + ab x [arcsin √1-(ba)2/ √1-(b/a)2]) where a and b are LV major and minor hemiaxes, respectively.
Because the occurrence of LV hypertrophy in patients with congestive cardiomyopathy without primary pressure or volume overload suggests that an inverse relation may exist between LV mass and inotropic state, the ratio of end-systolic meridional wall stress to end-systolic volume index was calculated as an index of myocardial contractility,41 using M-mode echocardiographic measurements by the leading edge convention30 in catheterization validated formulas.33,42 The end-systolic stress/volume index ratio calculated in this manner was closely related (r=0.83,p<0.001) to the slope of the maximal end-systolic myocardial elastance line derived from LV stress-volume relations during load manipulation by angiotensin or nitroprusside in 21 normotensive or hypertensive subjects.43
Theoretically Optimal LV Mass
We estimated in each subject a theoretically optimal LV mass calculated to allow each subject to achieve a constant normal value of peak systolic stress (ideal condition of iso-normo-stress). Peak systolic wall stress necessary to estimate optimal LV mass was derived from a simplified formula: Peak stress = pressure x radius)/thickness = 1,333 x SBP x (LVIDd/2)/PWTd. The average value of peak stress by this formula in the 50 normal subjects was 500 x 103 dynes/cm2. LV mass was measured from the formula: LV mass= 1.04 [(2PWTd+ LVIDd)3-LVIDd3], assuming interventricular septal and posterior wall thicknesses to be equivalent. In fact, the interventricular septum/posterior wall thickness ratio at end diastole was very similar in normal and hypertensive subjects (1.06+ 0.11 vs. 1.11 ±0.11, respectively;p>0.05). Combination of the above equations allows optimal LV mass to be calculated as a function of SBP and LVIDd: Optimal LV mass=1.04 [(LVIDd [1.333x SBP/500])+LVIDd]3-LVIDd3. Since optimal LV mass is designed to be adequate to the pressure load (SBP) for any given LV size (LVIDd), it describes the theoretically ideal amount of muscle mass and may be used to quantify the respective influence of blood pressure and LV size on LV mass for the hypothetic condition in which hypertrophy normalizes peak LV wall stress perfectly.
Statistical Methods
Data were analyzed by CLINFO statistical software of the Cornell University Clinical Research Center (CLINFO II Users Guide; software by BBN, Software Products Corp, Cambridge, Massachusetts). Data are expressed as the mean with the standard deviation as the index of dispersion. Comparisons between two groups were performed by unpaired t tests. Relations between variables were assessed using univariate linear regression analysis and Pearson’s correlation coefficient. Multiple regression analysis was performed to test dependence of LV mass on blood pressure, LV size, and contractile performance.44
Results
Clinical and Echocardiographic Characteristics of Nornal and Hypertensive Subjects
There was no statistical difference in age, gender, race, or body surface area between normal and hypertensive subjects (Table 1). Screening systolic and diastolic blood pressure, as well as blood pressure under relatively basal conditions at the end of echocardiography, were higher (p <0.01) in the hypertensive group (Table 1). Compared with normal subjects, hypertensive patients had higher LV posterior wall thickness (p<0.01), end-diastolic volume (p<0.05), relative wall thickness (p<0.01), and conventional and systolic left ventricular mass index (p<0.01) (Table 2). As expected from previous studies,29,31 end-systolic LV mass calculated with American Society of Echocardiography measurements was about 20% greater than LV mass measured by the Penn method.28 Interventricular septal/ posterior wall thickness ratio, diastolic minor/major axis ratio, peak and end-systolic meridional wall stress, fractional shortening, and end-systolic stress/ volume index ratio were similar in the two groups. Hypertensive patients also had increased peak mid-wall circumferential stress (p<0.05), total load (p<0.01), and peak meridional force (p<0.01).
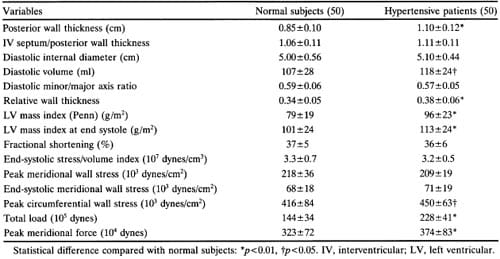
TABLE 2. Echocardiographic Data in Normal and Hypertensive Subjects
Relation of Left Ventricular Mass to Left Ventricular Size, Shape, and Load
Penn convention, systolic, and optimal LV mass all correlated significantly (p<0.001) with both systolic blood pressure measured during the echocardiographic study (r=0.34 to 0.46) and with end-diastolic volume (r=0.56 to 0.72) (Figure 1). It is noteworthy that the correlation coefficient of systolic blood pressure with conventional mass (r=0.45) is almost the same as that with theoretically optimal LV mass (r=0.46) (Figure 2). Screening systolic blood pressures in the overall population (r=0.42,p<0.01) and ambulatory blood pressures in the 44 subjects (eight normotensive and 36 hypertensive) in whom they were available correlated less well than blood pressure at the time of echocardiography with LV mass (Table 3) and accordingly were not use
d in further analyses. Close correlations were found between all three measures of LV mass and total load (r=0.62 to 0.80, p<0.001) or peak meridional force (r=0.66 to 0.85,p<0.001) (Table 4, Figure 1). LV diastolic short axis/long axis ratio was significantly but weakly related to Penn LV mass index (r=0.32, p<0.01), LV mass index from end-systolic measurements (r=0.37, p<0.001), and optimal LV mass (r=0.41, p<0.001) (Table 4). When systolic blood pressure, LV enddiastolic volume, and body surface area were entered as independent variables in a multiple regression model, high coefficients of determination were found with either Penn or systolic LV mass as dependent variables (R2=0.61 and 0.56, respectively;p<0.0001); these values of R2 were close to the coefficient of determination observed with theoretically optimal LV mass as the dependent variable (R2= 0.67) (Table 5). All these observations suggest that in this population actual LV mass is highly dependent on systolic blood pressure and LV size, similarly to ideal LV mass. Consistent with this interpretation is the finding that Penn and theoretically optimal LV mass were closely related to each other (r=0.76,p<0.001).
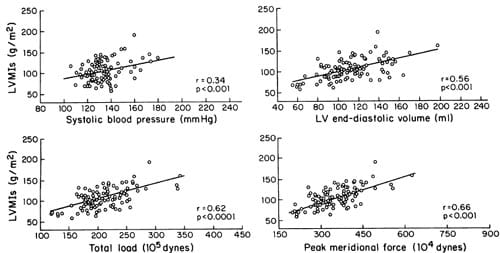
FIGURE 1. Relations of systolic left ventricular mass index (LVMIs) to systolic blood pressure, left ventricular (LV) end-diastolic volume, total load, and peak meridional force.
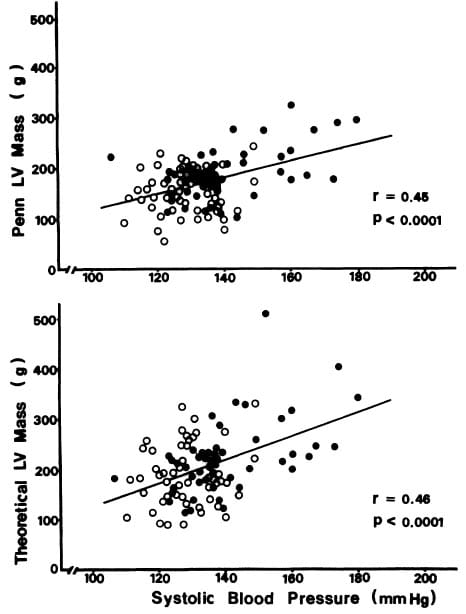
FIGURE 2. Relation of systolic blood pressure at the end of echocardiography (horizontal axis) to left ventricular (LV) mass (vertical axes) measured by the Penn convention (upper panel) or calculated to achieve the theoretically optimal condition in which peak systolic stress is normalized at the average value in normal adults (lower panel).
Blood Pressure, Stroke Volume, and Myocardial Contractility as Independent Determinants of LV Mass
Since LV mass is strongly dependent on LV chamber size, which is in turn physiologically determined by stroke volume and myocardial contractility, LV mass index was also related to stroke volume index and the end-systolic stress/end-systolic ratio. LV stroke volume index was measured by two-dimensional echocardiography, and the end-systolic stress/volume index ratio was derived from end-systolic M-mode measurements to allow correlations with Penn LV mass index derived from end-diastolic M-mode measurements as free of bias as possible. LV mass index was related positively to stroke volume index (r= 0.60, p<0.001) as well as systolic blood pressure (r= 0.45, p<0.001) and inversely to the end-systolic stress/volume index ratio (r=-0.48, p<0.001). Because the rightward shift of LV pressure-volume and stress-volume relations in connection with series replication of sarcomeres in dilated hearts might artifactually decrease the ESS/ESVI ratio in the presence of normal contractility, analyses were repeated after exclusion of the six subjects with slightly increased LV enddiastolic dimensions (5.7 to 6.1 cm); no change occurred in the inverse relation between LV mass and the stress/volume index ratio (r= -0.47,p<0.001).
Multiple regression analysis showed that systolic blood pressure, stroke volume, and the stress/volume ratio were all powerful, independent predictors of LV mass index (p<0.0001). LV mass index was closely determined by these three independent variables (r=0.81, p<0.0001) in the following multiple linear regression equation: LV mass index=2.156+(0.869 SBP) + (0.692 stroke volume index) -(17.43 endsystolic stress/volume index). The strength of these correlations was not increased by use of nonlinear as opposed to linear relations in either univariate or multivariate analysis.
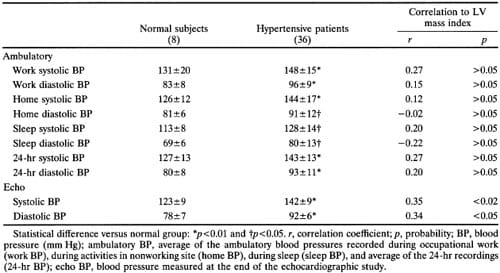
TABLE 3. Ambulatory and Echo Blood Pressures in 44 Subjects
Discussion
According to generally accepted concepts the pressure-overloaded left ventricle adapts to a sustained rise in afterload by increasing its muscle mass in a concentric pattern.16 If wall thickness grows proportionately to the pressure load, LV systolic wall stress remains normal with beneficial effects on ejection phase performance and oxygen consumption per unit myocardium.19,38,45
However, the potential influence of LV volume load and contractility on hypertensive LV hypertrophy has been neglected in studies relating hemodynamic load and LV structural adapation for both conceptual and methodologic reasons. Left ventricular chamber size has been thought to be almost constant in long-standing, compensated pressure overload.45 From this point of view, hypertensive heart disease has conceptually been assimilated to other forms of pressure overload such as aortic stenosis, in which LV dilation represents a transition toward LV failure. However, recent reports have shown in hypertensive rats46,47 and in humans with untreated essential hypertension25 that hemodynamic factors may induce eccentric LV hypertrophy associated with high cardiac output. Relative or absolute increases in LV chamber dimensions or cardiac output also may occur in early human hypertension and even in some patients with established hypertension of moderate severity.18,20-23,25 Since LV chamber size contributes directly to wall stress, which in turn is considered to be the hemodynamic trigger for hypertrophy,16 any change in LV size for a given pressure should induce proportional modifications in ventricular load and, consequently, parallel changes in LV hypertrophy.
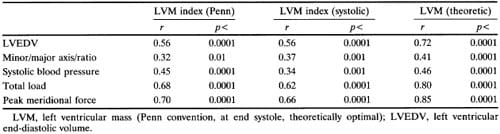
TABLE 4. Univariate Relations of Left Ventricular Mass With Indices of Left Ventricular Size, Shape, and Load
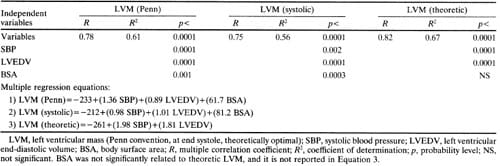
TABLE 5. Multivariate Analysis of Blood Pressure and Left Ventricular Size as Determinants of Lft Ventricular Mass
A serious difficulty in relating LV mass to ventricular geometry in hypertensive patients has been posed by methodologic problems. The most widely used method for measuring LV mass in asymptomatic subjects is M-mode echocardiography, which allows estimation of mass by necropsy validated methods.28,29,31 However, LV chamber size can be assessed only in the single plane of the LV minor axis, while the long axis cannot be assessed to evaluate LV shape. Moreover, any correlation between M-mode derived LV mass and LV diameter is inevitably biased because the same LV diameter is also included in the formula used to calculate LV mass. To make possible appropriate measurements of LV size and geometry and to obtain unbiased estimates of their relations with myocardial mass, LV enddiastolic volume and shape and LV stroke volume were assessed in this study from two-dimensional short-axis and apical views, whereas independent readings of M-mode tracings, performed blinded to two-dimensional findings, were used to calculate LV mass at end systole and end diastole.
Relation of Left Ventricular Chamber Size and Mass
The present study shows that LV chamber size is a strong determinant of overall LV mass independent of blood pressure. In fact, both systolic blood pressure and two-dimensional echocardiographically derived LV end-diastolic v
olume were significantly related to Penn convention, systolic, and theoretically optimal LV mass calculated from M-mode echocardiographic measurements, either in univariate or multivariate analyses (Tables 4 and 5). Whatever index of LV mass was considered, LV mass was more closely related to LV volume than to systolic blood pressure. The close relation of LV systolic mass to end-diastolic cavity size and derived indices of LV load (Figure 1) provides particularly strong evidence that the observed relations are not a result of autocorrelation between variables but reflect a true pathophysiologic relation. Surprisingly, the correlation between systolic blood pressure and observed LV mass index by the anatomically validated Penn method (r=0.45) was nearly identical to that between systolic blood pressure and theoretically optimal LV mass (r=0.46) (Figure 2). Since optimal LV mass was calculated to normalize peak systolic LV wall stress for observed systolic blood pressure and LV chamber size, the modest correlation between systolic blood pressure and optimal LV mass nevertheless reflected nearly optimal matching between blood pressure and LV mass for a given range of LV size. It is noteworthy that actual and ideal LV mass were closely related to each other (r=0.76), providing further evidence that in our population of mild, asymptomatic, untreated hypertensive patients LV hypertrophy in most cases paralleled the hemodynamic load. These observations also provide evidence that a relatively low correlation coefficient between blood pressure and LV mass in hypertensive patients reflects the strong effect of concomitant variability of LV chamber size and volume load, rather than indicating a lack of proportionality between LV hypertrophy and pressure load. The fact that 38 of 50 hypertensives and all 50 normotensives in the present study were drawn from well-characterized, employed populations suggests that our findings might be generally applicable to patients with mild essential hypertension, who constitute the large majority of adults with elevated blood pressure.
The multivariate analyses confirmed the independence of LV volume as a determinant of LV mass (Table 5). The quantitative dependence of LV mass on systolic blood pressure and end-diastolic volume can be estimated from the multiple regression equations in Table 5; for instance, either an increase of 10 mm Hg in systolic blood pressure (at constant enddiastolic volume) or an increase of 10 ml in enddiastolic volume (at constant pressure) induces an equivalent rise of about 10 g in LV mass (Equation 2, Table 5). As a consequence of the independent role of LV chamber size in influencing LV mass, indices of load incorporating both blood pressure and LV cavity size are better predictors of LV mass than SBP. Both total load and peak meridional force showed close relations not only with conventional and optimal LV mass, but also with the systolic LV mass (r=0.62 for total load and 0.66 for peak meridional force) (Figure 1).
LV chamber geometry was not substantially different between normal and hypertensive subjects. However, a weak but significant positive correlation was observed between chamber shape (minor/major axis ratio) and LV mass (Table 4), providing evidence that some degree of LV cavity deformation occurs when hypertrophy develops. Change in LV geometry probably reflects substantial alterations of LV volume load in some hypertensive patients. In fact, an increase in LV mass associated with a more spheric cavity shape mimics the geometric pattern of volumeoverloaded left ventricles. In the subgroup in which we obtained ambulatory blood pressure recordings (44 of 100 subjects), we found no closer correlations between LV mass and work, home, sleep, or 24-hour average pressures than with blood pressure measured at the time of echocardiography (Table 3). This surprising finding could be explained, in part, by the highly standardized conditions in which resting blood pressure was measured, which was responsible for an unusually high level of correlation with LV mass, and, in part, by heterogeneity of occupations among our employed hypertensives, which might cause some subjects’ pressures during the pauses in activity needed for ambulatory pressure measurements to understate the blood pressure level during occupational physical stress. Thus, results from this subgroup of patients make it unlikely that unreliability of blood pressure estimates was responsible for the relatively weak correlation coefficient we found between blood pressure and LV mass.
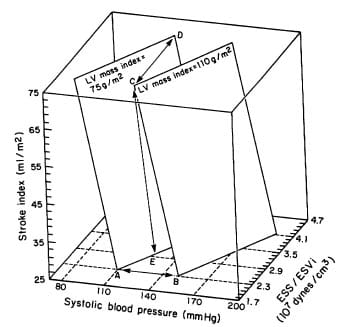
FIGURE 3. Three-dimensional plot of the interrelations revealed by multivariate analysis among left ventricular (LV) mass index, systolic blood pressure, stroke index, and LV contractile performance (ESS/ESVi ratio). The two planes depicted correspond to different levels of LV mass index (75 and 110 g/m2 respectively). Each plane describes the possible interactions between systolic pressure, stroke index, and ESS/ ESVi responsible for a given level ofLVmass index. Displacements between planes due to changes in blood pressure (A-B), contractility (C-D), or stroke volume (C-E) are indicated.
Relation of Left Ventricular Mass to Hemodynamic Load and Contractile Performance
Strong dependence of LV mass on chamber size implies that the main physiologic determinants of LV volume, stroke volume, and myocardial contractility are likely to be related to LV mass. When M-mode LV mass index (Penn) was related to stroke volume index and the end-systolic stress/volume index ratio (an indirect index of myocardial contractility), a positive correlation with LV stroke index and an inverse one with the end-systolic stress/volume index ratio were found. Multiple regression analysis showed very close dependence of LV mass on systolic blood pressure, stroke volume, and contractile performance (multiple R=0.81,p<0.0001), and the multiple regression equation allowed analysis of the interacting effects of these factors. Figure 3 shows schematically the relationships revealed by multivariate analysis between two values of LV mass index (75 and 110 g/m2) and different combinations of SBP, stroke index, and end-systolic stress/volume index ratio. Modification of one of these factors induces a proportional change in LV mass only if the other two factors remain constant, as illustrated by the change in LV mass index when systolic blood pressure was raised from 110 to 150 mm Hg with constant stroke index and stress/ratio (Figure 3, points A to B). Figure 4 illustrates quantitatively the impact that alterations in LV contractility would have on the blood pressure that a left ventricle of specified mass could bear for given levels of stroke index. For instance, LV mass may remain constant in the face of higher blood pressure if a proportional increase in contractility (AB, A’B’) and/or reduction in stroke volume occurs (A-D, B-C, A’-D’, and B’-C’), or LV mass may increase by the effect of increase in blood pressure at constant stroke index and contractility (A-A’, B-B’, C-C’, and D-D’).
Support for an inverse relation between myocardial contractile performance and the blood pressure a given LV mass will bear is provided by clinical studies in which hypertensive patients who had normal LV mass were found to have evidence of increased myocardial contractility.22’25’48 On the other hand, LV mass may increase proportionally to blood pressure if other factors are constant or out of proportion to blood pressure if there is concomitant increase in stroke volume (Figure 3). These conditions parallel the clinical situation in which hypertension accompanied by normal o
r elevated stroke volume results in concentric or eccentric LV hypertrophy.25 Depression of inotropic state could also induce LV hypertrophy (Figure 3) through LV chamber dilatation (Starling’s mechanism) and consequent increase in wall stress. However, the inverse relation between LV mass and the end-systolic stress/volume index ratio in our patients was unaffected by exclusion of the small number of individuals with minimal LV chamber enlargement, suggesting that this relation was mediated by mechanisms other than chamber dilatation in our subjects. Further research using invasive methods that define LV inotropic state more precisely than possible by indirect noninvasive techniques will be needed to resolve this question.
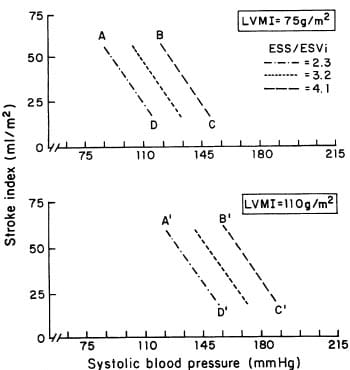
FIGURE 4. Schematic illustration of the interplay revealed by multivariate analysis among systolic blood pressure, stroke volume, and end-systolic stress/end-systolic volume index (ESSl ESVi, a measure of myocardial contractility) as determinants of left ventricular (LV) mass. The three lines correspond to three different levels ofESS/ESVi (2.3, 3.2, and 4.1 x 1O7dynes cm3, left to right, respectively). Constant levels of LV mass index (LVMI) (75 g/m2 in the upperpanel and 10 g/m2 in the lowerpanel) can sustain progressive increases in systolic blood pressure if a concomitant increase in ESS/ESVi (from 2.3 to 4.1 dynes . 107/cm3; A-B, A’-B’), or reduction in SVi (from 75 to 25 ml/m2; B-C, B’-C’), or both (A-C, A’-C’) occur. Data points are the same as in Figure 3.
If we look at the interplay of pressure, volume load, and contractility from the point of view of the regression of LV hypertrophy, it is worthy of note that reduction of blood pressure and stroke volume and increase in LV contractility should be synergistic in inducing regression of hypertrophy. On the contrary, increase in stroke volume and/or contractile depression would be expected to antagonize the effect of blood pressure reduction on regression of LV hypertrophy. This view is in agreement with recent reports showing that some vasodilators are effective in controlling blood pressure but not in reducing LV mass because they induce a concomitant volume overload.46,47 In view of the prognostic impor- tance of LV hypertrophy as an independent risk factor for cardiovascular mortality and morbidity in hypertension,49,50 it is attractive to speculate that selection of antihypertensive treatment based on knowledge of the hemodynamic stimuli in individual patients might result in more effective prevention or reversal of LV hypertrophy and ultimately in improved clinical outcome.
Limitations of Contractility Index
The inferences made in the present study about the role of myocardial contractility based on use of the end-systolic stress/volume index ratio must be regarded as tentative in view of recognized limitations of this single-point index. First, since the volume intercept of the end-systolic stress/volume line generated during load manipulation is usually positive, the stress/volume ratio will be lower in a given heart at larger end-systolic volumes. Extrapolating this observation to comparison between different hearts under basal conditions, one would expect that if ejection fractions were equal, the end-systolic stress/volume ratio would also be lower in hearts of larger end-diastolic size, which would also have larger muscle masses. However, this phenomenon may not be entirely artifactual: we have observed that ejection-phase LV function is lower in association with lower stress/volume index ratios in the larger hearts of “normal” men as opposed to women51 and may be attenuated by the tendency we have found for the end-systolic stress/volume ratio to be less depressed than ventricular elastance (estimated from the slope of the end-systolic stress/volume line) in patients with low values for the latter measure.43 Second, it has been suggested recently52 that measures of ventricular elastance should be normalized for ventricular chamber size to assess myocardial contractility accurately, a point that requires further study.53 Third, since our data were derived from normotensives and untreated hypertensive patients with generally mild hypertension and from normal to mildly increased LV mass, caution is needed in extrapolating the present findings to patients on medication or with marked elevations of blood pressure or ventricular mass.
Summary
In conclusion, the observations of the present study suggest that alterations of systemic hemodynamics (especially of cardiac output) and of myocardial contractility, acting through their effects on LV chamber size, can be responsible for important modifications of the degree and pattern of hypertensive LV hypertrophy from those predicted from blood pressure level alone. Consequently, indices of overall LV load which incorporate blood pressure and LV cavity size and geometry, such as total load and peak meridional force, describe more accurately the hemodynamic load responsible for LV hypertrophy in hypertensive patients. Finally, our data provide evidence that a weak relation between blood pressure and LV mass is compatible with adequate LV loadmass coupling since much of the scatter in this relation is due to concomitant variations of LV chamber size, reflecting the spectrum of LV volume load and inotropic state seen in hypertensive patients. The observed relation of LV mass to blood pressure, volume load, and myocardial contractility appears to provide a conceptual framework to explain some apparently conflicting findings, such as the lack of LV hypertrophy in a number of hypertensive patients, the occurrence of different patterns of hypertrophy, and the disparate responses of LV mass to antihypertensive drugs.
Acknowledgment
We would like to thank Virginia Burns for her assistance in preparation of this manuscript.
REFERENCES
- Rowlands DB, Glover DR, Ireland MA, McLeay RAB, Stallard TJ, Watson RDS, Littler WA: Assessment of left ventricular mass and its response to anti-hypertensive treatment. Lancet 1982;1:467-470
- Drayer JIM, Weber MA, de Young JL: BP as a determinant of cardiac left ventricular muscle mass. Arch Intem Med 1983; 143:90-92
- Abi-Samra F, Fouad FM, Tarazi RC: Determinants of left ventricular hypertrophy and performance in hypertension. Am J Med 1983;75(suppl 3A):26-33
- Devereux RB, Savage DD, Sachs I, Laragh JH: Relation of hemodynamic load to left ventricular hypertrophy and performance in hypertension. Am J Cardiol 1983;51:171-176
- Devereux RB, Pickering TG, Harshfield GA, Kleinert HD, Denby L, Clark L, Pregibon D, Jason M, Kleiner B, Borer JS, Laragh JH: Left ventricular hypertrophy in patients with hypertension: Importance of blood pressure response to regularly recurring stress. Circulation 1983;68:470-476
- Kleinert HD, Harshfield GA, Pickering TG, Devereux RB, Sullivan PM, Marion RM, Mallory WK, Laragh JH: What is the value of home blood pressure measurement in patients with mild hypertension? Hypertension 1984;6:547-578
- Ren J-F, Hakki A-H, Kotler MN, Iskandrian AS: Exercise systolic blood pressure: A powerful determinant of increased left ventricular mass in patients with hypertension. JAm Coll Cardiol 1985;5:1224-1231
- Pickering TG, Harshfield GA, Devereux RB, Laragh JH: What is the role of ambulatory blood pressure monitoring in the management of hypertensive patients? Hypertension 1987; 2:171-177</li >
- Pickering TG, Devereux RB: Ambulatory monitoring of blood pressure as a predictor of cardiovascular risk. Am Heart J 1988;1 14:925-928
- Frohlich ED, Tarazi RC: Is arterial pressure the sole factor responsible for hypertensive cardiac hypertrophy? Am J Cardiol 1979;44:959-963
- Ostman-Smith I: Cardiac sympathetic nerves as the final common pathway in the induction of adaptive cardiac hypertrophy. Clin Sci 1981;61:265-272
- Tarazi RC, Levy MN: Cardiac responses to increased afterload: State of the art review. Hypertension 1982;4(suppl II):II- 8-II-18
- Devereux RB, Drayer JIM, Chien S, Pickering TG, Letcher RL, DeYoung JL, Sealey JE, Laragh JH: Whole blood viscosity as a determinant of cardiac hypertrophy in systemic hypertension. Am J Cardiol 1984;54:592-595
- Devereux RB, Pickering TG, Cody RJ, Laragh JH: Relation of the renin-angiotensin system activity to left ventricular hypertrophy and function in experimental and human hypertension. J Clin Hypertens 1987;3:87-103
- Hood WP Jr, Rackley CE, Rolett EL: Wall stress in the normal and hypertrophied human left ventricle. Am J Cardiol 1968;22:550-558
- Grossman W, Jones D, McLaurin LP: Wall stress and patterns of hypertrophy in the human left ventricle. J Clin Invest 1975;56:56-64
- Douglas PS, Reichek N, Hackney K, Toli A, St. John Sutton MG: Contribution of afterload, hypertrophy and geometry to left ventricular ejection fraction in aortic valve stenosis, pure aortic regurgitation and idiopathic dilated cardiomyopathy. Am J Cardiol 1987;59:1398-1404
- Finkelman S, Worcel M, Agrest A: Hemodynamic patterns in essential hypertension. Circulation 1965;31:365-368
- Strauer BE: Hypertensive Heart Disease. Berlin, Springer- Verlag, 1980
- Lund-Johansen P: Hemodynamics in essential hypertension. Clin Sci 1980;59:343s-354s
- Hartford M, Wikstrand JCM, Wallentin I, Ljungman SMG, Berglund GL: Left ventricular wall stress and systolic function in untreated primary hypertension. Hypertension 1985; 7:97-104
- Lutas EM, Devereux RB, Reis G, Alderman MH, Pickering TG, Borer JS, Laragh JH: Increased cardiac performance in mild essential hypertension: Left ventricular mechanics. Hypertension 1985;7:979-988
- Shu VWC, Gardin JM, Weber MA, Drayer JIM: Echocardiographic correlates of vasoconstriction and volume forms of hypertension. J Hypertens 1986;4(suppl 5):s316-s318
- Ganau A, Malavasi A, Cassisa L, Piga G, Campus S: Contractile state of the hypertrophic left ventricle in hypertension (abstract). Eur Heart J 1982;4(suppl E):36
- Campus S, Malavasi A, Ganau A: Systolic function of the hypertrophied left ventricle: J Clin Hypertens 1987;3:79-87
- Hammond IW, Devereux RB, Alderman MH, Laragh JH: Relation of blood pressure and body build to left ventricular mass in normotensive and hypertensive employed adults. JAm Coll Cardiol 1988;12:996-1004
- Stavig GR, Leonard AR, Igra A, Felten P: Indices of relative body weight and ideal body weight charts. J Chronic Dis 1984;37:255-262
- Devereux RB, Reichek N: Echocardiographic determination of left ventricular mass in man. Circulation 1977;55:613-618
- Devereux RB, Alonso DR, Lutas EM, Gottlieb JB, Campo E, Sachs I, Reichek N: Echocardiograhic assessment of left ventricular hypertrophy: Comparison to necropsy findings.Am J Cardiol 1986;57:450-458
- Sahn DJ, DeMaria A, Kisslo J, Weyman A: The Committee on M-mode Standardization of the American Society of Echocardiography. Recommendations regarding quantitation in Mmode echocardiography: Result of a survey of echocardiographic measurements. Circulation 1978;58:1072-1083
- Devereux RB: Detection of left ventricular hypertrophy by M-mode echocardiography: Anatomic validation, standardization, and comparison to other methods. Hypertension 1987; 9(suppl II):II-19-II-26
- Sandler H, Dodge HT: Left ventricular tension and stress in man. Circ Res 1963;13:91-104
- Reichek N, Wilson J, St. John Sutton MG, Plappert TA, Goldberg S, Hirshfeld JW: Noninvasive determination of left ventricular end-systolic stress: Validation of the method and initial application. Circulation 1982;65:99-108
- Pini R, Ferrucci L, Di Bari M, Greppi B, Cerafolini M, Masotti L, Devereux RB: Two-dimensional echocardiographic imaging: In vitro comparison of conventional and dynamically focused annular array transducers. Ultrasound Med Biol 1987; 13:643-650
- Helak JW, Plappert T, Muhammed A, Reichek N: Twodimensional echocardiographic imaging of the left ventricle: Comparison of mechanical and phase array systems in vitro. Am J Cardiol 1981;48:728-735
- Conetta DA, Geiser EA, Skorton DJ, Pandian NG, Kerber RE, Conti CR: In vitro analysis of boundary identification techniques used in quantification of two-dimensional echocardiograms. Am J Cardiol 1984;53:1374-1379
- Gould KL, Lipscomb K, Hamilton GW, Kennedy JW: Relation of left ventricular shape, function and wall stress in man. Am J Cardiol 1974;34:627-634
- Mirski I: Review of various theories for the evaluation of left ventricular wall stress, in Mirsky I, Ghista DN, Sandler H (eds): Cardiac Mechanics: Physiological, Clinical and Mathematical Considerations. New York, John Wiley & Sons, Inc, 1974, pp 381-409
- McHale PA, Greenfield JC: Evaluation of several geometric models for estimation of left ventricular circumferential wall stress. Circ Res 1973;33:303-312
- Ford LE: Heart size. Circ Res 1976;39:297-303
- Ross J Jr: Applications and limitations of end-systolic measures of left ventricular performance. Fed Proc 1984; 43:2418-2422
- Teichholz LE, Kreulen T, Herman MV, Gorlin R: Problems in echocardiographic volume determinations: Echocardiographicangiographic correlations in the presence or absence of assynergy. Am J Cardiol 1976;37:7-11
- Ganau A, Malavasi A, Cassisa L, Piga G, Cuccurn L, Campus S: Non-invasive assessment of end-systolic pressure-volume and stress-dimension relationships in man: Linearity and relation to ejection fraction. Cardiologia 1984;29:323-326
- Zar JH: BiostatisticalAnalysis. Englewood Cliffs, NJ, Prentice- Hall, Inc, 1984
- Strauer BE: Structural and functional adaptation of the chronically overloaded heart in arterial hypertension. Am Heart J 1987;114:948-957
- Friberg P, Folkow B, Nordlander M: Cardiac dimensions in spontaneously hypertensive rats following different modes of blood pressure reduction by antihypertensive treatment. J Hypertens 1986;4:85-92
- Leenen FHH, Prowse S: Time-course of changes in cardiac hypertrophy and pressor mechanisms in two-kidney, one clip hypertensive rats during treatment with minoxidil, enalapril or after uninephrectomy. J Hypertens 1987;5:73-83
- Wikstrand J: Left ventricular function in early primary hypertension: Functional consequences of cardiovascular structural changes. Hypertension 1984;6(suppl III):III-1118-III-116
- Casale PN, Devereux RB, Milner M, Zullo G, Harshfield GA, Pickering TG, Laragh JH: Value of echocardiographic measurement of left ventricular mass in predicting cardiovascular morbid events in hypertensive men. Ann Intem Med 1986; 105:173-178
- Levy D, Garrison RJ, Savage DD, Kannel WB, Castelli WP: Left ventricular mass and incidence of coronary heart disease in an elderly cohort: The Framingham Heart Study. Ann Intem Med 1989;110:101-107
- Devereux RB, Hammond IW, Alderman MH, Spitzer MC, Laragh JH: Difference in left ventricular performance and contractility indices between normal men and women (abstract). Clin Res 1986;34:293a
- Carabello B, Nakano K, Corin W, Biederman R, Spann JF Jr: Left ventricular function in experimental volume overload hypertrophy. Am J Physiol 1989;256:H974-H981
- Hsia HH, Starling MR: I
s it necessary to standardize left ventricular elastance for heart size (abstract)? Circulation 1988;78(suppl II):II-523