Article
Related Links
Andrew Blake Bernard
A thesis submitted to the Graduate Faculty of North Carolina State University in partial fulfillment of the requirements for the Degree of Master of Science
Abstract
Clothing comfort is defined by the tactile sensations felt by a subject through the mechanical interactions between the body and the garment. This research investigated the mechanical properties of 100% woven cotton fabric that significantly contribute to the perceived in-wear comfort of garments treated by various laundering methods. Treatments included washing methods using detergents and softeners, as wells as after treatments with selected starch applications.
The treated fabric samples were initially assessed via development and execution of a hand panel consisting of 26 females. Mechanical properties of the samples were measured using the Kawabata Evaluation System. A comparison of hand ratings and KES properties of each treatment showed a significant difference between treatments. Subjects were not able to perceive a difference between two of the treatments and after testing of other treatment methods a sample set was selected for a wear test. Four of the nine bipolar descriptors correlated well with overall hand ratings including harsh/soft, rough/smooth, sandy/slippery, and rigid/flexible.
The hand panel results were employed to design a full garment wear test. The same fabric was used for manufacturing button down blouse garments of varying sizes to fit the human subject panel of 29 females. In this experiment, subjects performed four activities of controlled dynamic movements and rated the garment after each activity. The activities ii included: donning where subjects simply changed into garments; arm crosses where subjects switched the position of two small weights on a counter top by crossing their arms; toe touches to arm raises in one continuous movement; and bowling where subjects played a bowling game on a Nintendo Wii systems that required subjects to make bowling motions with one arm.
Correlation models were then developed for the dynamic garment wear test and Kawabata measurements. The type of dynamic movement performed had a significant effect on comfort ratings. A final model was constructed correlating mechanical properties to descriptors which were correlated to overall comfort. The descriptors significant to predicting overall comfort were scratchy and stiff which were included in the model with the activity type. The mechanical properties geometric roughness, coefficient of friction, and mean deviation of coefficient of friction were correlated to the descriptor scratchy and the mechanical property shear stiffness was correlated to the descriptor stiff. Locations of sensation were identified during each activity and will be used in further wear testing to measure dynamic properties.
Committee Member
Biography
Andrew Bernard was born in Raleigh, North Carolina. He started attending North Carolina State University in the fall of 2003. He completed a Bachelor of Science in Textile Engineering, with a concentration in Product Design, in the spring of 2007. He continued his education in the fall of 2007 by pursuing a Master�s of Science in Textile Engineering with a Minor in Statistics. During this time he studied Six Sigma, Baldrige Criteria, Design for Six Sigma, Lean methodology, Design of Experiments, Simulation, new product development, and various software packages. His interests include quality improvement, product development, and business operations, which he has plans to practice and study in the textile industry.
Acknowledgments
I would like to thank Dr. Barker, Dr. Hinks, and Dr. Arroway for their guidance and help throughout my research and for serving on my committee. I would also like to thank my project sponsor Steve Singleton and his associates at Unilever for providing me with the project as well as their knowledge and support. Great thanks to Gail Liston for her ideas, support, and many dedicated hours of assistance. Finally, I would like to thank my family and wife for their continuous support and encouragement throughout my years of education.
1. Introduction
1.2 Fabric Hand and Clothing Comfort
Fabric hand is commonly used for predicting clothing comfort before a garment is manufactured and ultimately worn. The assessment of fabric hand is an important yet complicated subject that has been comprehensively studied in the field of textiles. Researchers are continuously looking for more accurate and more efficient ways to assess fabric hand objectively and subjectively. Studies that correlate mechanical properties and human perception have made progress over the years but little success has been made in replacing subject testing with an equally accurate but more efficient instrument. Equipment to measure mechanical properties of fabrics that contribute to fabric hand has been a key area of research due to equipment inconsistencies and inefficiencies. Subject testing is always difficult in any area and in the assessment of fabric hand it is difficult to account for all major factors that cause variations in human perception. Correlation between objective measurements and subjective assessment can be valuable in product and method development. Subject testing is expensive and time consuming and any system that is sufficiently efficient and accurate to predict subjective responses would be of value as a substitute for subject testing.
The issues with fabric assessment begin with defining fabric hand and clothing comfort. The definition of fabric hand has varied since it was first defined. Pierce described hand as being the perception of the consumer, which depends on factors such as time, place, season, fashion, and personal preferences (Peirce, 1930). Although the factors Pierce describes are important to consumer perception, his definition does not include tactile response as a factor. Many other early researchers shared similar opinions but later defining fabric hand using mechanical properties became popular throughout the field. Raheel and Liu defined fabric hand as a comprehensive subjective evaluation of a textile material obtained from a tactile feeling. The tactile feeling is described as a result of a physical stimulation from the mechanical properties of the material (Raheel, 1991). Kawabata employed the following concepts of hand in his research of standardizing hand evaluations. Kawabata�s first concept is similar to recent definitions that state individuals judge a fabric through physical stimuli that are a result of mechanical interactions. Kawabata also stated the criteria for hand judgment are based on the material�s intended end use (Kawabata S, 1980). The end use of the product has a large impact on how a subject responds to the mechanical properties of a material. For instance, properties related to softness could be much more important in sleepwear garments than they are in protective clothing. Therefor
e, it is important for subjects to understand the end use of the fabric before they begin any evaluations. Past research has shown that fabric hand has a significant correlation to clothing comfort and often an assessment of hand is used to predict clothing comfort.
Some research has focused on the assessment of comfort while the material is being used for its intended end use. This means that assessment is performed using sensations in regions of the body other than the hands, which adds complexity. Clothing interacts with the skin on the body dynamically and continuously while in wear (Li & Wong, 2006). Therefore, factors such as force, pressure, acceleration and velocity are important additions to material properties such as shear, bending, compression, tension, and weight that already describe fabric hand. Understanding the impact, if any, of these properties on human response while a material is in its end use, could lead to an improved method of predicting comfort.
Much like fabric hand the definition of sensory comfort has developed over time. The main aspects of clothing comfort include thermophysiological comfort, sensorial comfort, body movement comfort, and aesthetic appeal (Li & Wong, 2006). There have been many studies on human comfort response to garment wear in terms of fabric mechanical, surface, heat and moisture transfer properties. Subjective comfort responses must be interpreted within the context of the subject�s physiological and psychological response. The personal experiences of each subject are different and therefore their expectations differ, which has a significant affect on their response. Perceived comfort is also significantly affected by garment design, fit, and end-use conditions. When considering all the variables at the same time the best currently available approach is to measure total comfort is to obtain subjective evaluations (Barker, 2002).
The theoretical foundation for physical mechanisms tactile and pressure comfort of clothing is not as developed as thermal and moisture comfort of clothing. However, research has mainly focused on relationships between fabric properties and various tactile and pressure sensations. From these studies a set of common tactile sensations, including but not limited to prickliness, itchiness, stiffness, softness, smoothness, roughness, scratchiness, fit, and pressure, were found to be significant to clothing comfort (Li & Wong, 2006). Most studies include a form of physical activity that induces sweating and heating of the body. In a comfort study on hospital gowns, conducted by Barker et al., subjective responses during both periods of activity and periods of rest were obtained. The study found that subjects sensed qualities of bending stiffness, shear stiffness and surface roughness during periods of little activity in a cool environment. Qualities of skin contact sensations and fabric cling were sensed during physical activities or in a warm and humid environment (Barker, 2002).
In vivo physiological measurements haven been increasingly researched due to the increasing demand for high performance clothing. Methodologies and devices have been developed for measuring physiological responses such as temperature, humidity, skin pressure, sweating rate, skin wetness, skin blood flow, oxygen consumption and heart rate (Li & Wong, 2006). Many studies have been conducted on the physiological responses of clothing comfort, especially on thermophysiological comfort. In a study by Unilever Research and Development at Port Sunlight Laboratory and the Institute of Textiles and Clothing at The Polytechnic University of Hong Kong, researchers aimed to reduce the thermophysiological discomfort of fabric during wear that is caused by everyday wetness and heat. In this study, Boardman et al. reported comfort as a sensory state in which the brain is not negatively affected by distractions or unwanted input from the skin (Boardman, Singleton, Jones, Li, & Lei, ). The study collected physiological and psychological responses to garments that were treated with hydrophilic and hydrophobic agents. In-wear wetness and heat measurements were reported using several different techniques. The authors found that measuring electrical resistance of the skin was the best technique for differentiating sweating performance of different treatments (Boardman, Singleton, Jones, Li, & Lei,).
In another study on sensory comfort of denim products, Kwok et al. attempted to identify important attributes for an ideal pair of jeans by identifying the satisfactory level of hand assessed by subjects, and gathering subjective and objective evaluations of garment pressure comfort and distribution. Subjective assessment of pressure comfort was gathered using trials of paired comparison. Subjects wore two pairs of jeans per trial and performed nine different postures. In each posture position the subjects provided a rating of pressure comfort for 12 different body locations. The objective measurements were completed using pressure sensors placed between the skin and the inner surface of the jeans at the 12 body locations. Also, for this testing the subjects age and body dimensions, measured at the waist, hip, thigh, and knee, were used as additional factors. The study concluded that denim fabric should be light, smooth, and not too thin in order to provide good hand sensation. The front waist, crotch, and pelvis were identified as areas with the most significant garment pressure during daily activities. Pressure was measured as an in-wear factor affecting comfort, which may be most significant during static postures (Kwok, Wong, Li, & Zhang, 2006). However, dynamic motions must also be considered in comfort responses to in-wear tactile sensations.
Extensive research has been carried out to develop methods of predicting aspects of clothing comfort performance by measuring fabric properties. Cardello et al. conducted a study that developed models to predict comfort of military clothing. The research resulted in standardized methods and multiple regression models that were later tested in wear trials with other garments (Cardello, 2003).
Methods such as linear regression, neural networks and fuzzy logic have been used to predict human perceptions. Recent models to predict fabric comfort have become more and more successful. However, more studies are needed in order to explain more of the variation in comfort perceptions. Wong et al. conducted a more recent study that used hybrid models of traditional statistics, neural networks, and fuzzy logic to predict clothing sensory comfort. Several different hybrid models were constructed using different sequences of the three methodologies. The study identified which models were the best predictors and showed that hybrid models may provide better prediction models than using a single method such as traditional statistics (Wong, Li, & Yeung, 2004).
Wong et al. employed stepwise regression methods in a study that constructed models using the frictional coefficient, the compressional energy, the maximum wetted radius and the geometrical roughness to predict overall comfort. The model resulted in a correlation coefficient of .987 between the calculated and experimental values of comfort. The weakness of this method is that fabric physical properties must be selected subjectively in order to reduce the number of independent variables. Furthermore, mean values of properties and subject ratings must be used in order to create the model, which means that individual response information is lost. This method is simple to conduct and can produce a good model for prediction of comfort preference (Li & Wong, 2006).
1.3 Subjective Evaluations
Experimental subjective evaluations of fabrics are difficult and time-consuming to conduct due to the inherent and varied differences in individual�s perceptions and preferences. Nevertheless, how consumers perceive fabric hand and comfort should always be taken into consideration when developing new fabrics and garments, and when applying
chemical treatments to these materials. There has been much research over the years on subjective evaluation methods and analysis. Researchers have produced models with strong correlations between objective and subjective data with only limited success. Results are typically difficult to repeat and the variation between different studies and different labs tends to be high. The infinite number of factors affecting human perception makes it difficult to explain all variation in subjective responses. Furthermore, the fundamental causes of variation make it difficult to develop standardized methods that can be adopted by all researchers.
1.3.1 Judges/Subject Type
In the second edition of �The Standardization and Analysis of Hand Evaluation�, Kawabata attempts to reduce subjective assessment variation by selecting expert panel members as part of a committee to evaluate fabric hand (Kawabata S, 1980). Kawabata reasoned that although the consumer is the most important opinion, they are not sufficiently experienced to make decisions about fabric hand. However, consumers do feed their opinions back to the producers who engineered the fabric and these experts have more knowledge and experience with fabric hand. Therefore, �The Hand Evaluation and Standardization Committee� was created from experts in engineering and finishing of fabrics so that the committee could use expert opinion to better assess the fabric hand (Kawabata S, 1980).
Consumers and experts vary in vocabularies and experience with fabrics. Some researchers have used both expert judges and consumer judges while keeping their assessments separate when conducting their analysis. Other researchers have only used trained judges such as the study by Matsuo et al. on the method for measuring hand (Matsuo T, 1972). Choosing the type of judges depends on the purpose and objectives of the study being conducted. Expert judges may be well equipped to quantify the sensory qualities of products and consumer-based judges can determine market preferences of products. Therefore, evaluations by trained or expert judges should be compared to measures of physical properties while quantifiable responses from consumers should be compared with consumer preference (Winakor, Kim, & Wolins, 1980).
Selecting the judges as being male only, female only or both genders has been a topic of discussion when trying to reduce variation in responses from judges. In an early study on human perception in clothing comfort, researchers defined the number of panel members required to make distinctions of significant value as the critical panel size. They found in their studies that when men and women are compared the critical panel size is smaller with women than men (Hollies, Custer, Morin, & Howard, 1979). This means that the female responses had less variation than the male responses. Many studies have used both female and male judges but a majority of the time their responses are analyzed separately. Although female panels typically provide a more accurate and consistent response, the gender of subjects is a small part of the overall variability between individuals and their perception of comfort (Winakor et al., 1980).
1.3.2 Rating Scales and Methods
Rating scales used for subjective evaluations are another important part of obtaining useful information from test subjects. The decision of what type of rating scale to use depends on the objectives of the study. Some rating scales may be more useful for simply comparing subjective assessments, while other scales are used for comparing subjective and objective data. An important issue with objective data is that instruments measuring the mechanical properties of textiles can be highly sensitive. The scales used in human assessment typically have a small number of intervals (Winakor et al., 1980). Understanding the differences in the degree of sensitivity between subjective ratings and objective measurements is required because small changes in fabric properties may not have an affect on the subject ratings. Two test methods are widely used today. One is a direct method, which is a procedure of evaluating textiles according to a subjectively defined ordinal scale. This approach employs a scale that is numbered with descriptions for each number such as 1-poor, 2-sufficient, 3-average, 4-very good, and 5-excellent. The second method typically uses a comparative method that involves sorting textile samples based on defined subjective criteria. The result of this procedure is a set of textile samples ranked in some order such as from best to worst (Militky, 2005).
The first method of direct assessment presents samples to subjects individually, or one sample at a time. This typically is used with a scale in which subjects give a numerical rating for descriptors of fabric characteristics. Scales of this type are difficult because not only can there be differences between each judge�s perceptions of the scale but there could be changes within the same judge�s perception of the scale during the testing interval. Differences in how an individual perceives a scale has led some researchers to use the ranking method. With a small sample size the comparative ranking method is commonly employed and can be easily carried out. However, when a larger group of samples is to be assessed then it becomes logistically more difficult to conduct an ordered ranking so a paired comparison is often used. In paired comparison experiments every combination of two different samples are presented to a subject and they respond by deciding which sample they prefer. The items are then ranked according to the total number of selections that were preferred (Ellis & Garnsworthy, 1980).
Subjective judgments are usually based on a comparison with a control or standard. In a commercial environment the control typically lies within the memory of the consumer, which is created through their personal experiences (Boos, 2005). Using memory as the control group is complicated due to the fact that memory fades with time and preferences may change over time. This is another reason why the comparative method is popular.
1.3.3 Semantics
Describing fabric hand and comfort is another challenge when conducting subjective testing. Researchers have worked to produce standard terms that minimize variation in subjective responses. A person�s gender, culture, age, experience, etc. can all effect how descriptions of certain properties of a fabric material. Many studies have been conducted to identify descriptors of hand. When using the identified descriptors there are two methods, single and bipolar, that are widely used in hand evaluations (Boos, 2005). A single method uses a single descriptor term and a scale where subjects rate how well the term describes the fabric. A bipolar method uses two descriptors terms that are anonyms and subjects make ratings on a scale between the two terms.
There are many terms that could be used to describe hand. Early studies have used various forms of factor analysis to identify key terms important to the judgment of the overall hand. Howorth et al. found that 86% of overall hand was based on the nine descriptors: smoothness, softness, firmness, coarseness, thickness, weight, warmth, harshness and stiffness (Howorth & Oliver, 1958; Howorth, 1964). A study by Matsuo et al. concluded that many raw descriptors can be translated in to what they referred to as �Terms of the Basic Hand�. In this study, Matsuo et al. translated 352 expressions to basic terms that could be compared to the mechanical properties of a textile fabric (Matsuo T, 1972).
Rating a textile material based on descriptors has been done using single descriptors or a bipolar set of descriptors. Both the ASTM Committee on Sensory Evaluation and the AATCC has developed terms to be used during standard protocols. The ASTM D123 procedure and the AATCC Evaluation Procedure 5 list single and polar
paired descriptors to be used (Boos, 2005). Many of these protocols and studies have adopted descriptors discovered by Kawabata and The Hand Evaluation and Standardization Committee (Kawabata S, 1980). Common single descriptors used are stiffness, smoothness, fullness, liveliness, crispness, flexible, soft, etc. (Kawabata S, 1980). The uses of bipolar descriptors, such as the ones described by Winakor et al. in Table 1, are also commonly employed in the evaluation of hand (Winakor et al., 1980).
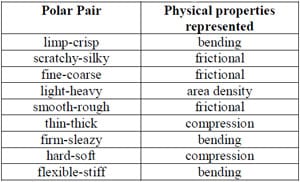
Table 1: Polar Descriptors
There are slight differences in the use of descriptors, which may be attributed to the difference in objectives of each study. More recent research has focused on correlating objective measurements with subjective evaluations, which requires the use of these descriptors.
1.4 Objective Measurement
The objective measurement of fabric hand can be dated to work by Peirce on fabric bending and compression in the 1930�s (Peirce, 1930). In the 1950�s and 1960�s work at the Swedish Institute for Textile Research (TEFO) in Sweden was focused toward objective measurement and analysis of fabric bending, buckling, tensile, shear and compression properties. This research used objective measurements to analyze relationships between mechanical properties and the ability to tailor and form fabric into three dimensional garments (Kawabata, Postle, Niwa, & Nihon Seni Kikai Gakkai, 1983). More recently, instrumentation has been developed to measure mechanical properties that specifically contribute to fabric hand and quality. The two primarily used fabric objective measurement systems are the Kawabata Evaluation System for Fabrics (KES-F) and the Fabric Assurance by Simple Testing (SiroFAST). The following section will discuss both systems as well as a general description of some alternative methods used for objectively measuring fabric hand.
1.4.1 Kawabata Evaluation System for Fabrics (KES-F)
The Kawabata evaluation system is one of the first sets of instruments developed to measure the mechanical properties of a fabric at low stresses. This means that the fabric samples are not stressed to failure. Kawabata and Niwa began developing the KES in 1972 when The Hand Evaluation and Standardization Committee was formed (Boos, 2005). The system was developed by Kato Tech. Co. of Kyoto, Japan, and the first set of machines was released in 1972. A later model, called the KES-FB, was released in 1978. The KES-FB was designed to reduce the time required for specimen preparation and testing. Shortly after this the system was adopted in Japan and to some extent worldwide. The final series of this system was completed in 1997, called the KESFB-AUTO-A System, which includes automated sample loading procedures in order to reduce operator working time (Boos, 2005). The development of a more automated system is important in order for the system to be accepted as a commercially viable method. This section will give an overview of the KES instruments and mechanical properties measured. However, there are many publications that discuss and use the KES and some distinct publications describe the system in detail (Behery, 2005; Kawabata, 1980; Kawabata & Niwa, 2001; Kawabata, Postle, Niwa, & Nihon Seni Kikai Gakkai, 1982; Kawabata et al., 1983; Stylios, 1991).
The system was developed based on the following concept: When a person handles a fabric they feel sensations that correspond to the fundamental deformations of the fabric. These sensations lead to a subjective evaluation. Therefore, fabric hand can be described in terms of mechanical properties (Kawabata, 1980). The complicated mechanical properties of fabrics that correspond to the fundamental deformations were selected based on previous research. Studies prior to KES used more primitive methods to measure properties such as weight, thickness, cantilever bending, initial modulus and surface friction (Barker & Scheininger, 1982). Past methods for measuring mechanical properties were useful, but they were not focused toward fabric hand and comfort. The introduction of the KES was considered a significant advancement toward correlating subjective evaluation and objective evaluation.
The system consists of four different instruments that create a combined output of 27 different measurements. Measurements of shear, tensile, bending, and surface are made in both the warp and the fill direction while compression and weight are non-directional properties. By averaging the warp and the fill measurements, the output is reduced to 16 properties (Boos, 2005; Kawabata, 1980). An additional instrument, called the Kawabata Thermolabo, was added in order to measure a thermal property of fabric hand. The additional test brings the total number of properties measured by the KES to 17 (Chen, Barker, Smith, & Scruggs, 1992). Measurements of compressibility and extensibility have been added as measurements given by the four instruments. All objective properties typically measured during KES testing are listed in Table 2. Weight is measured according to ASTM D 3776 small swatch option and not by one of the four KES instruments. Specimens (20x20cm) are weighed on an analytical balance and the weight is calculated in mass per unit (oz/yd2).
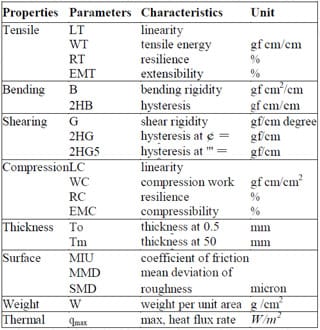
Table 2: Mechanical Property Parameters measured by KES
1.4.1.1 KES-FB1 Shear/Tensile Tester
The KES-FB1 instrument measures both shear and tensile properties. These properties are directional and measurements are taken in both the warp and weft directions. The sample is loaded and a standard gauge width of 5 cm x 20 cm is used for testing. The shear properties are measured by applying a pretension load to the sample of 10 gf/cm and then applying parallel forces to the fabric until a maximum offset angle of 8 degrees is reached (see Figure 1). A graph is plotted of the gf/cm by the degrees offset and three properties are obtained. The properties include shear stiffness, hysteresis at 0.5 degrees, and hysteresis at 5 degrees. The main property of concern is shear stiffness, G, which can be more simply described as the ease with which the fibers slide against each other. Lower values of shear stiffness indicate less resistance to the shearing movement corresponding to a softer material having better drape.

Figure 1: KES-FB1 Shear Tester
Tension is also measured by the KES-FB1 instrument and results in four properties. The properties are dependent on direction and therefore measurements are taken in the warp and fill direction. The same sample from the shear test is used with the same gauge length of 5 cm x 20 cm. Stress-strain characteristics are measured as a 500 gf/cm tensional load is applied to the fabric sample. Important outputs of this particular test include tensile resilience and extensibility. Tensile resilience, RT, indicates the recovery of deformation from the strain after the applied force is removed. Higher values indicate greater recovery from stretching. Extensibility, EMT, is the percent strain at the maximum applied load where higher values signify a greater extensibility (see Figure 2).

Figure 2: KES-FB1 Tensile Tester
1.4.1.2 KES-FB2 Bending Tester
The KES-FB2 measures properties of bending deformation, which is direction dependent so measurements are made in both the warp and fill direction. The effective sample size is 20 cm x
1 cm, which is loaded vertically to prevent gravitational effects. Cyclic bending deformation between a curvature of -2.5 cm-1 and 2.5 cm-1 is applied to the sample at a constant rate of curvature change of 0.5 (cm-1)/sec. The bending rigidity, B, is the force required to bend the fabric sample to +/- 2.5 cm-1, approximately 150 degrees. Higher values of B indicate greater stiffness or resistance to bending deformation (see Figure 3).

Figure 3: KES-FB2 Bending Tester
1.4.1.3 KES-FB3 Compression Tester
The KES-FB3 measures properties of compression and thickness. These properties are not dependent on direction so measurements in the warp and fill directions are not needed. The instrument applies a force up to 50 gf/cm2 to a 2 cm2 circular area at a constant velocity and measures the thickness with respect to the force per area applied. The device takes measurements during the compression process and the recovery process. Important properties of this instrument include compressibility, compression resilience, and thickness. The compressibility, EMC, is a comparison of the initial thickness measurement to the thickness at the maximum applied force. Higher values of EMC denote a greater compressibility. The compression resilience, RC, is the regain in thickness when the force applied is removed. Larger values of the RC property denote a higher percent recovery from being compressed. Thickness is measured and reported at an applied force of 0.5 gf/cm2 (see Figure 4).

Figure 4: KES-FB3 Compression Tester
1.4.1.4 KES-FB4 Surface Tester
The KES-FB4 measures properties of friction and geometric roughness of the surface of textiles in both the warp and fill direction. The sample is pulled tight by applying a tension load of 20 gf/cm for a standard test. The surface friction is then measured with a set of 10 parallel piano wires with a diameter of 0.5 mm. These wires are pressed against the fabric with a force of 50 gf by a dead weight. The sample is then moved between 2 cm intervals at a constant velocity while the contactor of piano wires is kept stationary in order to record a measurement of resistance. A similar procedure is used to measure the surface roughness but the difference is that the contactor is made of only one piano wire. The contact is pressed against the fabric with a force of 10gf and the device records the vertical movements of the probe. The coefficient of friction, MIU, is recorded from the first test mentioned above and a increasing value is a function of increasing surface friction. Higher values of geometric roughness, SMD, denote rougher surface (see Figure 5).

Figure 5: KES-FB4 Surface Tester
1.4.2 Fabric Assurance by Simple Testing (SiroFAST)
The SiroFAST system is another set of instruments designed to measure the mechanical, physical, and dimensional properties of a fabric. The system was designed by Commonwealth Scientific and Industrial Research Organization (CSIRO) in Australia in the late 1980s to overcome the disadvantages associated with the KES-F system. In most practices the KES-F system was too complex and expensive for use in a production mill environment and the SiroFast system was designed to be easier to use (Boos, 2005). However, each system was designed for different intensions of use. The KES is designed for measuring the hand of fabrics while the FAST system was designed for measuring properties of fabrics important to the intended performance and the appearance of tailored garments in-wear (Stylios, 1991). Comparative studies of the two systems showed little difference in terms of the mechanical properties (Ma, 2000; Yick, 1996). This section will provide a brief overview of the SiroFAST system.
The SiroFAST system is much like the KES-F system in that it is made up of four instruments that measure many of the same properties. The first of the set of instruments is a SiroFAST-1 Compression Meter that measures the surface layer thickness of a fabric. The surface layer thickness is defined as the difference of the fabric thickness at two predetermined loads. This physical property is important in understanding effectiveness of milling, raising and pressing operations in finishing (Stylios, 1991).
The SiroFAST-2 Bending Meter measures the bending length of the fabric in both the warp and the fill direction. The bending length is measured through a cantilever test described in British Standard 3356. This technique has been improved from previous cantilever tests in that it uses optical sensors to detect the leading edge of the fabric, which eliminates operator error of determining the end point (Boos, 2005). The bending length and the fabric weight are then used to calculate the bending rigidity, which is a good indicator of the stiffness of a fabric.
The SiroFAST-3 Extension Meter is an instrument used to measure the extensibility of the fabric in the warp, fill, and bias directions. The extensibility in the warp and fill directions is typically measured with three different loads, while the bias direction is measured with the lowest of the three loads. The purpose of measuring the bias direction is to obtain a property of shear rigidity. Extensibility and shear rigidity are important for determining fabric performance and effectiveness of many finishing operations (Stylios, 1991).
The final instrument of the system is the SiroFAST-4 Dimensional Stability Test. This test measures the relaxation shrinkage and expansion of a fabric as it goes from wet to dry (Boos, 2005). These two properties contribute significantly to dimensional stability problems in garment manufacture and appearance in-wear. Therefore, it is important for fabric finishers to measure these properties in order to adjust wet processing to meet necessary requirements for garment production.
Using the SiroFAST system is easier than the KES-F system, but the properties measured are more limited. The SiroFAST system does not measure hysteresis/recovery properties of fabrics, which have been found to correlate well with aspects of fabric hand. The system also does not include measurements of surface properties that correspond well with hand characteristics such as smoothness or roughness. However, the SiroFAST system does include measures of dimensional stability, which are not included in the KES-F system (Boos, 2005). Both systems have similarities and differences as well as advantages and disadvantages.
1.4.3 Other Methods
There are many other methods of measuring the mechanical properties of a fabric that have been investigated. The ring and slot methods are two techniques that claim to be quick and easy. These methods are based on pulling a fabric through a ring or pushing a fabric through a slot and measuring the resistance to the push or pull mechanisms. There have been many variations of these methods due to lack of standardization. Variations in the ring method include differences in sample shape, dimensions, and ring diameters. The ring method is more complex because the sample arrangement is three dimensional. The slot method uses a two dimensional sample arrangement. Both of these methods directly measure the force required to push or pull the fabric through the ring or slot (El Mogahzy, Kilinc, & Hassa
n, 2005).
Another method, called the �El Mogahzy-Kilinc Hand Method�, was developed more recently in attempt to overcome the problems of statistical reproducibility and characterization parameters in previous methods. The method is similar to the ring and slot methods except that the fabric is pulled through a flexible light funnel. The funnel is believed to be a better medium for simulation of drapability, stretching, internal sample compression, lateral pressure, and surface friction. Similar to the ring and slot method the instrument directly measures the force as it is being pulled through the funnel. The force is measured as a function of time and the curve generated is called the hand profile. There are four zones of the curve that simulate the measurement of different properties and the properties are quantified as the area under the curve in the corresponding zone. The total area under the curve for all zones combined is reported as the �Objective Total Hand�. Studies have shown that this parameter is highly correlated with subjective hand assessments and the different objective parameters that form fabric hand (El Mogahzy et al., 2005).
1.5 Literature Review Summary
Comfort is one of the most important attributes to consumers� clothes. The ability to predict accurately the response of consumers to the comfort of garments could significantly benefit the industry. There are numerous methods that can be used to gather subjective data in both hand panels and wear studies. While significant progress has been made toward the development of standardized methods, accurate measuring devices, and statistical models that can help predict human responses, models to predict full garment in-wear comfort have not been established that fully allow elimination or reduction of human subjects in wear tests.
1.6 Purpose and Objectives of This Study
This study will use a combination of methods to gather different types of subjective responses including descriptor ratings and rankings, overall ratings and rankings, and areas on the body where the most tactile sensation was felt. Most studies measure subjective responses to different garment constructions for specific end uses. However, this study reports measured responses to fabrics with varying levels comfort produced by select laundry treatments such as washing, starching and softening.
Subjective measurements will be obtained using similar methods from past studies. Although the use of expert judges may produce less variable response distribution, the use of consumers and attempts to reduce the variation by choosing a specific demographic of female consumers. The activities used in the subject wear trials will not generate sweat or changes in body temperature. The activities will be designed to create controlled repetitive motions that stimulate tactile sensations between fabric and skin. There has been much success in measuring temperature and moisture properties in vivo as well as simulators such as a sweating manikin, which mimics body movements in different conditions that change body moisture and temperature (Barker, 2002). Methods for measuring tactile sensation properties in vivo have been less successful. More research on tactile sensations in vivo without sweating and increased body temperature is necessary in order to predict clothing comfort.
Subjective testing is difficult and expensive so there is need for an instrument that can replace the use of subjects in assessing clothing comfort. Objective measurements will be obtained using the KES-F system and will be used in development of a model. The KESF system is expensive and difficult to use so it is not used very often in industry. Other instruments like the ring or slot pull through method are somewhat simpler and are intended to mimic typical movements of a person wearing or handling a material. However, this study works toward an improved system that could effectively reproduce key human dynamic motions while measuring factors of clothing comfort.
This report is the first of a two-part research study. The overall objective of the research is to develop instrumentation to predict the in-wear perception of clothing comfort. The primary focus is on evaluating sensory response to changes in physical properties of clothing fabric after different laundering or other physic-chemical treatments. Locations of concentrated tactile sensations will be identified and used to aid the development of a statistical model to correlate human physiological responses with one or more physical metrics of the fabric or garment. Key factors that significantly contribute to the human response of garment comfort after laundering will be identified, assessed and quantified for the development of the prediction model. In the second part of this research, the statistical model will then be employed in the development of an instrumental system that predicts human response and precludes employment of large numbers of human subjects for in-wear garment testing.
In the field of comfort there has been success in modeling perceptions of comfort after sweating and increased body temperature. However, when it comes to measuring tactile response researchers commonly must use experiments that involve human subjects. Recently, there has been increasing focus on the field of tactile response. Fabric properties can be measured using instruments from such systems as the Kawabata Evaluation System for Fabrics (KES-F) and the Fabric Assurance by Simple Testing (SiroFAST). During wear areas of the sensation due to fabric properties and forces such as pressure may vary perceptions of comfort. Hence, part of this study will involve a protocol for gathering and correlating objective and subjective evaluations of fabric hand and comfort. Physical property values measured by the Kawabata Evaluation System (KES) will be used to gather objective assessments of the fabric. Subjective assessment values will be gathered through hand panel evaluations and garment wear tests. The primary objectives of the first part of the study are to predict in-wear tactile sensations at the garment level after a laundering treatment.
The second part of the research will focus on quantifying and correlating dynamic physical stimuli, produced while wearing a garment, to human response of comfort tactile sensations. Methods for measuring dynamic forces that may affect perceived comfort will be developed. In addition, a comprehensive review of sensors for measuring forces and interactions between the fabric and skin will be conducted. A systematic understanding of the correlations between fabric properties, in-wear garment dynamics, and skin to fabric interactions with human responses will allow for the development of a reliable instrument that can measure important in-wear properties that predict human response.
Results from the first study will establish the fundamental data required for advancing the second part of the research. First, it will provide locations of tactile sensations during certain controlled movements which will help with placement of sensors. Also, it will provide a protocol for developing prediction models for other garments with different end uses. The protocol could also be used to repeat the wear study but with a focus on dynamic properties of the garment. By developing an instrument that can mimic key dynamic movements of the body and measure properties of the garment in-wear, fabric comfort could be assessed more efficiently by reducing or eliminating subject testing.
2. Hand Panel
2.1 Purpose and Objectives
The first stage of the research involved the establishment and assessment of a hand panel in order prepare appropriately treated fabric with a range of fabric hand properties for the garment wear study to be conducted later and to aid in selection of an appropriately sensitive set of human subjects. This is impor
tant to the objective of creating a model that correlates objective measurements to subjective ratings. In order to create the statistical model there must be significantly different levels of each factor and significant difference in the levels of the response. The factors are the physical properties measured by KES and the response is the ratings of the judges.
2.2 Treatment Methods
A focus of the project is on treatment of fabrics rather than the effects of the fabric structure on hand properties. Therefore, the study focuses on creating samples by treating a single fabric that is typically used for manufacturing shirts and blouses. Initially, a 100% bleached cotton knit and a 100% bleached cotton plain weave fabric were assessed. Both fabrics received five different treatments, using detergents, softeners, and stiffener, that the research team felt could be differentiated by handling.
Both the knit and woven fabrics were received as two rolls. Each roll was cut into five sections for the five different treatments. The five treatments are as follows:
FC = fabric control (no treatment)
FW5 = fabric washed and dried 5 times with detergent (standard AATCC method)
FSO= fabric softened overnight; samples was washed and dried 5 times with fabric softener per directions on the bottle for medium loads; additionally soaked overnight (12+ hours) in 1:1 fabric softener-water solution.
FSTL = fabric starched light; samples was washed and dried 5 times and lightly starched per directions on the bottle (1 part liquid starch – 6 parts water)
FSTH = fabric starched heavy; sample was washed and dried 5 times and heavily starched per directions on the bottle (half liquid starch – half water)
The fabrics were washed according to AATCC Test Method 135 using AATCC standard detergent. Extra ballast fabric was added to each load so that all loads were of equal weight, 4 pounds. Commercial softener and starch were used in the treatments. Sample C was first softened five times using the directions on the bottle. However, due to lack of perceivable effect and fabric hand the sample was additionally soaked in highly concentrated softener to reach a softness of significant difference. After-treatments were completed the samples were cut in to 8 inch by 8 inch swatches for both subject evaluation and KES testing. The samples wrinkled easily so they were steam ironed in order to keep a more uniform surface across all treated samples. Before testing the woven and knitted fabrics were reviewed by the research team. The knitted samples had minimal perceivable differences in hand and therefore were not used in testing. Testing was conducted using only the plain weave fabric with the five treatments previously described.
2.3 Methods/Procedures
The hand panel subjects were selected a specific panel of judges to minimize variations between judges. Females can assess fabric hand better than males and the university has many students readily available for testing. Twenty six female observers in the age range of 18-25 were recruited and all were within a typical range of height and weight. All 26 observers completed the hand panel evaluations.
The hand panel was conducted according to standard AATCC Evaluation Procedure 5, �Fabric Hand: Guidelines for the Subjective Evaluation of�. The subjects were required to wash their hands for 1 minute with Basis sensitive skin bar soap then dry with a paper towel and apply Lubriderm Sensitive Skin therapy Moisturizing Lotion before entering the comfort laboratory. The room was climate controlled with atmospheric conditions held at 70 +/- 3°F (21°;C), 65 +/- 5%RH. The subjects sat for 15 minutes before evaluations could begin in order to acclimate to the room conditions. The hand panel testing was broken into 3 sections.
In the first part subjects evaluated the swatches in a blind study where 2 swatches with different treatments where handed to them on the opposite side of a visual barrier, as seen in Figure 6. Subjects were told that the end use of the fabric was a women�s blouse and that they were to simply indicate which swatch they preferred. All 10 possible treatment combinations were evaluated in a random order by each subject. This blind study removes the visual stimulus factor and allowed subjects to make a simple side-by-side comparison.

Figure 6: Direct Comparison Hand Panel Study
Upon completing the paired comparison, the subjects were asked to sit for 15 minutes and read magazines. This was done to allow subjects to take their mind off the testing and relax their senses before beginning the second part of testing. During the second part of the hand panel experiment subjects were handed a set of fabrics with all five treatments and a set of evaluation sheets with one sheet for each fabric treatment. The sheets contained selected descriptor terms such as �light� and �heavy� that relate to a fabric property such as weight. The terms were separated by a scale that contained no numerical values in order to create a continuous bipolar scale. Figure 7 shows the evaluation sheet used. Subjects were asked to evaluate the fabric and make a mark on the scale between the two terms. The marks were quantified by creating a 0-10 scale with � increments and overlaying it on the blank scale and recording the ratings. Two important descriptor terms used were pleasant and unpleasant in order to allow the subject to give an overall rating to each treatment. Upon completing the descriptor term evaluation the subjects repeated the blind study for the final section of the hand panel assessment to determine the repeatability of the observer judgments. Not only does this allow for conclusions about which treatments are indistinguishable, it also singles out subjects that may not be suitable for the garment wear study.

Figure 7: Bipolar Descriptor Evaluation Sheet
Five different tests, compression, bending, surface, shearing, and tensile, were performed using the KES instruments. The samples were conditioned in standard atmospheric laboratory conditions. KES measurements were made using the standard specimen size of 20 x 20 cm in three replications. All measurements are directional, except for compression, and were therefore made in both the warp and filling directions. Directional measurements were analyzed for significant differences between the warp and filling directions. Since the fabric used was woven in a plain weave structure with a single yarn type, minimal variation was expected for measurements in the warp and the fill directions. For that reason, an average of the measurements in the warp and fill directions is a suitable value for further analysis.
2.4 Results and Discussion
Subjective evaluation data tables are shown in Appendix A. Data analysis was performed using the JMP 7.0 program (SAS, Cary, North Carolina USA). In each blind trial each sample was presented in 4 different combinations to 26 subjects. This yields the possibility of each sample being chosen 104 times per trial. Figure 8 is a chart of the combined data from both blind study trials that displays the number of times a sample was selected by subjects as being preferred. The chart shows that sample FSO was the most preferred and sample FSTH was the least preferred. Less significant differences were noticed between samples FC, FW5 and FSTL.

Figure 8: Pareto Chart of the Count of Paired
Comparison Responses for Each Treated Sample.
Table 3 compares subject preferences between each trial of the blind study. The order of preference remained the same with sample FSO being the most preferred, followed by sample FW5, and sample FSTH was the least preferred. However, the order of samples FC and FSTL is different in each trial. Differences in sample preference were significant in Trial 2, which could be a consequence of subjects becoming more experienced judges throughout the testing process, or it may also mean that samples FC (the control sample) and FSTL (the lightly stiffened sample) are indistinguishable.

Table 3: Comparison of Blind Study Trials
The descriptor term evaluation results corresponded well with the paired comparison data. First, the ratings for each sample were tested for normality using the pvalue from the Shapiro-Wilk test. All p-values were greater than .05 which fails to reject the null hypothesis that the data is of a normal distribution. With a normal distribution the Bartlett test p-value was used to test differences in variances. The p-value was greater than .05 so variances are assumed to be equal among samples. With data being of normal distribution and equal variances an ANOVA test can be used to test differences in means. Figure 9 is a chart of the box plots of the overall subject ratings for each sample. All sample means are significantly different except for samples FC and FSTL. These results correspond to the results of the paired comparison test. Table 4 lists the mean and standard deviations of the overall rating distributions for each sample. See Appendix A for a table of means and standard deviations for all descriptor terms evaluated during the hand panel.

Figure 9: Overall Subject Ratings

Table 4: Overall Rating Distributions
The primary descriptor ratings and their corresponding overall rating for each subject were plotted on a scatter plot. Each correlation coefficient, R2, was recorded and used to determine which primary descriptors contributed the most to the hand values. All regression models were best fit with a linear regression and the R2 values are listed in Table 5.

Table 5: Primary Descriptor vs. Overall Rating
The primary descriptors that subjects found to be most important to the overall rating were Harsh/Soft, Rough/Smooth, Sandy/Slippery, and Rigid/Flexible. Each descriptor is known to correlate well with physical characteristics of the fabric which helps to narrow the search for contributing KES measurements. Properties of bending, shearing, compression, and surface corresponded well with the significant primary descriptors so properties of tension, temperature, weight, and thickness are less significant to the overall hand rating.
KES measurements were taken to verify that significant differences in mechanical properties were achieved through the different treatments. KES property values used for analysis are listed in Table 6. Each property value is an average of at least 3 trials and directional properties are averages of measurements in the warp in filling direction. A complete table of KES properties for each trial and direction can be found in Appendix A.

Table 6: KES Properties
Using the distribution of the trial values for each KES property a comparison of means was conducted. The comparison of means methods used was similar to the previously described methods that were used for comparing the means of the overall subject rating. The KES properties of compressibility, thickness, bending rigidity, surface roughness, extensibility, and shear stiffness were compared using a Student�s t test. The properties were analyzed separately so normalizing the values was not necessary. Standardizing the values using a normal distribution is only used when properties with different units are being compared to each other. In this test, the pairs with p-values greater than .05 were not significantly different.
For the property of compressibility the only samples that did not have a significant difference between measurements were samples FW5 and FSTL. A significant difference in thickness was found for all samples except between FW5 and FSTL. For bending rigidity the only samples that were significantly different from all the others were samples FW5 and FSTH. The surface roughness measurements had a large amount of variation and showed very little difference between samples. The extensibility displayed three levels of significant differences with sample FSO being different from all other samples. Samples FW5 and FSTL showed no difference as well as samples FC and FSTH. The final property analyzed was shear stiffness where all samples significantly different except for sample FSTL showed no difference from samples FC and FW5.
2.5 Hand Panel Conclusions
After analyzing KES properties and subjective ratings it was found that the treatments showed significant differences in both objective and subjective measurements. The �as received� control group, FC, and the lightly starched samples, FSTL, showed no significant difference in subjective ratings. Therefore, there are only 4 differing subjective ratings that contribute to the model. KES properties that are significantly different between samples FC and FSTL are not important to the overall subject rating. The treatments used in the hand panel produced perceivable differences and were considered for treatments of garments in the wear study. Other treatments were created after this hand panel and evaluated by a small group of previous participants in attempt to create five levels of difference instead of four. Despite multiple treatment attempts little differences were perceived and therefore the alternative treatments were not analyzed or considered for garment testing. Similar treatments to the samples FC through FSTL were used at the garment level and assessed by the research team to verify that difference could be perceived before continuing with the garment wear study.
3. Wear Test
3.1 Purpose and Objectives
The purpose of this wear study was to develop a protocol for gathering subjective evaluations of fabric at the garment level and correlating them to objective measurements from the KES instruments, and for this experiment to be a pre-cursor to a new dynamic garment measurement system. The hand panel experiment was used to identify treatments that were considered significantly different in hand. In the hand panel subjects were told the end use of the fabric was a women�s button down blouse to give them a basis for their evaluation of hand. However, when a garment is in-wear it is felt less by the hands and more through interactions between the fabric and the upper body. This wear test used techniques common in assessing garment comfort to create a statistical model that uses mechanical properties to predict subjective assessment.
This garment wear test was designed to
identify locations of contact or sensation significantly contributing to a subject�s evaluation. These locations may be a result of the fabric, the garment design, and/or the movements being performed. The identified interaction points will aid in the placement of sensors to measure forces while the garment is being worn. This study will be conducted in the second part of this research. For this first part of the work, placing sensors on the body during subjective evaluation would disrupt interactions between fabric and skin. Therefore, two separate wear studies are necessary. The first wear study will result in a statistical model correlating physical properties measured from the KES to subject evaluations. The second will result in a statistical model correlating in-wear forces to the subject evaluations. The performance of the prediction models will be assessed. The performance of a combined KES and dynamic model, or models, will be tested, i.e. a model that incorporates in-wear forces and physical properties to predict a subjective response. The following test is the former of the wear studies previously described.
3.2 Garments
The same fabric that was used in the hand panel was employed for manufacture of ladies blouses. All blouses were custom manufactured in North Carolina (www.edgeofurge.com). The style chosen for the blouses was a simple dress shirt that buttons completely down the front with a collar and single button cuffs. The back had shoulder seams with no yoke and two darts in the lower back. The simple blouse style was selected in attempt to create a consistent shirt that all subjects could wear.
Sizes were chosen by each subject after trying on the shirts when they registered to participate. Each subject was assigned a set of 5 garments in their size and each garment received a different treatment. The subject kept the same set of 5 garments throughout testing and each set of garments was only worn by one subject. The results of the hand panel showed no differences between subject ratings for samples FSO and FSTL. However, due to the possibility that the same treatments to samples and garments may result in different outcomes the group decided to test the treatments on the garments. After many different garment treatment methods were tested and assessed by the research group it was decided to continue with similar treatments used in the hand panel. The 5 treatments decided upon resulted in a different feeling hand than fabric swatches but still represented the best spread of treatments of those tested on the garments.
Before treatments were applied the garments were labeled with the treatment identification and a subject number. Garments labeled GC were separated and left untreated as a control group. The rest of the garments were all washed and dried together 5 times in an industrial washer and drier using similar washing procedures described in the AATCC procedure 135 using AATCC standard detergent. Washing and drying cycles were performed in the dying and finishing lab at the NCSU College of Textiles. Temperatures and cycle times used in both washing and drying were comparable, except for a longer drying cycle. The concentration of detergent was closely maintained at 1g/L. The fabric weight was 25.4 kg and the bath used in the washer consisted of 200 liters of water and 200 grams of detergent.
After washing and drying 5 times the garments were separated by their assigned treatment label. Treatment GW5 was complete and taken to a dry cleaner to be pressed. Treatments GSTL and GSTH were also taken to the dry cleaner to be starched and pressed. Treatment GSTL received a light liquid starch while treatment GSTH received a heavy liquid starch. Treatment GS was softened in one 15 minute cycle in the industrial washer using a silicon softener. The wash bath consisted of 50 liters of water at 120 degrees Fahrenheit, silicon softener at 3% of the fabric weight, and 100mL of acetic acid to lower the pH. After drying the garments were also taken to the dry cleaner to be pressed. The garments wrinkled easily during all treatment procedures and therefore required pressing. The final treatment groups used in the wear study are as follows:
GC = garment no treatment (control)
GW5 = garment washed and dried five times with detergent (standard AATCC method)
GS = garment washed and dried five times then softened in one cycle with a silicon softener
GSTL = garment washed and dried five times then lightly starched at a dry cleaner using a liquid starch
GSTH = garment washed and dried five times then heavily starched at a dry cleaner using a liquid starch
3.3 Methods/Procedures
The wear test consists of five sessions in which each subject wears 1 of the 5 treated garments per session. In each session subjects completed four activities that were designed to create consistent repeatable movements. The subjects completed an evaluation form designed to obtain ratings of comfort based on sensory tactile properties during each activity. The first sheet of the evaluation form asked subjects to indicate areas on the body in which they felt the most sensation from contact with the garment. The second page first ask subjects to rate overall comfort, thermal feeling, and softness on a scale of 1 to 7 with 7 being the most comfortable, coolest, and softest. The second set of descriptors include were chosen to represent fabric properties. The terms are negatively stated because subjects are better able detect degrees of tactile discomfort than tactile comfort. These terms were rated on a scale of 1 to 5 with 1 being �totally� and 5 being �no sensation�. Higher values indicate a more desirable quality except for the last term which was positively stated in order test whether subjects were properly and thoughtfully rating the garments. The order in which garments were evaluated was randomized for each subject. This eliminates the effects of run order on the responses.
Subjects chosen for the wear study were of the same background described in the hand panel. They were all female students between the ages of 18 and 25. Most of the subjects were participants from the hand panel and the rest were new participants gathered from the same population of students. The total number of subjects used was 30, typically a sufficient sample size to represent a larger population of a chosen demographic. A sample size of 30 is often large enough to gather data that varies normally about a mean.
The subjects were required to wear long pants (trousers), flat closed toe shoes, and only a bra under the test garment in order to maximize contact between the garment and the skin. Testing was conducted in a climate controlled lab with atmospheric conditions held at 70 +/- 3°F (21°C), 65 +/- 5%RH. Moisture content and temperature of fabrics can have a significant effect on comfort properties and the subjective evaluation. Therefore, all garments were conditioned in the controlled lab for at least 24 hours prior to testing.
When subjects arrived they entered the climate controlled lab and acclimated for a minimum of 10 minutes before changing into their assigned garment. During the acclimation period of 10 minutes subjects were given a thorough explanation of the testing procedures and the evaluation forms. The evaluation form was the same for all activities and can be seen in Appendix B. The importance of focusing on the material of the shirt and providing thoughtful feed back was stressed to subjects before and during testing.
After acclimation was completed the subjects were given their assigned garment and taken to the changing room to begin their first activity. In this activity, the subjects simply changed in to the garment and immediately completed an evaluation form based on their initial assessment. This activity served two purposes. One was to observe if there was a difference in evaluations made after minimal movemen
t and evaluations after some coordinated movements used in the other activities. The second purpose of the activity was to simulate an evaluation of a garment that is typically made while trying on garments at a store.
The next activity required subjects to cross and uncross their arms to create a small range of motion in the upper body. Two small weights were placed 12 inches apart with their positions marked. Subjects were asked to pick up a weight in each hand and switch their positions by crossing their arm. After repeating this movement for a minimum of five times the subjects completed an evaluation sheet. Subjects were allowed to repeat the motion if it was necessary to complete the evaluation. The same evaluation form was used for all activities.

Figure 10: Pictures Showing Cross Body Arm
Movements Used in the In-Wear Garment Test
Upon completion of the second evaluation form the subjects moved to the next activity. In this activity one movement consisted of subjects reaching down to their toes then raising their arms above their head. Subjects were asked to complete this movement for a minimum of three repetitions before filling out the evaluation form. This activity was used to create a long range of motion that would ensure a greater degree of movement in the fabric and contact with the subject�s skin. Again, subjects were permitted to repeat the motion as needed.

Figure 11: Pictures Showing Toe Touches to Arm Raises
Used in the In-Wear Garment Test
In the final activity subjects played a portion of a bowling game using a Nintendo Wii system which requires users to hold a controller and make a bowling motion with their arm. Like previous activities, the motion for this game is simple and repetitive. Subjects were asked to exaggerate the bowling motion by bringing their arm far back and following through to raise their arm up. After repeating the motion a minimum of six times, the subjects completed an evaluation form. Additional movements were allowed. This activity is different from the others because it provides an entertaining distraction which may affect the subject�s assessment of the fabric. One objective of this experiment is to help minimize the perception that the subject was in a laboratory. The bowling motion was also isolated to one arm, which may lead to fewer areas of fabric to skin stimulus than the previous test. This activity completed the testing for one session.

Figure 12: Pictures Showing the Bowling and Completion
of Evaluation Form for the In-Wear Garment Test
After the fifth session was completed subjects were asked to complete a second type of evaluation form, which can be seen in Appendix B. During this evaluation subjects were given all five of the differently treated garments to asses at the same times. Subjects were asked to feel the shirts with their hands and to rank the fabrics for flexibility, smoothness, softness, and stretch. They were also asked to rank them from least preferred to most preferred. This provided a response of direct comparison ranking which is common in general comfort and hand testing. Also during this evaluation subjects provided information about how well the shirt fit them, how often they wore that style of shirt, and how much they liked the shirt compared to a shirt they normally wore of that style. The final part of this form asked subjects to provide a level of importance for each descriptor to their overall preference. Acquiring a level of importance directly from the subject is another means of developing coefficients for a regression model. With the two evaluation forms and the 4 activities, the wear study gathered a significant amount of information regarding in-wear perceptions of women�s dress shirts.
3.4 Results and Discussion
Twenty nine subjects completed wear testing trials and one subject dropped out of testing after completing three visits. After reading through evaluation sheets and entering the data some evaluations appeared to be significantly different from the majority so individual subject ratings were analyzed for outliers. An analysis of the distribution of overall ratings for each subject was conducted to identify subjects whose overall ratings were considerably higher or lower than the mean rating of all the subjects combined. First, the distribution of ratings for each subject was tested for normality using the Shapiro-Wilk test statistic, W. Some distributions were found to be normal while others were not, so a nonparametric test was used in the comparison of means. Figure 13 displays box plots for the distributions of each subject�s overall ratings and the blue line connects all the mean overall ratings. On the evaluation sheet a scale of 1 to 7 was used and the mean overall response of all subjects was 4.25.

Figure 13: Box Plot Graph Showing a Comparison of Subject�s Overall Ratings
A comparison of variances was conducted using Levene�s test for nonparametric data. With a p-value of less than .0001, this test indicated that the variance of at least one subject�s ratings was significantly different. A statistical comparison of means was not conducted with the data being nonparametric and having unequal variances. However, differences in variances and means can be observed from visually comparing the distributions. Subject number 24 appears to be the strongest outlier with a high mean rating of 6.35 and the smallest standard deviation around 0.5. Small variances indicate that the subject could not tell a significant difference between the samples.
The subjects with unusually low or high mean overall ratings as well as subjects with lower ranges were further analyzed to see if they were able to perceive a difference in sample treatments. The p-value of the Levene test indicates no significant difference between variances so the Kruskal-Wallis test for nonparametric data with equal variances was used to compare means. This test indicated that subject 24 could not distinguish a significant difference between each sample. Subject 24 is the only subject that was unable to distinguish any difference in all 5 samples.
All other subjects that were tested were able to at least rate one sample different from the rest. To develop the model average ratings of all the subjects will be used. The ratings of subject 24 were removed from the average calculation to test if it made a significant difference. The subject�s abnormal ratings did not have a significant impact on the average so the ratings from all 29 subjects were included in all further analysis.
Next, a comparison of the mean ratings for each activity was conducted to test whether activity type had an effect on each subject�s perceptions of overall comfort, seen Figure 14. The Shapiro-Wilk W test statistic was used to test for normality of sample ratings. The p-values for all distributions were less than 0.0001, which r
ejects the null hypothesis that the distributions are normal. The Levene test was used to test for equal variances and a p-value of 0.38 fails to reject the null hypothesis that the variances are equal. The Kruskal-Wallis test for was used to compare means and a p-value of 0.0007 was calculated. This rejects the null hypothesis that means are equal. The means of the sample ratings from the bowling and toe touches to arm raises activities were significantly lower than the mean sample ratings of the donning and cross body arm movement activities.

Figure 14: Means Comparison of Overall Rating by Activity
With a significant difference being observed between sample ratings in each activity a regression model should include the activity as a categorical factor. The data were averaged by activity and sample so that the response variable was the average overall response for each treatment during a specific activity. The average rating for each descriptor was also calculated for each level of response. A table of the average ratings can be seen in Table 9 in Appendix C. Averaging values allows for a good prediction of the average response of the sample group but also loses the information from individual responses. In an attempt to predict some variation among individual ratings the final evaluation form asked questions about fit, style, and frequency of wear for this style of garment. However, these ratings had little to no correlation with each subject�s overall ratings so they were not used in the construction of the regression model.
The final evaluation also provided a ranking of preference of the treatments. The average of the final evaluation preference rankings were in agreement with the average overall rating results during wear. As a group the subject�s order of most to least preferred was GS, GW5, GC, GSTL, and GSTH. Subjects were also asked to rate the importance of the descriptors to compare what the model best correlates with and what the subjects actually perceive. Table 7 shows the average importance rating where a rating of 1 is the most important and 5 is less important. These ratings correspond well with the regression model where scratchy and rough were found to be the most important followed by stiff and flexible.

Table 7: Subject Rating of Descriptor Importance
Stepwise regression analysis was conducted to identify the descriptor ratings that create the best model. The ratings from the descriptors thermal and snug were not included in the stepwise analysis due to their lack of correlation with the overall rating as seen in the multivariate analysis in Figure 24 of Appendix C. All other descriptor terms were highly correlated with the overall rating so they were used in the stepwise regression analysis. The stepwise analysis tool in the JMP program allows for factors to be added and removed from the model in order to find the best model. Factors were entered in to the model if they were significant with a low p-value and if they reduced the Sum of Squared Errors (SSE). The model was also judged on whether the addition of a factor increased the R2 and the adjusted R2. The most significant factor in the model and the first to be added was the descriptor scratchy. The next most significant factor was the activity type followed by the descriptor stiff. The addition of other descriptors had an insignificant affect on the model.
Using the three factors of scratchy, stiff, and activity type, a least squares regression model was created. Figure 15 shows the actual overall comfort ratings compared to predicted overall comfort ratings. The model is able to predict approximately 97% of the variation with a RMSE of 0.1992. The residual by predicted plot shows no signs of unusual patterns with all points being independently and normally distributed about 0.

Figure 15: Actual by Predicted Overall Ratings

Figure 16: Residual by Predicted Plot for Descriptor Model
Table 8 lists the parameter estimates and their standard errors. Using these estimates, the following equation can be formed to predict the overall comfort ratings from significant descriptor ratings and the specified activity.
Predicted Overall Comfort Rating = 0.074 + 0.717 * Scratchy + 0.502 * Stiff +
If(Activity = “Bowling” » -0.166,
“Cross Arm” » +0.170,
“Donning” » +0.307,
“TT / AR” » -0.310)

Table 8: Parameter Estimates
This model shows that as the scratchy and stiff rating increases the mean overall comfort rating increases. Recall that a rating of 1 was given to strong sensations of the descriptor and a 5 no sensation of the descriptor. This means that a lower rating is more scratchy or stiff than a higher rating. During the �Crossing Arms� and �Donning� activity the mean overall comfort rating increases but during the �Toe Touches to Arm Raises� and �Bowling� activity the mean overall comfort rating decreases.
The mean rating for scratchiness and stiffness of the five treatments and the corresponding KES values can be seen in Appendix C. Using this data set a stepwise analysis was conducted to find the combination of KES factors that best predicts the descriptor rating. With only five response levels there is only four degrees of freedom. This means that only four KES measurements can be used in the prediction model. Also, there is no way of systematically varying the fabric properties so many of the factors correlate strongly with each other. Strong correlation between factors could mean that the factors are dependent on each other. For example, as shear stiffness increases the bending rigidity also increases by approximately the same amount. This mean the factors are confounded with one another and it cannot be determined from the data which factor explains variation in the response. There is no known way to systematically change KES properties; hence, the only solution to reducing confounding affects is to increase sample size and test whether the confounding effects are reduced or eliminated. With fewer KES measurements and confounding of KES properties the model potentially becomes less applicable for other data sets. The model developed from this set of treatments should be tested against additional unrelated fabric property assessment data to determine its scope and limitations.
Before building the rest of the model, KES measurements require standardization, since the individual measurement systems have different units of measure. Standardizing the measurements creates a common unit of measure of number of standard deviations from the mean measurement of that property. Stepwise regression was used again to add and remove properties and compare model possibilities. Certain properties should correspond to certain descriptors. The KES properties of surface were used for creating a model to predict the descriptor scratchy, while shear, bending and tensile properties were tested for the
model to predict the descriptor stiff. For these models, only main effects were correlated with the response. A least squares regression model was created using the fabric properties: coefficient of friction, mean deviation of MIU, and geometric roughness. For these models only main effects were correlated with the response. The model has an R2 of 0.99 and a RMSE of 0.1182.

Figure 17: Actual by Predicted Ratings for the Descriptor Scratchy
The model for predicting the rating of scratchy uses the standardized objective measurements. Geometric roughness is the only property that correlates well with the scratchy rating, with the exclusion of the data point from the GSTH treatment. However, the use of all 3 surface properties is a good predictor of this data set.
Predicted Scratchy Rating = 3.67 + 1.88 * Std(Coefficient of Friction) +
-2.41 * Std(Mean Deviation of MIU) +
0.927 * Std(Geometric Roughness)
For the stiff descriptor, properties of bending, shear and tensile were used in a stepwise regression analysis. Shear stiffness was the only property used in the model because it had the highest correlation with stiff ratings. The addition of any other properties did not have a significant effect on the model. The plot of actual versus predicted ratings shows the model having an R2 value of 0.93 and a RMSE error of 0.273.

Figure 18: Actual by Predicted for the Stiff Rating
The following prediction equation is for the stiffness rating. Increased shear stiffness decreases the stiffness rating, which means that there is a higher sensation of stiffness.
Predicted Stiff Rating = 3.083 + -0.859 * Std(Shear Stiffness)
The descriptor prediction equations were used to translate objective measurements to some quantifiable descriptor rating, which was then translated to a perception of overall comfort. The predicted values of overall comfort were plotted by the actual values recorded from testing. The combination of the models is able to predict 94% of the variance with a RMSE of 0.26.

Figure 19: Actual by Predicted of Overall Comfort Ratings using Fabric Properties
In order to predict the effect of the activity type on the subject�s comfort ratings using objective measurements, there has to be some analysis of properties that change with different movements or activities. After the completion of each activity, the subjects were asked to indicate locations on their body where they felt the most tactile stimulation during the particular test. They did this by marking a region of a body on a simple diagram. Subject responses were combined by treatment type and activity type to analyze what locations were the most commonly circled during certain activities. To achieve this, a diagram showing commonly circled areas was created for each activity and treatment type. Subject responses were tallied in each area and the percentage of the total areas circled, on both the front and back of the body, was calculated for each area to show the most concentrated areas of tactile sensation. These percentages are presented on a grey scale for each location with the darker areas being the most concentrated. Figure 20 shows an example of the markings made by subjects during the wear trials.

Figure 20: Concentration Diagram of Markings made by Subjects
All 20 sketches with the concentrations of circled locations are provided in Appendix D.
In this analysis subjects circled areas of all shapes and sizes so the analysis sheet was created by noticing a common separation of areas by all of the subjects. For example, subjects commonly separated the front of the arm into 4 areas including the bicep, the crease of the elbow, the forearm, and the wrist. These same general areas were commonly separated on the back of the arm as well. In instances where subjects made large circles that covered multiple areas on the analysis sheet, a tally mark would be placed in all areas that were covered by that circle. The grey scale used was split into 10 shades incremented by 1 percent with 0 to 1 percent being the lightest shade and 9 to 10 percent being the darkest shade.
In the donning activity the areas of sensation were approximately evenly distributed, with the highest areas of concentration in the shoulders, both front and back, and at the wrist in the front. The starched garments had higher concentrations in these areas than the other treatments. In the cross body arm movements activity the areas of sensation were more concentrated than the donning activity. The highest area of concentration was in the upper back followed by the backs of the shoulders. Some other areas indicated were the bicep area and the front of the shoulders. The areas of concentration during this activity were fairly consistent throughout all treatments. The toe touches to arm raises activity had a little less inconsistent results from what was seen in the cross body arm movement activity. The highest area of concentration was in the upper back but other than that area it was unclear what the next most concentrated area was. It appears that the shoulders, the under arms, and the wrists have fairly high concentrations of selection. The increased number of areas having higher concentrations may be due to the large range of motion involved with the activity. The bowling activity had high concentrations in all areas of the arm with which the subject bowled. Most subjects were right handed so the highest areas of concentration are in the front and back of the right arm. The front of the arm appears to have more sensation than the back of the arm, including the bicep, the underarm, the elbow crease, the forearm, and the wrists. However, the highest area of concentration is in the back of the shoulder.
The number of areas identified as having a sensation was smallest in the bowling activity, where the areas were confined to the arm being used for bowling. However, the cross body arm movement activity had the fewest areas of concentration. In the other two activities it was more difficult to identify small areas of concentrated sensations. The treatment type appears to have little to no affect on the location areas, the number of areas circled, or the number of concentrated areas.
With regard to the next stage of the research, the locations identified on the body can be used for placement of sensors that may provide insight into why the activity type had an affect on the overall comfort. If a relationship can be found between measurable dynamic properties and the comfort ratings for each activity then a complete model that correlates objective measurements to a subjective comfort response can be created.
4. Summary and Conclusions
This research has demonstrated a protocol for obtaining subjective ratings that differentiates selected laundry treatments in blouses evaluated in a dynamic wear test. Different body movements are shown to have a signif
icant effect on the overall comfort rating and for the different laundry treatments used in this study. Areas of tactile sensation were different for each activity in the protocol. Wash treatment, however, had no effect on the locations on the blouse associated with tactile discomfort. Statistically based models were derived from the wear study data that correlate measurements of fabric coefficient of friction, mean deviation of MIU, the geometric roughness and the shear stiffness to the subjective descriptors, scratchy and stiff. These primary subjective descriptors, in turn, are shown to be correlated with overall comfort ratings. For this set of woven cotton blouse materials, wear comfort response associated with laundering, softeners and starch is nominally predicted by the KES measured shear stiffness. The model indicates that activity has a significant effect on perceived comfort in dynamic wear.
The statistical methods used can be applied in future to develop translation models for other applications. Additional studies that use a larger sample group of test garments or treatments will reduce the confounding effect of interacting materials variables present in a relatively small test sample set. Multiple activities could also be used to investigate how changes in dynamic forces may affect the subjects� ratings.
Identifying locations of tactile sensations during specific movements provides information that will be used for placement of sensors and possible motions of a robotic device. In the next phase of this research, a second wear study is recommended that uses selected sensors between the fabric and the skin to measure properties that may predict the variation in the comfort rating due to the different activities. All activities should be performed while measuring dynamic and force properties to explain observed differences in the level of comfort during different body movements.
Recent progress in sensor technology can be used to develop a tactile comfort measuring device. There are a number of tactile and force sensors that are able to determine contact points, motion between two surfaces, and forces between two surfaces. Some sensors can be integrated into the garment being worn and other research is focused toward creating a material skin stimulant. There has been development of sensors that can feel almost as much detail as human fingers using camera technology and electroluminescence from nanoparticles (Maheshwari, V., & Saraf, R. E., 2006). A detailed study of dynamic devices and sensors that could be used in measuring tactile sensations is underway.
5. Future Work
Devices such as the KES-F and SiroFAST systems use a group of stand-alone instruments to measure fabric properties. The ring and slot-pull through methods are measuring techniques later developed to be simpler and less time consuming by measuring several properties in one motion. Since then a more recent device called the Fabric Touch Tester, shown in figure 21, was developed at the Hong Kong Polytechnic University. This device is a single assembly of multiple components that automatically measures multiple fabric tactile properties of a fabric sample during non-sweating conditions (Hu, Hes, Li, Yeung, & Yao, 2006). The system simultaneously measures temperature, pressure, friction, bending, compression and shear of a fabric sample. This device was reported to correlate well with subjective responses to fabric rubbing on the forearm but was not tested against full garment wear test data (Hu et al., 2006).
")
Figure 21: Schematic diagram of Fabric Touch Tester (FTT)
Although this system appears to improve upon the efficiency of measuring fabric properties it still lacks information important to subjective comfort ratings such as dynamic properties from movements and the fit of the garment.
Investigation of the effect of dynamic properties such as pressure and their impact of comfort perceptions has been minimal. The study by Kwok on pressure comfort at different locations on denim jeans was a start toward understanding the effect of fabric properties on general garment comfort. The study used pressure sensors placed between the skin and the fabric at different locations to record pressure readings under different postures (Kwok, Wong, Li, & Zhang, 2006). The effects of pressure during dynamic movements will also affect the force of friction and therefore should be measured continuously during movements in the garment. The types of sensors used are not specified in the denim study. However, many types of thin pressure sensors can be used between the skin and a garment.
Pressure Profiling Systems (PPS) is one company that offers many pressure sensor options. They employ discrete sensors as well as distributed sensors that measure the pressure distribution of a large area. In one product, Comfortable TactArray, the sensor is a flexible material that can be molded to most surfaces. Stretchable TactArray, seen in figure 22, is a similar product that can stretch up to 10% without compromising the pressure readings, according to the manufacturer (Pressure Profile Systems, 2007).
; Diaper Application(Right)")
Figure 22: Stretchable TactArray sensor by PPS(Left); Diaper Application(Right)
PPS also offers software that maps the pressure distribution over time and records the real time changes in pressure as an animated file so that is can be replayed for review and analysis, as shown in figure 23 (Pressure Profile Systems, 2007). The Stretchable TactArray could be used for assessing garment pressure regions of the human body and record real time pressure changes between the skin and the garment as movements are performed.

Figure 23: TactArray Chameleon TVR Software
Another product, Tactilus® Free Form sensing system offered by Sensor Products Inc.(SPI), uses thin flexible sensors, shown in figure 24, that allow the user to measure pressure between two surfaces simultaneously over a small sensing area. The sensors have a small sensing area but the system can measure up to 32 locations at once (Sensor Products Inc., 2008). Hence, the sensors are good for measuring pressure in specific locations.

Figure 24: Tactilus® Free Form Pressure Sensors
SPI also offers a large pressure sensor array that is flexible and can be applied to many kinds of surfaces, such as the seal of a car door as seen in Figure 25. Using this sensor array and the associated software, pressure mapping can be recorded over time with capability of recording 1,000 readings per second (Sensor Products Inc., 2008).

Figure 25: Tactilus® Pressure Sensor being used to measure the seal of a car door
Measuring other dynamic properties such as surface velocity, friction or shear between the skin and the garment likely will be a significant challenge. Measuring veloc
ities and between the skin and garment may require the use of sensors such as accelerometers. There are many types of accelerometers and the sensor will need to be small enough to not significantly compromise the fit of the garment. A shear sensor may prove to be useful in measuring dynamic properties of the garment in wear. SPI manufactures a Tactilus® shear sensor, shown in figure 26, that measures the vector of shearing action in real-time. The sensor is thin and is marketed as being used on the body between the skin and a surface of interest (Sensor Products Inc., 2008). The shear action could be useful in understanding the movement between the fabric and the skin which may affect sensations of friction.

Figure 26: Tactilus® Shear Sensor
Thin sensors that do not disrupt the fit of the garment are critical to effective subject wear testing. During testing, sensors must be securely fastened to the skin, garment, or both and wired to a computer without restricting the subject�s movements. In addition, the subject ideally must not have an awareness of the presence of the measuring device. The subject does not need to feel the garment but they must be able to move naturally. The garment must also be able to move as it would if the sensors were not in place. Dynamic properties that prove to have a significant effect on comfort should be included in the dynamic measuring device to be constructed in the next phase of this research.
The results of the wear test measuring dynamic properties will determine the construction of the measuring device. Ideally, the device should be able to measure all significant factors important to clothing comfort as determined by this, and other, studies. A possible device may simulate part of the body that recreates the motions of the in wear activities, such as the motion of a single arm. This would allow a single sleeve to be put on the arm and both physical and dynamic measurements taken to simulate comfort response. A potentially more robust device would be a full body mannequin that is capable of reproducing different movements while measuring properties important to comfort. This would allow for the full garment to be assessed including the fit or design of the garment and its affect on dynamic and tactile properties. Further advancements to the device may include the ability to adjust the size or figure of the mannequin to enable modeling of different body types on the same garment. With the current capability to scan a subject�s body and obtain their exact dimensions, it may prove useful to be able to adjust the mannequin�s dimensions to measure the comfort specific to an individual. This could be done using strategically located air pockets beneath the surface of the simulated skin of the mannequin. The air pockets could be expanded and contracted to mimic the body dimensions of different individuals. Such an advanced device, if validated, could be used to complete wear studies without the use of human subjects. The validation would include assessment of prediction capability based on the experimental data developed in the research reported in this thesis.
REFERENCES
- Ali, S. I., & Begum, S. (1994). Fabric softeners and softness perception. Ergonomics, 37(5), 801-806.
- Barker, R.L., “From Fabric Hand to Thermal Comfort: The Evolving Role of Objective Measurement in Explaining Human Comfort Response to Textiles,” International Journal of Clothing Science and Technology, Mt. Fuji Special Issue, Volume 4, pp 181-200, 2002.
- Barker, R.L., & Scheininger, M. M. (1982). Predicting the hand of nonwoven fabrics from simple laboratory measurements. 52(10), 615-620.
- Behery, H. M. (2005). Effect of mechanical and physical properties on fabric hand. Cambridge; Boca Raton, Fla.: Woodhead Publishing Limited; CRC Press.
- Boardman, C., Singleton, S., Jones, A., Li, Y., & Lei, Y.. Effect of fabric hydrophobic and hydrophilic treatments on human physiological and sensory responses.
- Boos, A. D. (2005). Concepts and understanding of fabric hand. In H. M. Behery (Ed.), Effect of mechanical and physical properties on fabric hand (pp. 11). Abington Cambridge, England: Woodhead Publishing Limited.
- Cardello, A. V. (2003). Predicting the handle and comfort of military clothing fabrics from sensory and instrumental data: Development and application of new psychophysical methods. Textile Research Journal, 73(3), 221.
- Chen, P., Barker, R. L., Smith, G. W., & Scruggs, B. (1992). Handle of weft knit fabrics. Textile Research Journal, 62(4), 200-211.
- El Mogahzy, Y. E., Kilinc, F. S., & Hassan, M. (2005). Developments in measurement and evaluation of fabric hand. In H. M. Behery (Ed.), Effect of mechanical and physical properties on fabric hand (pp. 45). Abington Cambridge, England: Woodhead Publishing Limited.
- Ellis, B. C., & Garnsworthy, R. K. (1980). A review of techniques for the assessment of hand. Textile Research Journal, 50(4), 231-238.
- Hollies, N. R. S., Custer, A. G., Morin, C. J., & Howard, M. E. (1979). A human perception analysis approach to clothing comfort. Textile Research Journal, 49(10), 557-564.
- Howorth, W. S. (1964). Handle of suiting, lingerie, and dress fabrics. Journal of the Textile Institute, 55(4), T251.
- Howorth, W. S., & Oliver, P. H. (1958). The application of multiple factor analysis to the assessment of fabric handle. Journal of the Textile Institute, 49(11), T540.
- Hu, J. Y., Hes, L., Li, Y., Yeung, K. W., & Yao, B. G. (2006). Fabric touch tester: Integrated evaluation of thermal-mechanical sensory properties of polymeric materials. Polymer Testing, 25(8), 1081-1090.
- Kawabata S. (1980). The standardization and analysis of hand evaluation. Osaka, Japan: The Textile Machinery Society of Japan.
- Kawabata S, & Niwa M. (2001). Recent progress in the objective measurement of fabric hand. Textile Science ’91: Volume 1., , 12-19.
- Kawabata, S., Postle, R., Niwa, M., & Nihon Seni Kikai Gakkai. (1982). Objective specification of fabric quality, mechanical properties and performance. Osaka: Textile Machinery Society of Japan.
- Kawabata, S., Postle, R., Niwa, M., & Nihon Seni Kikai Gakkai. (1983). Objective evaluation of apparel fabrics. Osaka: Textile Machinery Society of Japan.
- Kwok, Yi L., Wong, Anthoney S.W., Li, Yi and Zhang. Xin. “Sensory Comfort of Denim Product,” Clothing Biosensory Engineering, Published by Woodhead Publishing Limited in association with The Textile Institute, 2006, p.335-349
- Li, Y., & Wong, A. S. W. (2006). Clothing biosensory engineering. Cambridge; Boca Raton, FL: Woodhead Publishing; CRC Press.
- Ma, H. (2000). Comparison of the fabric mechanical properties measured by the KES-F and FAST systems. Dong Hua Da Xue Xue Bao ( Ying Wen Ban ), 17(2), 81.
- Maheshwari, V., & Saraf, R. E. (2006). High-resolution thin-film device to sense texture by touch. Science, 312(5779), 1501-4.
- Matsuo T. (1972). Study on (fabric) hand. Journal of the Textile Machinery Society of Japan, 25: No.11, P742-749-(8, pages).
- Militky, J. (2005). Application of statistical methods in evaluation or fabric hand. In H. M. Behery (Ed.), Effect of mechanical and physical properties on fabric hand (pp. 66). Abington Cambridge, England: Woodhead Publishing Limited.
- Peirce, F. T. (1930). The “handle” of cloth as a measurable quantity. Journal of the Textile Institute, 21(9), 377.
- Pressure Profile Systems. (2007). Pressure profile systems. https://www.pressureprofile.com/
- Raheel, . (1991). An empirical-model for fabric hand. 1.Objective assessment of light weight fabrics. Textile Research Journal, 61(1), 31.
- Sensor
Products Inc. (2008). Sensor Products Inc.https://www.sensorprod.com/index.php - Stylios, G. (1991). Textile objective measurement and automation in garment manufacture. New York: E. Horwood.
- Winakor, G., Kim, C. J., & Wolins, L. (1980). Fabric hand: Tactile sensory assessment. Textile Research Journal, 50(10), 601-610.
- Wong, A. S. W., Li, Y., & Yeung, P. K. W. (2004). Predicting clothing sensory comfort with artificial intelligence hybrid models. Textile Research Journal, 74(1), 13-19.
- Yick, K. (1996). Comparison of mechanical properties of shirting materials measured on the KES-F and FAST instruments. Textile Research Journal, 66(10), 622.
Appendix A

Table 9: Paired Comparison Data

Table 10: Hand Panel Descriptor Ratings
Appendix B

Figure 27: Wear Test Evaluation Form for Activities

Figure 28: Wear Test Evaluation Form for Activities

Figure 29: Evaluation Form after 5 Sessions
Appendix C

Table 11: Mean Descriptor Ratings

Figure 30: Multivariate Analysis of Descriptor Ratings

Table 12: Descriptor and KES Data
Appendix D

Sample: GW5 � Garment washed and dried 5 times
Activity: Donning
Total = Sum of the number of circled locations indicated by all subjects = 239

Sample: GW5 � Garment washed and dried 5 times
Activity: Cross Body Arm Movements
Total = Sum of the number of circled locations indicated by all subjects = 194

Sample: GW5 � Garment washed and dried 5 times
Activity: Toe Touches and Arm Raises
Total = Sum of the number of circled locations indicated by all subjects = 236

Sample: GW5 � Garment washed and dried 5 times
Activity: Bowling
Total = Sum of the number of circled locations indicated by all subjects = 164

Sample: GS1 � Garment Softened 1 time
Activity: Donning
Total = Sum of the number of circled locations indicated by all subjects = 257

Sample: GS1 � Garment Softened 1 time
Activity: Cross Body Arm Movements
Total = Sum of the number of circled locations indicated by all subjects = 198

Sample: GS1 � Garment Softened 1 time
Activity: Toe Touches and Arm Raises
Total = Sum of the number of circled locations indicated by all subjects = 262

Sample: GS1 � Garment Softened 1 time
Activity: Bowling
Total = Sum of the number of circled locations indicated by all subjects = 152

Sample: GSTL � Garment Starched Light 1 time
Activity: Donning
Total = Sum of the number of circled locations indicated by all subjects = 271

Sample: GSTL � Garment Starched Light 1 time
Activity: Cross Body Arm Movements
Total = Sum of the number of circled locations indicated by all subjects = 209

Sample: GSTL � Garment Starched Light 1 time
Activity: Toe Touches and Arm Raises
Total = Sum of the number of circled locations indicated by all subjects = 252

Sample: GSTL � Garment Starched Light 1 time
Activity: Bowling
Total = Sum of the number of circled locations indicated by all subjects = 169

Sample: GSTH � Garment Starched Heavy
1 time
Activity: Donning
Total = Sum of the number of circled locations indicated by all subjects = 266

Sample: GSTH � Garment Starched Heavy 1 time
Activity: Cross Body Arm Movements
Total = Sum of the number of circled locations indicated by all subjects = 244

Sample: GSTH � Garment Starched Heavy 1 time
Activity: Toe Touches and Arm Raises
Total = Sum of the number of circled locations indicated by all subjects = 236

Sample: GSTH � Garment Starched Heavy 1 time
Activity: Bowling
Total = Sum of the number of circled locations indicated by all subjects = 173

Sample: GC � No Treatment
Activity: Donning
Total = Sum of the number of circled locations indicated by all subjects = 249

Sample: GC � No Treatment
Activity: Cross Body Arm Movements
Total = Sum of the number of circled locations indicated by all subjects = 185

Sample: GC � No Treatment
Activity: Toe Touches and Arm Raises
Total = Sum of the number of circled locations indicated by all subjects = 205

Sample: GC � No Treatment
Activity: Bowling
Total = Sum of the number of circled locations indicated by all subjects = 126