Article
Related Links
Peter Teertstra*
Microelectronics Heat Transfer Laboratory
Department of Mechanical Engineering
University of Waterloo
Waterloo, Ontario, Canada
* Assistant Professor, Member ASME
ABSTRACT
Thermal adhesives that contain large concentrations of high thermal conductivity filler materials, such as ceramics or metals, are widely used by the electronics industries in a variety of applications. The thermal properties of these materials, such as the thermal contact resistance across a bonded joint and the thermal conductivity of the bulk material, are critical to the selection of the “best” material. A method is presented for the measurement of these thermal properties using a steady-state, guarded heat flux meter test apparatus based on the welldocumented and familiar ASTM test standard D-5470. Five different adhesive materials are tested and a linear fit of the resulting resistance versus thickness data are used to determine the bulk thermal conductivity and contact resistance values. Four of the five materials tested had conductivity values of less than 1 W/mK, and the data demonstrates that a small but significant thermal contact resistance exists between the adhesive and the substrate for each of the adhesives.
NOMENCLATURE
| A | area | m2 |
| BLT | bondline thickness | mm |
| k | thermal conductivity | W/mK |
| Q | heat transfer rate | W |
| R | thermal resistance | °C/W |
| T | temperature | °C |
| x | distance | m |
| Greek Symbols | ||
| ΔT | temperature difference | °C |
| Subscripts | ||
| a | adhesive | |
| b | bulk | |
| c | contact | |
| j | joint | |
INTRODUCTION
Adhesive materials are widely used in the manufacture of electronic components and systems for a variety of applications, including the attachment of heat sinks or spreaders, die attach, underfill and encapsulation. These adhesives typically include large concentrations of filler materials intended to enhance the relatively poor thermal conductivity of the base material. Currently available thermal adhesives utilize a variety of filler materials, such as metallic silver or aluminum, ceramics, oxides, or carbon black, in various binders comprised of epoxy (two-part or heat activated), RTV silicone, acrylics, etc. Given the many possible combinations of the various ingredients, it is not surprising that a significant number of thermally-enhanced adhesive materials are currently available to the electronics packaging industry.
The goal for the users of thermal adhesives is the minimization of the thermal resistance to heat conduction across a joint formed when two surfaces are bonded. This is achieved through reductions in both the thermal resistance associated with conduction through the bulk adhesive material and the thermal contact resistance between the bonding surfaces and the adhesive layer. The selection of the “best” adhesive for a particular application often involves many different considerations, not the least of which is the eventual thermal performance of the resulting joint. Although the manufacturers and vendors of thermal adhesives usually provide values for bulk thermal conductivity, often little detail is provided in regards to the test method or the impact of thermal contact resistance on the overall joint resistance. As a result, it may be advantageous to perform measurements of the thermal properties to validate the vendors data and provide additional insight into the behavior of these adhesive-bonded systems.
Thermal joint resistance and thermal conductivity measurements for thermally-enhanced adhesive materials are presented by a number of different researchers in the open literature. Bolger [1] performed steady state thermal joint resistance measurements for single and multiple layers of epoxy tape adhesives with diamond, silver, aluminum and alumina fillers at high pressures between polished aluminum surfaces. Using these data, Bolger [1] calculated the effective value of thermal conductivity k for each of the adhesives and developed a correlation to predict the volume fraction of the filler required for a particular k value.
Mirmira, Marotta and Fletcher [2] performed thermal contact resistance measurements using a steady-state test for a variety of adhesive materials, including epoxies, cements and silicone. One thickness was considered in each case and results are presented in terms of the overall joint resistance only.
Kilik et al. [3] presents thermal conductivity data for a variety of copper and aluminum filled epoxy adhesives from measurements performed using a transient test method based on lumped capacitance analysis. This procedure provides much faster results than a steady-state test but does not give any data for thermal resistance across the adhesive / surface contact.
Campbell, Smith and Dietz [4], Hasselman et al. [5] and Browne [6] all present results for thermal properties of filled adhesive materials based on measurements performed using a laser-flash method. This method is well described by the ASTM Standard E-1461-01 “Standard Test Method for Thermal Diffusivity by the Flash Method” [7], which contains a description of the use of the laser flash method to measure thermal diffusivity of homogeneous, isotropic, solid materials. The standard recommends caution be exercised when deriving thermal conductivity from thermal diffusivity measurements. In particular, erroneous results can occur when the laser flash method / equipment are used to predict specific heat for mixtures where the components have significantly different thermal diffusivities. In the case of the researchers cited earlier, the standard test method was modified to include substrate materials to support the adhesive layer and facilitate measurement of thermal contact resistance, while bulk thermal conductivity was calculated from a laser-flash measurement of a cured pellet of the adhesive. The results of Hasselman et al. [5] suggest that the contact resistance between the adhesive and the bonde
d surfaces is at least as significant as the bulk conduction resistance. It should be noted that the cost of a laser flash test apparatus places it beyond reach of many researchers.

Thermal interface material test apparatus
In this study a method will be presented for determining the bulk thermal conductivity and thermal contact resistance at the bonded surfaces for adhesive materials using thermal joint resistance measurements. These tests will be performed with a modified guarded heat flux meter test apparatus, as per the ASTM Standard D-5470 [8]. This type of test equipment is often available in most thermal test laboratories and the method described in this study is easily adaptable to work with most of these systems.
APPARATUS AND METHODOLOGY
Thermal Interface Test Apparatus
All measurements were performed using a thermal interface material (TIM) test apparatus, with its design based on the guarded heat flux meter device recommended by the ASTM standard [8] with a number of modifications. The test column in the apparatus shown in Fig.1 is comprised of two calibrated electrolytic iron flux meters with a 25 x 25 mm cross sectional area. Temperatures are measured at 10 mm intervals along each of the flux meters using five 1 mm dia. x 25 mm ceramic RTDs and the test sample is placed between the lapped upper and lower surfaces. A heater block with four embedded cartridge heaters is positioned at the bottom of the test column while the temperature of the cold plate at the top of the column is regulated using a glycol-water solution from a constant temperature bath. The contact pressure at the interface between the flux meters is measured using a load cell and adjusted using a linear actuator. The test column and loading mechanism are contained with a vacuum chamber capable of pressures less than 10-4 atm. All measurements are performed using a Keithley 2700 data acquisition system controlled with Labview program running on desktop PC. A full description of the apparatus and details of its construction and operation are presented by Culham et al. [9].
The uniformity of the pressure distribution across the contacting surfaces of the heat flux meters was verified using Pressurex[10] Ultralow (25 – 85 psi) pressure indicating film.
The procedure used for measurement of the joint resistance between the flux meter surfaces contacting the sample is as follows. The sample is placed between the flux meters and small preliminary load is applied to align the test column. A vacuum is drawn in the test chamber in order to reduce heat losses due to convection, and the data acquisition software is started. Once the desired contact pressure and sample temperature are achieved and a steady state condition is reached, the temperatures of the RTDs are recorded. A sample of the RTD temperatures plotted vs. position in the flux meter is shown in Fig.2.
The total heat flow rate through each of the flux meters is calculated by
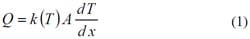
where k(T) is the thermal conductivity of the calibrated flux meter material, correlated with respect to average temperature, A = 6.25×10⁻⁴ m2 is the cross sectional area, and dT/dx is the temperature gradient, calculated using a linear least squares fit of the data. The total heat flow rate calculated for the lower and upper flux meters varied by less than 5% for all cases. The thermal joint resistance is determined using

where Q is the mean value from the upper and lower heat flux meters and ΔT is the temperature difference at the joint, calculated based on an extrapolation of the least squares fit of the data to the contacting surfaces of the flux meter, as shown in Fig.2.
The uncertainty in the joint resistance measurements of the current test apparatus is ± 2.0% , as reported by Savija[11] based on the accumulated uncertainties in the heat flow rate and joint temperature measurements.

Fig.2. Heat flux meter temperature distribution
Adhesive Test Sample Preparation
To avoid damage to the precision joint surfaces of the heat flux meters, the measurements were performed using test samples consisting of two aluminum substrates bonded together using a uniform thickness layer of adhesive. A set of forty 25 x 25 x 6.43 mm aluminum Al-2024 T-351 blocks were machined from bar stock and the faces were lapped to achieve a flat, smooth surface. An average surface roughness Ra = 0.3µm and an average out-of-flatness of 2µm over the 25 mm width of the sample were measured using a Mitutoyo SJ-400 surface profilometer. The co-planarity of the blocks was verified using a high precision micrometer (±1µm) to measure the thickness of the blocks at the center and the corners. The maximum variation between these thickness measurements was 10µm with an average difference of 6µm.
The test samples were assembled using a pair of blocks, as shown in Fig. 3. Steel shims were placed at the corners of the joint to set the thickness of the adhesive layer and kapton tape was used to assist in aligning the blocks and preventing the adhesive from running out of the joint. Once the surfaces were coated with adhesive and the blocks were put together, a small clamp was used to bring the surfaces of the blocks into contact with the shims and hold the sample until the adhesive had cured. The manufacturer’s recommendations regarding curing temperature and duration were followed in each case.

Fig.3 Test sample assembly
Four different test samples were prepared for each of the adhesives examined in the study, three using 0.008”, 0.013” and 0.017” shim stock and one with no shims. The bondline thickness (BLT) was calculated by subtracting the thickness of each of the blocks measured at the center using a micrometer (±1µm) from the total thickness of the test sample after the adhesive had cured. The micrometer was also used to measured the corner thicknesses of the completed samples to verify that a uniform bondline thickness had been achieved. The average variation in bondline thickness for all of the samples, determined by the maximum difference in the thicknesses measured at the corners divided by the center thickness, was 10%. As a result, an uncertainty of ±5% is assumed for all bondline thickness measurements.
The five different adhesives used in this study were selected to represent a cross-section of the various types of the currently available materials. The adhesives, identified as materials A, B, C, D and E, are described in Table 1 along with the bondline thickness measurements for all of the samples.
Table 1 Adhesive descriptions and bondline thicknesses
| Material | Description | BLT (mm) |
| A | High thermal conductivity RTV Silicone (1-part) | 0.010 0 .196 0.328 0.439 |
| B | Aluminum-filled 2-part epoxy putty | c0.089 0.204 0.336 0.419 |
| C | Aluminum-filled 2-part epoxy bonding resin | 0.106 0.214 0.382 0.451 |
| D | Silver-filled 2-part epoxy | 0.114 0.193 0.315 0.398 |
| E | Silver-filled thermoplastic | 0.123 0.249 0.365 0.450 |

Fig.4. Thermal resistance network for adhesive sample
Test Procedure
All thermal resistance measurements were performed at a mean joint temperature of 50 °C with a load of 150N applied to the test column. Vacuum conditions were maintained in the test chamber during the measurements to reduce convective heat loss from the flux meters.
The joint resistance measured for each of the test samples, Rj , can be modeled as a series combination of five resistances, as shown in Fig. 4.
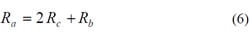
In order to determine the resistance across the adhesive joint, Ra , it is necessary to reduce the effects of thermal contact resistance between the aluminum block and the flux meter, Rc , and the conductive resistance through the blocks, Rb , using the following relationship
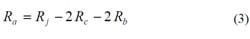
This approach assumes that the surface finishes at the lower and upper block / flux meter interfaces and the block thicknesses are similar. A low viscosity, carbon black filled thermal interface material was used between the sample and the flux meter in all cases because it provided good repeatability in the results.
The values for Rc and Rb were determined empirically using a series of preliminary tests. In the first test, the heat flux meters were brought into contact with only a thin layer of the carbon black interface material present at the interface. The joint resistance was measured for this case, which corresponds to a single value of contact resistance, Rc . In the next test, a single 6.43 mm aluminum block was placed between the flux meters with the carbon black TIM on both the upper an lower block surfaces. The overall joint resistance measurement in this case corresponds to the conduction resistance through a single block and contact resistance across two joints, as shown in Eq. (4). In the third test, two blocks were tested with the carbon black TIM present in all three joints, with the overall joint resistance corresponding to Eq. (5). These tests were each performed three times to demonstrate the repeatability of the results, and the data are presented in Table 2.
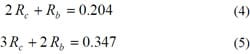
Table 2 Contact and conduction resistance test results
| Description | Test # | Rj ( °C/W) | Rj avg ( °C/W) |
| One contact | 1 | 0.075 | 0.060 |
| 2 | 0.050 | ||
| 3 | 0.053 | ||
| One block | 1 | 0.219 | 0.204 |
| 2 | 0.183 | ||
| 3 | 0.226 | ||
| 4 | 0.188 | ||
| Two blocks | 1 | 0.346 | 0.347 |
| 2 | 0.358 | ||
| 3 | 0.337 |
Values of Rc = 0.061 and Rb= 0.082 °C/W Rb were calculated using a simultaneous solution of Eqs. (4) and (5). It should be noted that the value for Rc is similar to the measured joint resistance for a single contact, as presented in Table 2.
Because Rc and Rb are calculated based the measured joint resistance using simple, linear mathematical relationships, it is assumed that the uncertainty in each of these quantities will be similar to that derived for the test apparatus by Savija[11], ± 2.0% .
RESULTS
The adhesive samples were tested using the same conditions as the preliminary measurements. In each case at least two measurements were performed for each sample, and for each of these tests the sample was removed, the contacting surfaces were cleaned with acetone, the carbon black thermal interface material was applied and the sample was repositioned in the test column. The adhesive resistance, Ra , is plotted versus bondline thickness for each of the five adhesive materials in Figs. 5 – 9, and the Ra data are given in Table 3.
The uncertainties in the measured joint resistance and the derived contact and bulk resistance values were combined using the method described by Moffat[12]
which gives an overall uncertainty on the adhesive resistance of ± 3.5% . This value, along with the uncertainty on the bondline thickness measurements, are presented as error bars in Figs. 5 – 9.

Fig. 5 Thermal joint resistance results for material A

Fig. 6 Thermal joint resistance results for material B

Fig. 7 Thermal joint resistance results for material C

Fig. 8 Thermal joint resistance results for material D

Fig. 9 Thermal joint resistance results for material E
Table 3 Adhesive layer resistance values0.193
| Material | BLT (mm) | Ra (W/mK) |
| A | 0.010 | 0.052 |
| 0.196 | 0.66 | |
| 0.328 | 1.02 | |
| 0.439 | 1.38 | |
| B | 0.089 | 0.22 |
| 0.204 | 0.59 | |
| 0.336 | 0.92 | |
| 0.419 | 1.05 | |
| C | 0.106 | 0.30 |
| 0.214 | 0.54 | |
| 0.382 | 0.82 | |
| 0.451 | 1.01 | |
| D | 0.114 | 0.29 |
| 0.44 | ||
| 0.315 | 0.75 | |
| 0.398 | 0.91 | |
| E | 0.123 | 0.058 |
| 0.249 | 0.085 | |
| 0.365 | 0.11 | |
| 0.450 | 0.12 |
The heat transfer through the adhesive joint is modeled as a series combination of thermal contact resistances at the substrate / adhesive interfaces, Rc , and conduction resistance through the bulk material, Rb
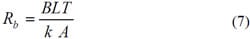
where Rb is calculated based on the familiar expression for one-dimensional heat conduction
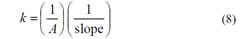
Bondline thickness, BLT, is expressed in meters. Substituting Eq.(7) into Eq.(6) gives a linear expression for the adhesive thermal resistance as a function of bondline thickness, which can be determined for a particular material using a linear, leastsquares fit of the data in Figs. 5 – 9. The thermal conductivity of the bulk material is calculated using the slope of the line
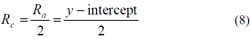
where A = 607 ×10-6 m2 is the cross sectional area of the adhesive, a value that has been corrected to account for the reduction in area due to the shims in the corners. The thermal contact resistance is determined using the y-intercept of the correlation, corresponding to the value of the joint resistance when the thickness of the adhesive layer goes to zero, i.e. Rb = 0 in Eq. (6)
Figs. 5 – 9, values for the thermal conductivity and thermal contact resistances are calculated, as presented for each of the adhesive materials in Table 4.
Table 4 Thermal conductivity and contact resistance results
| Material | k (W/mK) | Rc (°C/W) |
| A | 0.53 | 0.013 |
| B | 0.65 | 0.017 |
| C | 0.84 | 0.051 |
| D | 0.73 | 0.012 |
| E | 7.8 | 0.017 |
DISCUSSION
A method has been proposed and demonstrated for the measurement of the thermal conductivity and thermal contact resistance across joints bonded with thermally enhanced adhesive materials. The thermal joint resistance data measured using the steady-state test procedure is well fit by a linear function of the bondline thickness, which suggests that the thermal conductivity of the bulk material is a constant value that is not affected by the thickness of the adhesive layer.
Although the contact resistance between the adhesive layer and the substrate is significantly smaller than bulk conduction resistance for most cases, it is not negligible. The contact resistance is of similar magnitude for most of the adhesives examined in this work, suggesting that Rc may be as much a function of the surface finish, substrate material or contact pressure as the properties of the adhesive material itself. Material C had a significantly larger contact resistance component that the rest of the adhesives, perhaps due to its liquid hardener component that caused it to have a much lower viscosity than the other materials during mixing and application. This may have lead to settling of the filler material during the curing process, resulting in a non-homogeneous mixture near the bonded surfaces and a higher effective contact resistance value. Additional measurements will be required in order to quantify the relationship between surface finish and the contact resistance for adhesive materials.
Most of the materials examined in this study had similar bulk thermal conductivities, within the range 0.53 – 0.84 W/mK. Material E, the silver-filled thermoplastic, had a bulk thermal conductivity of approximately 10 times the value of all of the other materials. However, if one were to compare the results on the basis of the total adhesive resistance, the first data point for material A, Rc°C/W = 0.052 o (RTV silicone, no shim) is similar to the no-shim data for material E, Rc = 0.058 °C/W. When no shim was used to prepare the sample, the RTV had a significantly smaller bondline thickness value, 0.01 mm vs. 0.123 mm for the silver-filled thermoplastic. This result provides an excellent reminder that all of these adhesive materials should be applied in as thin a layer as possible, regardless of the bulk thermal conductivity value.
ACKNOWLEDGMENTS
The author acknowledges Prof. J. Richard Culham for his support of this research and the use of the test equipment in the Microelectronics Heat Transfer Laboratory. The contribution of Dr. Ahmed Zaghlol from R-Theta Thermal Solutions Inc. is also greatly appreciated.
REFERENCES
- Bolger, J. C., “Prediction and Measurement of Thermal Conductivity of Diamond Filled Adhesives,” Proceedings of the 42nd Electronic Components and Technology Conference, pp. 219 – 229, San Diego, CA, May 18 – 20, 1992.
- Mirmira, S. R., Marotta, E. E. And Fletcher, L. S., “Thermal Contact Conductance of Adhesives for Microelectronic Systems,” AIAA Journal of Thermophysics and Heat Transfer, Vol. 11, No. 2, pp. 141 – 145, 1997.
- Kilik, R., Davies, R. and Darwish, S. M. H., “Thermal Conductivity of Adhesive Filled with Metal Powders,” International Journal of Adhesion and Adhesives, Vol. 9, No. 4, pp. 219 – 223, 1989.
- Campbell, R. C., Smith, S. E. and Dietz, R. L., “Measurement of Adhesive Bondline Effective Thermal Conductivity using the Laser Flash Method,” Proceedings of the 15th IEEE Semiconductor Thermal Measurement and Management Symposium, pp. 83 – 97, San Diego, CA, Mar. 9 – 11, 1999.
- Hasselman, D. P. H., Donaldson, K. Y., Barlow, F. D., Elshabini, A. A., Schiroky, G. H., Yaskoff, J. P. and Dietz, R. L., “Interfacial Thermal Resistance and Temperature Dependence of Three Adhesives for Electronic Packaging,” IEEE Transactions on Components and Packaging Technologies, Vol. 23, No. 4, pp. 633 – 637, 2000.
- Browne, J., “Evaluation of an Advanced Thermal Transfer Adhesive for Thermal Management Applications,” Proceedings of the 16th IEEE Semiconductor Thermal Measurement and Management Symposium, pp. 83 – 97, San Jose, CA, Mar. 21 – 23, 2000.
- “Standard Test Method for Thermal Diffusivity by the Flash Method,” ASTM Standard E-1461-01, Copyright ASTM International, Conshohocken, PA, 2007.
- “Standard Test Method for Thermal Transmission Properties of Thermally Conductive Electrical Insulation Materials,” ASTM Standard D-5470-06, Copyright ASTM International, Conshohocken, PA, 2007.
- Culham, J.R., Teertstra, P., Savija, I. and Yovanovich, M.M., “Design, Assembly and Commissioning of a Test Apparatus for Characterizing Thermal Interface Materials,” Eighth Intersociety Conference on Thermal and Thermomechanical Phenomena in Electronic Systems, San Diego, CA May 29 – June 1, 2002.
- Sensor Products Inc., 300 Madison Ave., Madison, N.J., 07940.
- Savija, I., “Method for Determining Thermophysical Properties of Thermal Interface Materials,” M.A.Sc. Thesis, Department of Mechanical Engineering, University of Waterloo, Waterloo, Ontario, Canada, 2002.
- Moffat, R.J., “Describing the Uncertainties in Experimental Results,” Experimental Thermal and Fluid Science, Vol. 1, pp. 3 – 17, 1988.