Rita Patterson*
David Pogue**
Steven Viegas*
*The University of Texas Medical Branch, Orthopaedic Surgery, Galveston, TX 77555-0892
**Barrios Technology Inc., NASA-JSC DE43, Houston, TIX 77058
Abstract
The search for methods to demonstrate and accurately measure contact area and pressure witiin human joints has been and remains an active one. Presenssor is a measuring system developed by Fuji Photo Fihn Co., Ltd. and used in medical applications.
The color intensity fades with time and exposure to light. These changes have not been well documented despite the increasing use of Fuji film in biomedical research. These changes in color intensity provide a source of error in the calculated measurements. The known variability of the color density of film exposed to light and air can be measured and predicted. Methods to control and improve the accuracy and reliability of study data are suggested.
Film was exposed to three different amounts of pressure and placed into one of four subgroups: exposed to light and taped or not taped, and stored in the dark and taped or not taped. Fading of the color density was seen after only a few hours of exposure to light when the film was left untaped. When the film was taped, a slight darkening was seen. For the best accuracy and reliability, the film should be digitized or analyzed within eight hours of exposure to pressure.
Introduction
Medical researchers have searched for and utilized devices to measure contact area and contact pressure within joints in the human body for decades. Ideally, these devices should not impede or change the measurements which they are supposed to observe. Piezo film, strain gauges, stress paints, and Fuji film are several types of measuring devices, or transducers, that have been utilized to obtain a better understanding of the biomechanics of the human body.
During the course of performing biomechanical studies utilizing Fuji film, and in examining old pressure prints, fading and color changes in the Fuji pressure sensitive film were noticed. It was noticed that the color fades with time and exposure to light. Fading was reduced by placing transparent tape over the print after it was exposed to the pressure. However, the rate of fading has not been documented, and there was a concern that the prints obtained at the beginning of a testing period would fade before they could be digitized or compared to later prints. Because any changes that occur in the color of the prints will be a source of error in the calculated pressure measurement, it was decided that a study should be performed to quantify the known variability in the color density of Fuji film that is exposed to light and air.
Methods and Materials
Fuji superlow film was cut into strips of rectangular pieces approximately five centimeters by two centimeters. These strips were exposed to pressurized nitrogen for one minute through a chamber with a 1.5 cm diameter hole. Applied pressure was measured through another hole in the chamber with a Transmetrics Inc. (Solon, Ohio) pressure transducer. Through a series of valves, the test pressure inside the chamber was increased. Then, the pressure inside the valve was purged. While the pressure coming from the nitrogen tank was kept constant, the transducer was inserted into the chamber and the valve to the nitrogen tank was reopened to expose the transducer to the desired pressure. Each strip had one of three pressures applied. The three pressures used [51, 130, and 284 psi, (3.6, 9.2, and 19.9 kgf/cm²)] approximate the range of Fuji superlow film (5-25 kgf/cm² or 71-355 psi). Although a pressure of fifty-one psi is below the threshold of the super low film, there was a definite observation of color on the film in this pressure range and this lower application of force was investigated.
After the transducers were exposed to one of three pressures, the “A” film was carefully removed and the resulting “C” film (with the red or orange coloration) was placed into one of two main groups. The transducer was either covered with Lepage’s invisible tape (Pittsburgh, PA) or left exposed to air. Some pieces were placed in a folder and stored in a closed cabinet (in the dark), while others were placed on top of a cabinet (exposed to fluorescent light for nine hours, an average week day, and then left in the dark).
The pieces of film were placed into one of four subgroups: exposed to light and taped (L); exposed to light and not taped (LN); stored in the dark and taped (DT); and stored in the dark and not taped (DN). Each subgroup consisted of three pieces of film: one exposed to 51 psi, one exposed to 130 psi, and one exposed to 284 psi. With the use of a video camera, light stand, personal computer, and videodigitizing board, each piece of film was videodigitized and stored as a graphics image. Care was taken to maintain adequate and constant lighting and eliminate shadows on the image.
A Better Basic program was used to analyze the digitized images. The program calculated the average gray level in each of the pieces of film and stored the results for later statistical analysis11,12. In the first part of the experiment, the sets from each group were videodigitized immediately, after three hours, and one, two, three, four, five, six, seven and fourteen days after the film was exposed to the pressures.
There was an identifiable difference in gray levels of the film immediately after exposure compared to one day later. There was no difference in gray level between the film analyzed immediately and those analyzed after three hours. Therefore, in order to gain information after three and before twenty-four hours of exposure, a second experiment was conducted. Twenty pieces of film were exposed to 150 psi (10.6 kgf/cm²) for one minute and divided into the same four groups: exposed to light and taped (LT), exposed to light and not taped (LN), stored in dark and taped (DT), and stored in dark and not taped (DN). Additionally, a piece of tape over white paper was also included with the film to see if the tape alone darkened over time. The pieces of film and tape over white paper were digitized hourly for nine hours and then daily for the following seven days. Again, the digitized images were analyzed using a Better Basic program.
The data were analyzed using a General Linear Model (GLM) procedure (three way ANOVA) to check for differences among the parameters with gray level as the dependent variable and time as the independent variable. A p value < 0.01 was considered significant. The statistical analysis also included a linear approximation of the gray level for each of the four groups and yielded estimates for the slopes and y intercepts.
Results
During the first part of the experiment, preliminary statistical analysis was performed to determine
if there were any significant early changes in the film. The initial results showed significant changes (p < .01) in the film exposed to 130 psi when exposed to light (Figure 1). Film that was not taped, faded (the gray level increased) after twenty-four hours of exposure to light and the film covered with tape actually got darker with time (the gray level decreased). This darkening effect was strongest in the 130 psi exposed film. Figures 2 and 3 show light effects on the film exposed to 284 and 51 psi, and confirm the results seen in the film exposed to 130 psi.
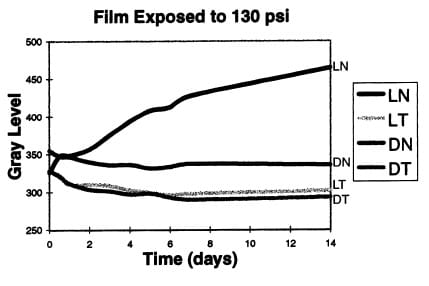
Figure 1. Gray level of Fuji film exposed to 130 psi over time
for four conditions: exposed to light and taped (LI), exposed to light and not
taped (LN), stored in dark and taped (DI), and stored in dark and not taped (DN).
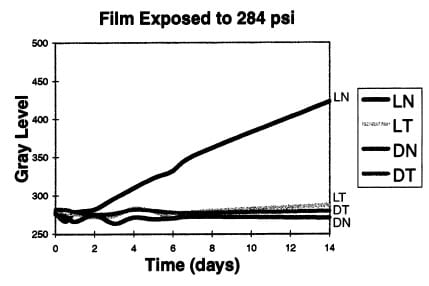
Figure 2. Gray level of Fuji film exposed to 284 psi over time
for four conditions: exposed to light and taped (LI), exposed to light and not
taped (LN), stored in dark and taped (DI), and stored in dark and not taped (DN).
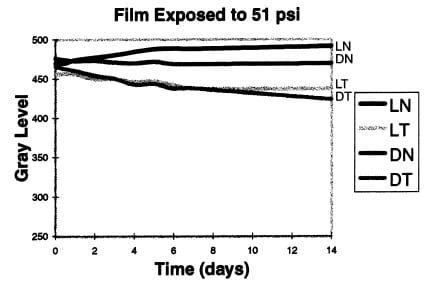
Figure 3. Gray level of Fuji film exposed to 51 psi over time for four
conditions: exposed to light and taped (Li), exposed to light and not taped (LN), stored
in dark and taped (DI), and stored in dark and not taped (DN).
Because the first part of the study showed effects of light on the film after one day, and the greatest change was on the film exposed to 130 psi, an additional study was undertaken to determine how long, in hours, the film could be exposed to light without fading. Figure 4 shows a graph of the average gray level of the pieces of film exposed to 150 psi during the first eight hours of exposure and then daily for seven more days.
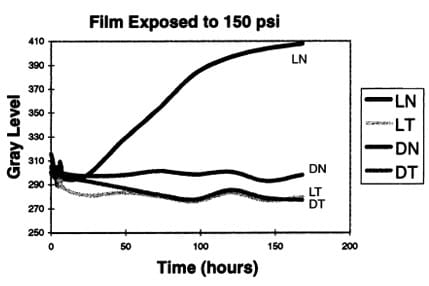
Figure 4. Gray level of Fuji film exposed to 150 psi over time for four
conditions: exposed to light and taped (LU), exposed to light and not taped (LN), stored
in dark and taped (DT), and stored in dark and not taped (DN).
A study of the effects of a white piece of paper placed into the same categories as the Fuji film is shown in Figure 5. Although the outlying points are significantly different from the starting point, the maximum change in gray level is less than one percent of the total gray level number range. Thus, independent of the light factor, all of the taped pieces of film in the low to medium pressure range showed a darkening trend after eight hours of exposure. There was no darkening trend in the tape alone on white paper, implying that the tape did not have a chemical effect on the Fuji film. Tests for the homogeneity of slopes in lines shown in Figures 1 through 3 indicated that the lines did not have similar slopes with the LN slope being more positive and the DN, DT, and LT slopes being more negative (Table 1).
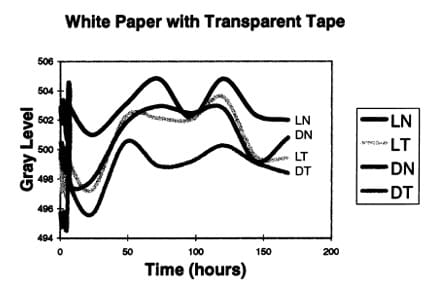
Figure 5. Gray level of white paper covered with transparent tape over time
for four conditions: exposed to light and taped (LT), exposed to light and not taped (LN),
stored in dark and taped (DT), and stored in dark and not taped (DN).
| Table 1 | |||||
| Condition | Slope (Gray level/Time) | ||||
| 51 psi | 130 psi | 284 psi | tape | 150 psi | |
| DN | -0.449 | -0.092 | -0.055 | +0.011 | -0.053 |
| DT | -3.033 | -2.256 | -0.069 | +0.023 | -0.165 |
| LN | +1.661 | +9.903 | +11.19 | +0.003 | +0.759 |
| LT | -1.570 | -1.726 | -0.624 | +0.017 | +0.122 |
Discussion
Piezo film, strain gauges, and stress paint or photoelastic material have been used to measure contact and pressure. These transducers, however, have limitations within the human body. Piezo film will only measure dynamic forces and cannot be used for static load applications. Strain gauges may alter the properties of the bone-gauge interface and will only display stress at one point on the surface studied1,7. Stress paints may also alter the properties of the bone-gauge interface and can be associated with expensive equipment.
Presenssor is a pressure measuring sheet system which has been developed by Fuji Photo Film Co., Ltd. It has been available since April, 1977 and was developed in response to industries’ need for pressure measurement. It is used in hydraulic presses, in the manufacturing of flanges, and most extensively in the gasket industry to detect leakage of oil24. It is also used in industry to measure forces between pressed surfaces5 in engines, gear teeth, roll contact areas in paper mills10 and printers, and various other static and dynamic applications. More recently, Prescale ha
s been used in medical applications6,8,9,11,12.
Prescale, or Fuji pressure sensitive film (C.Itoh, New York, N.Y.), is a type of pressure transducer. It consists of two pieces of film (A and C film) that when placed together can detect pressure. The A film is coated with randomly distributed microspheres that burst under various predetermined pressures. The C film is a developer that turns red when it comes into contact with the dye in the microspheres on the A film. Fuji A film comes in four pressure ranges, super low (5-25 kgf/ cm² , 71-355 PSI), low (25-100 kgf/cm², 355- 1420 PSI), medium (100-500 kgf/cm², 1420-7102 PSI), and high (500-1300 kgf/cm², 7102-18466 PSI). Fuji C film is compatible with any of the A films.
Fuji film is advantageous because the resulting transducer consisting of A and C film is thin, measuring .2 mm, thus being less invasive within a human joint than other measurement techniques such as strain gauges4,7, rubber transducers3 or miniature load cells . It also has an immediate observable force distribution pattern that is quantifiable. The manufacturer specified limits of accuracy are plus or minus 10 percent, using their densitometer (Fuji Prescale film instruction manual). However, Singerman et al.9 was not able to obtain this amount of accuracy . The company also states that the film requires no preparation for use, simply cut the film into the required shape. This process is not so simple when the shapes required are complex, like in a joint of the body. The “cuffing” process has become a major portion of the experimental preparation time in the laboratory because the film can only be used once, and a new transducer must be fabricated for each load or test. In addition, the film must remain dry. Any contact with liquids or chemicals will distort the color intensity and measurement of force. Thus, for use in human joints, the film must be sealed.
Experiments in this laboratory, on cadaver specimens, have utilized a custom made die (Kasper Die and Tool, Shiner, TX) to cut the A and C film to match the surface contour of the joint. Each transducer was designed with a “tail” that extended beyond the joint and served as a place to staple the film together, as a “handle”, and as a place to create a physical reference mark11,12. Then the transducer was taped with a low adhesive type of masking tape to seal the transducer during joint testing. This, along with cutting each side of the film, A and C, is very time consuming.
Fuji film has been determined to be an accurate and reliable method for determining contact areas and stresses within human joints10. Because the measurement testing in human joints can span several days, it is important to consider the effects of light exposure on the film. The most prominent trend is the progressive fading (increase in gray level or reduction of red coloration on the film) of the dots exposed to light and not taped. This trend is present throughout the pressure range of the film and can, therefore, alter the measurement of pressure. The film must be prepared correctly and several factors including temperature, humidity, rate of loading, curvature of loaded surfaces, and shear stresses must be considered because they may also alter the color intensity measured by the Fuji film.
Fading of the color density was seen after only a few hours of exposure to light when the Fuji film was left untaped. When the film was taped, the tape caused a slight darkening of the color on the film as time passed. Thus, for the best accuracy and reliability, the Fuji film should be digitized or analyzed within 8 hours of exposure to pressure.
One other solution to minimizing error is to create calibration prints along with the pressure measurements. These calibration prints can be analyzed along with the pressure prints because they will fade at the same rate as the pressure prints, and more reliable results can then be recorded.
References
- An, K.; et al.: Biomechanics of the Wrist. 1991. Springer-Verlag, New York. pp. 99-126.
- Hale, J. E., and Brown, T. D.: Contact stress gradient detection limits of pressensor film. J. Biomechanical Engr., 1992. 114:352-357.
- Hara, T.; Horii, E.; An, K; et al.: Force distribution across wrist joint: application of pressure sensitive conductive rubber. J. Hand Surgery, 1992. 17(2):339-47.
- Ishizuka, T.: ‘Prescale’- Pressure Measuring Sheet. Fuji film Co., Ltd.
- Mon, K.; Osakada, K; and Fukuda, M.: Measurement of contact pressure in metal forming by pressure sensitive film. J. Engr Materials & Technology, 1984. 106:127-131.
- Rieck, B.; Paar, O.; and Bernett, P.: Intra-articular pressure measurement. Anew method for the use of pressure measuring film ‘prescale’. Z. Orthop., 1984. 122(6):841-2.
- Rubayi, N. A.: Application of electrical resistance strain gages on wrist bones of freshly frozen arms in vitro. Experimental Techniques, June 1988. pp. 26-27.
- Rudert, M. J.; Baratz, M. E.; Rehak, D. C.; and Fu, F. H.: Loading characteristics of pressensor: a pressure sensitive film. 34th Annual Meeting, Orthopaedic Research Society, Atlanta, Georgia, February 1-4, 1988.
- Singerman, R. J.; Pedersen, D. R.; and Brown, T. D.: Quantification of pressure-sensitive film using digital image scanning. Experimental Mechanics, July 1986. pp. 99-105.
- Sprague, W. H., and Woo, Y. D.: Press nip pressure profile measurement. Technological Association of Paper and Pulp Industry, 1984 Engineering Conference, pp. 439-441.
- Tencer, A. F.; et al.: Pressure distribution in the wrist joint. J. Orthopaedic Research, 1988. 6(4).
- Viegas, S. F.; Patterson, R.; Tencer, A;. Peterson, P.; Roefs, J.; and Choi, S.: The effects of various load paths and different loads on the load transfer characteristics of the wrist.J. Hand Surgery, 1989. 14-A:458 465.


