

Article
Related Links
E. Barzi , T. Wokas, and A. V. Zlobin
Fermi National Accelerator Laboratory
Batavia, Illinois 60510, USA
Abstract
Fermilab is developing high field superconducting magnets for future accelerators based on Nb3Sn strands. Testing the critical current of superconducting cables under compression is a means to assess the performance of the final magnet. However, these cable tests are quite complicated and expensive. A fixture to assess the superconducting performance of a Nb3Sn strand within a reacted and impregnated cable under pressure was designed and built at Fermilab. For the present study a number of keystoned Rutherford-type cables made of 28 Nb3Sn strands 1 mm in diameter were fabricated at Fermilab using a small cabling machine. Multifilamentary Nb3Sn strands of various technologies were used. The sensitivity of Nb3Sn to transverse pressure was measured for a number of cable samples as a function of both strand technology (Modified Jelly Roll, Powder-in-Tube, Internal Tin) and cable technology.
1. Introduction
The critical current, Ic, of a Nb3Sn virgin strand is reduced during magnet fabrication and operation. In the wind and react technique, both strand deformation during cabling (before reaction) and cable compression in the coil (after reaction, due to coil precompression and Lorenz force) decrease the original Ic. This latter factor is due to Jc sensitivity of Nb3Sn to strain. In the react and wind method, the bending strain introduced during winding causes further degradation.
The Short Sample Test Facility (SSTF) at Fermilab has allowed measuring the Ic degradation due to cabling of Nb3Sn strands made with different technologies. These strands were extracted from Rutherford cables with different packing factors, heat treated and subsequently tested [1]. A method was also developed to measure Ic degradation due to bending strains of ±0.2 and ±0.4% in strands of various diameters [2]. Recent Ic data obtained in cable tests have shown an excellent correlation with strand measurements both in the case of unbent -representative of cabling degradation only- and bent samples -inclusive of both cabling and bending strain degradation [3].
The device described in this paper allows providing quantitative information on the Ic degradation occurring under stress in a Nb3Sn superconducting magnet in the simplest and cheapest way, i.e. with strand tests as opposed to cable tests, and by using an existent facility. A similar setup was successfully built in 1981 at IHEP, Protvino, USSR, to measure the inter- strand resistance of NbTi cables under pressure [4]. To reproduce the real conditions in which the superconductor will operate in the magnet, the pressure is applied to the strand within a Rutherford cable. To prevent current sharing, the housing cable is made of Cu. An impregnation fixture that is used also for reaction was designed and further improved with practice. The cable sample is stacked with a Cu cable, and the two are reacted and impregnated together. This should improve pressure distribution during testing. A fixture that allows vacuum impregnating as many as 8 samples was developed.
2. Experimental procedure
2.1. Test device
The test device [5] is shown in Fig. 1. The cable sample (1) is compressed between two Inconel plates. The bottom plate (2), made of two spherically coupled parts, is driven up by an Inconel rod assembly (3), which is pulled up by a 20 ton hydraulic cylinder placed on a stainless steel support on the top flange of the device. The top plate (4) is welded to an inconel tube (5), which is itself welded to the top flange. The assembly is immersed in boiling He at 4.2 K within the 64 mm bore of a superconducting solenoid. The device was designed such as to center the cable sample within the solenoid. After insertion in the cryostat, the top flange is fastened with screws to the existent facility. A current of up to 2000 A can be carried by the copper leads (6), which include a pair of Nb3Sn strand splices. After reaction and impregnation, the cable sample is carefully mounted at the bottom of the device by soldering the ends of a strand to the current leads. The strand ends are long enough to ensure current transfer. To allow for the differential thermal contraction between copper and Inconel, the current leads are free to move vertically within a bellow at the top of the device. To decouple the rod motion from the current leads, another smaller bellow is used.
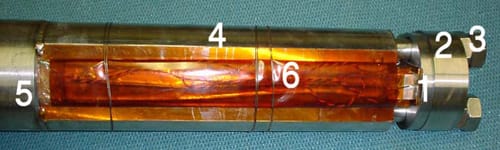
Figure 1. Test device.
2.2. Sample preparation
Cable samples were prepared by extracting a strand from a piece of superconducting Rutherford cable and inserting it in place of a Cu strand within a shorter piece of cable made of only Cu strands. This is done after welding the Cu cable ends. One edge of the extracted strand is placed in the middle of the housing cable. The ends of the selected strand had to be long enough to ensure current transfer once they would be soldered to the current leads, i.e. about 20 cm per side.
A single fixture was designed for both reaction and impregnation in order to limit handling of the sample after reaction. This fixture is shown in Fig. 2 (left and centre). It is composed of 6 stainless steel parts that contain the epoxy and of horizontal holes on either side of the sample to feed the epoxy in while vacuum pumping. After reaction in argon atmosphere, the sample is delicately removed from the fixture in order to spray the latter with Easy Release 300, manufactured by Mann Formulated Products Incorporated. The sample is then very carefully replaced in the fixture, and two small copper plates are soldered to the strand to reinforce the bends. The fixture is then closed, and as many as 8 of them can be assembled in the device shown in Fig. 2 (right) before sealing them with General Electric RTV 21 for impregnation. To avoid bubbles in the epoxy, the fixture is vacuumed overnight and CTD 101 K epoxy mix is degassed for 45 minutes at 60°C. A very slow potting (drop by drop) is also used. The curing cycle is of 130°C for 1.5 hr.
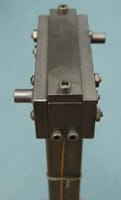
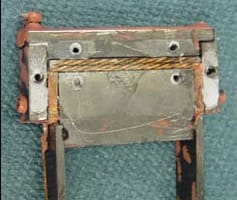
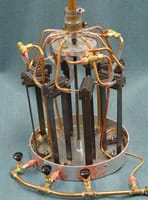
Figure 2. Left: Reaction/impregnation fixture closed before RTV sealing. Centre: After impregnation and removal of the side plates. Right: Assembly of several fixtures for multiple vacuum impregnations.
2.3. Measurement procedure
After applying very slowly the desired load by means of the Power Team hydraulic cylinder supplied by an Enerpack pump, the voltage-current (VI) characteristics were measured in boiling He at 4.2 K, in a transverse magnetic field, B, of 10 and 12 T. The voltage was measured at the ends of the cable sample by voltage taps placed 53 mm apart, just outside the cable length. The sample critical current Ic was determined from the VI curve using the backward extrapolation criterion. An additional pair of voltage taps was placed on the strand tails to ensure sample protection. To counteract the lateral Lorentz force generated by the relative directions of magnetic field and transport current, two thin G10 wings were placed at the sides of the sample through holes around the bottom rods. The estimated uncertainty of the Ic measurements in this study is within ±5%. Tests were carried out at pressures up to 200 MPa. In Fig. 3 the device is shown ready for test in the cryostat.
3. Strand and cable description
Short samples of 28-strand keystoned cables with various packing factors were fabricated in-house with and without a stainless steel core, using a constant transposition angle of 14.5 deg. The packing factor was varied by modifying cable mean thickness, whereas cable width, lay angle, and keystone angle were kept within 14.24±0.025 mm, 14.5±0.1 degree, and 0.9±0.1 degree respectively. Table I shows the parameters of the cable samples that were prepared.
Two different multifilamentary Modified Jelly Roll (MJR) Nb3Sn strands by Oxford Superconducting Technology (OST), two Powder-in-Tube strands by ShapeMetal Innovation (SMI), and the ITER design by Intermagnetics General Corporation (IGC) were used to manufacture the cables. These strands parameter ranges are shown in Table II, and the heat treatment cycles in Table III.
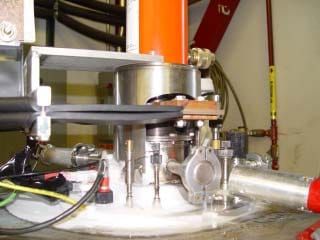
Figure 3. Strain device ready for test in the cryostat.
4. Results and discussion
4.1. ITER samples
Of the four ITER samples that were prepared one was measured. Fig. 4 shows Ic as a function of the transverse pressure applied to the ITER sample as measured at 10 T and 12 T. The lines on the plot indicate load sequences. For instance, in the case of Fig. 4, the sample was first brought to a 10 T magnetic field, loaded from 27.8 MPa to 111.2 MPa, then unloaded back to 27.8 MPa to check for degradation reversibility (none in this case). The sample was then brought to 12 T and reloaded again from 27.8 MPa up to 139 MPa, before being unloaded back to 27.8 MPa and reloaded at 180.7 MPa. The field was then decreased to 10 T without unloading the sample and testing was resumed at 208.5 MPa down to 27.8 MPa. From these first data it appears that in the case of the ITER material, Ic degradation is negligible and reversible up to about 140 MPa of pressure. Irreversibility begins at pressures somewhat larger than this value. An ampler statistics is needed to confirm and better quantify the irreversibility onset. However, at about 210 MPa of pressure, the sample shows an Ic degradation of about 40% at 10 T, which is maintained all along the unloading cycle down to 27.8 MPa.
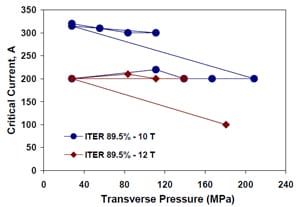
Figure 4. Ic vs. transverse pressure for an ITER sample at 10 and 12 T.
To verify ANSYS calculations [5], which had resulted in a very good pressure distribution on the sample, a pressure film was placed above and underneath each sample during mounting. This film is indicative up to 50 MPa. Fig. 5 shows the compressed film after testing the ITER sample.
The results obtained on the ITER sample could be quite homogeneously compared with actual cable tests performed on 41-strand cables made of 0.7 mm ITER strands [3]. This was done by plotting the Ic normalized to that obtained at the lowest pressure, as shown in Fig. 6. One can notice good consistency of the results at all fields at least up to pressures of 140 MPa. At about 180 MPa the observed discrepancy in Ic degradation is of about 15% at 10 T. However, this same comparison cannot be made at larger fields, since the cable tests could not be performed above 11 T.

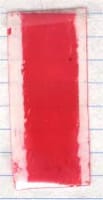
Figure 5. Pressure measuring film, medium pressure, placed on the top (left) and at the bottom (right) of the sample. The arrows indicate the location of the superconducting strand.
![Figure 6. Normalized Ic vs. transverse pressure for the ITER sample and comparison with results obtained on actual cable tests [3].](https://www.sensorprod.com/wp-content/uploads/2023/09/image10-2.jpg)
Figure 6. Normalized Ic vs. transverse pressure for the ITER sample and comparison with results obtained on actual cable tests [3].
4.2. MJR samples
Fig. 7 shows Ic as a function of transverse pressure at 12 T for the two MJR samples that were tested. These two cables were made of strands of different designs. In Fig. 8 are plotted the critical currents normalized to those at minimum loads. The first sample that was tested (blue lozenges) was loaded from 0 to about 140 MPa, then unloaded back to 0. Whereas the Ic degradation was negligible and reversible up to at least 80 MPa of pressure, the onset of irreversibility occurred somewhere between 80 and 140 MPa. At this latter pressure, the sample showed an Ic degradation of about 20%, most of which was irreversible. The sample was reloaded again from 0 up to 207 MPa, before being unloaded back to 0. At maximum pressure, the sample showed an Ic degradation of about 50%, which was reduced to slightly less than 40% at 0 pressure. When testing the second sample (green triangles), load steps were reduced in size to better determine the onset pressure of irreversibility, which in this case was found to be at around 140 MPa, and in any case below 150 MPa. After loading up to about 210 MPa, where Ic degradation was on the order of 60%, the residual degradation at 27.8 MPa was about 30%. The very similar behavior of these two MJR samples is evidenced in Fig. 8.
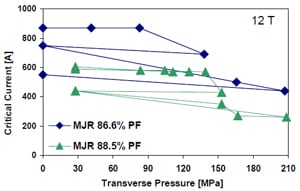
Figure 7. Ic vs. transverse pressure for two MJR samples at
12 T.
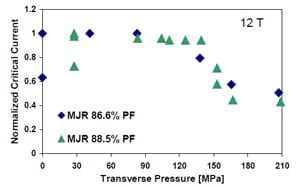
Figure 8. Normalized Ic vs. transverse pressure for two MJR samples at 12 T.
4.3. PIT samples
All four PIT samples were tested either at 10 or 12 T and results are shown in Fig. 9. The cable with 86.7% packing factor (green triangles) was made of a strand of slightly different design than that of the other three cables. Up to about 60 MPa of pressure the Ic degradation was found to be reversible for at least one sample, and smaller than 15% for all samples both at 10 and 12 T. The onset of irreversibility should therefore occur beyond 60 MPa. However, at 100 MPa the Ic degradation was already around 20% for all samples, and appeared to rapidly decrease at larger loads. After loading up to about 200 MPa, the Ic degradation was on the order of 90%, all of it permanent.
5. Summary
These first results obtained on sensitivity of Nb3Sn to transverse pressure by testing a Nb3Sn strand within a reacted and impregnated cable under pressure already show solid consistency, as evidence by Fig. 10, where the normalized Ic is plotted as a function of transverse pressure for all the samples tested at 12 T. However, more statistics is needed to either confirm or refine the present findings.
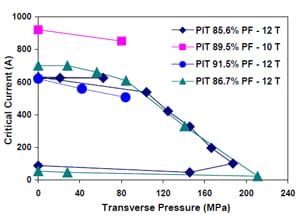
Figure 9. Ic vs. transverse pressure for the four PIT samples.
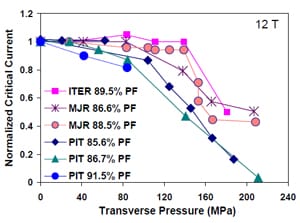
Figure 10. Normalized Ic vs. transverse pressure for all samples tested at 12 T.
References
- E. Barzi et al., “Strand critical current degradation in Nb3Sn Rutherford cables”, ASC ‘00, Virginia Beach, VA, Sept. 17-22, 2000.
- G. Ambrosio at al., “Study of the react and wind technique for a Nb3Sn common coil dipole”, MT-16, IEEE Transaction on Applied Superconductivity, Vol.10, no.1, pag.338, March 2000.
- P. Bauer et al., “Fabrication and testing of Rutherford cables for react and wind accelerator magnets”, ASC ‘00, Virginia Beach, VA, Sept. 17-22, 2000.
- A. Zlobin, G. Enderlein, “Transverse resistance measurements of flat transposed superconducting cables under pressure”, Preprint IHEP 81-57, Serpuskhov, 1981.
- E. Barzi , M. Fratini, and A. V. Zlobin, “A device to test critical current sensitivity of Nb3Sn to pressure”, CEC/ICMC 2001.
![]()