Jaak J.K. Daemen, Lumin Ma, and Guohua Zhao, Department of Mining Engineering, University of Nevada, Reno
1. Introduction
The study of the long term mechanical behavior of Yucca Mountain tuffs is important for several reasons. Long term stability of excavations will affect accessibility (e.g. for inspection purposes), and retrievability. Long term instabilities may induce loading of drip shields and/or emplaced waste, thus affecting drip shield and/or waste package corrosion. Failure of excavations will affect airflow, may affect water flow, and may affect temperature distributions.
The long term mechanical behavior of rocks remains an elusive topic, loaded with uncertainties. A variety of approaches have been used to improve the understanding of this complex subject, but it is doubtful that it has reached a stage where firm predictions can be considered feasible.
The long term mechanical behavior of “soft” rocks, especially evaporites, and in particular rock salt, has been the subject of numerous investigations (e.g. Cristescu and Hunsche, 1998, Cristescu et al, 2002), and basic approaches towards engineering taking into account the long term behavior of such materials have long been well established (e.g. Dreyer, 1972, 1982). The same is certainly not true of “hard” rocks. While it long has been recognized that the long term strength of “hard” rocks almost certainly is significantly less than that measured during “short”, i.e. standard (ASTM D 2938), ISRM suggested (Bieniawski et al, 1978) and conventionally used test procedures (e.g. Bieniawski, 1970, Wawersik, 1972, Hoek and Brown, 1980, p. 150), what limited approaches have been taken to develop strategies toward determining the long term mechanical behavior of “hard” rock remain in the early research and investigation stage, at best. One early model developed specifically for time dependent analysis of underground “hard” rock structures is the phenomenological model by Kaiser and Morgenstern (1981). Brady and Brown (1985, p. 93) state that over a wide range of strain rates, from 10-8 to 102/s the difference in strength is only a factor of 2, and that “the observed behavior of rock is not significantly influenced by varying the strain rate within the range that is convenient to use in quasi-static laboratory compression tests.” While this is undoubtedly true, it does not really address the question as to whether or not strengths thus measured can be considered appropriate for estimating long term strengths.
One objective of this investigation was to evaluate the applicability of the approaches by Cruden (e.g. Cruden, 1971, 1974, 1983, 1987) and by Lajtai (e.g. Lajtai and Schmidtke, 1986, 1987) to the prediction of the long term mechanical behavior of the investigated tuffs. This involves in particular static fatigue testing, by conducting uniaxial, triaxial, and indirect splitting (Brazilian) tests over a wide range of strain (or stress, or displacement) rates.
2. Mechanical Testing
We have used a variety of mechanical test methods to determine the long term mechanical behavior of the investigated tuffs. The principal approach pursued is to investigate the long term behavior by studying the mechanical behavior over a range of strain rates, trying to understand the mechanical behavior of the rock at these different strain rates, and try to determine whether and to what extent the behavior can be extrapolated over times well exceeding those of interest for conventional underground construction or mining, but of direct potential importance for repository stability and excavation behavior. The principal test types implemented for this project include triaxial and uniaxial compression, indirect tensile splitting (“Brazilian”), and creep tests.
Most testing performed as part of this project has been done on specimens from the Topopah Spring crystal-poor middle nonlithophysal zone (Tptpmn), with a smaller number of tests on samples from the Topopah Spring crystal-poor lower nonlithophysal zone (Tptpln). Most testing has been done on specimens of 2.4 inch (61 mm) diameter, with a much smaller number on specimens with a 1.77 inch (45 mm) diameter, clearly not a sufficiently wide range to allow a full definition of the size effect, but nevertheless a step in that direction. All testing has been performed on MTS servo-controlled hydraulic test systems.
2.1. Triaxial Testing
Thirty triaxial compression tests have been completed, and for about half of them multiple post-peak loading-unloading cycles have been performed. (When multiple loading-unloading cycles are performed on a sample, the loading steps all are performed at the same displacement rate. The unloading is initiated when the control system detects failure, i.e. a significant load drop, and proceeds relatively quickly, typically in about 5 to 10 minutes. In some cycles an operator set displacement limit was reached, and the cycle thus terminated.). Triaxial testing has been conducted at axial displacement rates from 0.16 to 0.0016 mm/min, corresponding to axial strain rates from about 10-5/s to about 10-7 /s (strain rates averaged over the sample length from measured axial displacements), under confining pressures of 5, 10, and 20 MPa. The displacement is controlled with the machine LVDT installed inside the hydraulic cylinder driving the load. Sample information is given in Table 1.1, test conditions and results in Table 1.2, Appendix 1. All but one triaxial test have been performed on samples from the Tptpmn (Topopah Spring middle nonlithophysal) zone, and all on specimens with a nominal 61 mm (2.4 inch) diameter.
The axial force-displacement loading curves virtually all show markedly nonlinear behavior, with the deviation from linearity occurring at about 50 to 60 % of the peak load (Figs. 1.2.1 – 1.2.15), Similar nonlinear behavior is seen in the strain gage results, both for axial and for lateral strain (Figs. 1.3.1 through 1.3.15).
Although the number of results is far from sufficient to allow drawing firm final conclusions, there are strong indications, obtained mainly from cyclic testing, that the tested tuffs are very brittle at confining pressures up to at least 10 MPa (e.g. Figs. 1.3.16, 1.3.18). This confirms observations made during a previous investigation that the tested tuffs are extremely brittle in uniaxial compression (Ma, 2004, Ma and Daemen, 2004). The single cycle force-displacement graphs for virtually all tests suggest rather brittle behavior during the first cycle (Figs. 1.2.1 through 1.2.15). On the other hand at least a small number of tests at confining pressures of 20 MPa show somewhat less brittle behavior in multiple post-peak cycles. Fig. 1.3.19 illustrates some reduced post-peak stiffness. Figs. 1.3.17 and 1.3.21 illustrate a behavior pattern that has been observed repeatedly: a very steep force drop after
the first loading step, and then a sustained load/stress plateau over a quite large displacement distance at an essentially constant load. (In these post-peak cycles the loading was discontinued when an operator set displacement limit was reached). (It is possible that this behavior may be an artifact of the test arrangement, although it is not clear what this would be. Clear is that further testing is needed to establish whether or not and to what extent this is true post-peak rock behavior). Although the data is very preliminary, and far from conclusive, the evidence collected so far strongly suggests that the hypothetical conceptual model postulated by Hudson et al (1973, Fig. 6) may be a very reasonable and appropriate one for the tested tuff, but with the important qualifier included by the authors that it appears that the post peak at faster rates may descend much faster than at slower rates.
Most studies of the effect of strain rate on rock strength have been performed in uniaxial compression. Martin et al (1993) reported a series of unaxial constant strain rate tests on Topopah Spring tuff, under fully saturated conditions. Earlier work by Martin (1972, and Martin and Durham, 1975) already had demonstrated the time dependent fracturing of silicate containing rock in the presence of water.
Kawamoto and Saito (1974) tested cement mortar, sandstone, and tuff, at three strain rates, in uniaxial and triaxial compression, showing the typical strength – strain rate relations. Ray et al (1999) report fatigue cycling of a sandstone at three strain rates. Singh et al (1989) performed uniaxial compression tests on sandstone and on marble at strain rates from 10-6 to 103/s, showing a systematic strength increase with strain rate. Several of these authors comment that the strain at failure appears to be virtually independent of the failure stress (or strain rate), a topic that deserves further investigation.
2.2. Indirect Splitting Tensile Strength (“Brazilian”) Testing
One hundred and eleven Brazilian tests have been performed, at machine displacement rates ranging from 0.000145 mm/min to 2 mm/min. Test durations range from a few minutes to tens of hours.
Sample information, test information, and results, are given in Appendix 2. The results should provide a good data base to initiate a static fatigue analysis, but clearly testing over a wider range of strain rates would be desirable, if not essential, to develop statistical significance.
It is striking that many of the fractured specimens show a slightly off center main fracture, curved, apparently closely following a tensile principal stress trajectory (Coker and Filon, 1957, p. 411, Colback, 1966, Figs. 2 and 3, Hiramatsu and Oka, 1970, Fig. 2, Andreev, 1995, Figs. 4.27, 4.28, 4.31) (e.g. Figs. 2.5.7 – 2.5.10). A similar observation was made by Addinall and Hackett, 1964, but they seem to imply only for specimens with a small hole at the center of the disk. They “explain” the deviation as an effect of a hole size being of the same magnitude as natural discontinuities in the material tested? In most of our tests the primary fracture is accompanied by classical “hourglass” or “triple-cleft” shaped secondary fractures (e.g. Rudnick et al, 1963, Addinall and Hackett, 1964, Colback, 1967, Andreev, 1995, Fig. 4.39). The curved fracture geometry we observe predominantly is very similar to the one observed by Hooper (1971) in glass, except for the fact that we typically observe only one of these “primary” fractures. However, his observation that in glass failure initiates at the loading contact is not consistent with our observations. On multiple occasions specimens that had virtually completely fractured still remained “intact” (barely) at the loaded edges. Nevertheless, the similarities certainly seem sufficient to warrant further study of the Hooper (1971) analysis. Certainly it would be desirable, following Hooper’s approach referenced to Gramberg (1965) to pursue a fractographic analysis (e.g. Ameen, 1995) for a more in depth assessment of the mechanics of fracture in the Brazilian tests performed. Brown and Trollope (1968) show curved ‘diametrical” fractures (Fig.8), without commenting on the curvature. They also show a fracture surface (Fig 9), using a fractographic approach that indicates failure initiation “near” the center of the disk.
We have given considerable emphasis to the interpretation of displacements measured during indirect tensile splitting tests. The main objective of this aspect of the investigation was to try to determine an explicit measure of the rock stiffness, e.g. in terms of its Young’s modulus, on the basis of the simplest possible indirect tensile testing, i.e. by measuring the machine displacement only. If such a determination could be made, reliably and consistently, it would provide an ideal tool to investigate the spatial variability of the rock stiffness, because it requires far less core, sample preparation, test time, and data analysis than compressive testing.
One approach to the displacement analysis has been the use of the displacement formulas given by Jaeger and Cook (1979, Section 10.7). A numerical evaluation of these displacement formulations is given in Appendix 2.3. Problems have been encountered in matching or reconciling these calculated displacements with measured displacements. Investigations into reconciling the discrepancies have been started including measuring the displacements (deformations) of the compressible inserts used during testing, and measuring the test system deformation during testing. Alternative displacement calculations have been considered (e.g. Mushkelishvili, 1963, §80a, 1º; Saada, 1993, Section 19.16). These “solutions” will require considerable further derivations before they can be implemented as a direct numerical formulation.
One possible explanation for the difference between the measured and the calculated displacements may be the fact that the Young’s modulus of rock tends to be smaller in tension than in compression (e.g. Price, 1966, p. 8), and hence the behavior may become anisotropic during Brazilian tests. It is possible that the anisotropic solutions that have been published for the Brazilian test could be used for the analysis (e.g. Amadei et al, 1983, Exadaktylos and Kaklis, 2001, Claesson and Bohloli, 2002), or that a bimodular numerical analysis (e.g. Chen and Stimpson, 1993) may be required.
An analysis of this type would require knowing the moduli in tension as well as in compression. Conversely, it may be possible to invert the problem, and calculate the tensile modulus from the displacement measurements if the compressive modulus is known?
One factor that may affect results of Brazilian tests, including deformations, may be the load distribution. Jaeger and Cook (1979), following Hondros (1959), and most rock mechanics authors using Brazilian or similar (e.g. ring) tests assume a uniform contact stress or contact pressure distribution. Such a uniform pressure distribution seems highly unlikely given the contact nature of the problem. Fairhurst (1964), Colback (1966), Vardar and Finnie (1975), among many others, argue that the details of the contact pressure distribution should not be particularly relevant, given that our prime interest is in rock failure, at the center of the disk, i.e. far away from the applied (boundary) stress. This may well be true, is true, but the contact mechanics significantly affects the stress distribution in the contact area, and almost certainly is a major factor in assuring that fracture does not initiate in the contact areas(s). While we recognize that it may be true, is likely true, that the stress state in the center of the disk is largely independent of the load application, e.g. because this is a direct application of Saint Venant’s principle (e.g. Saada, 1993, Section 8.13), we investigated the contact stress for other reasons as well, notably because th
e contact angle is needed in displacement calculations. Results of contact angle measurements are included in Appendix 2, Section 2.4. Measurements of the contact width, and hence contact angle, are subject to fairly large measurement uncertainties (up to 10 % for specimens with 61 mm diameter, possibly larger, up to 15 % for specimens with a 45 mm diameter). Results of contact pressure measurements (using Sensor Products LLC, East Hanover, NJ contact pressure film) are given in Appendix 2.4. Although a detailed numerical analysis of the contact stresses at this time is not yet possible (because the contact stresses are too high, Vadim Shalyt, Sensor Products Inc., personal communication, August 2005), it is clear from the measurements that a parabolic (Hertzian) contact pressure distribution is far more realistic than the assumption of a uniformly distributed pressure. (We were recently informed by Mr. Shalyt (February 20, 2006) that they now can analyze numerically the very high pressure film – it obviously would be most desirable and helpful to perform such numerical determinations, because it would give a much better insight into the actual contact pressures that develop in Brazilian tests). Equally clear from the measurements is that in at least two samples highly localized contact loads develop, almost point loads, presumably caused by the roughness of the contact area. Again, invoking Saint Venant’s principle, it may not matter, as long as the principal fracture is initiated at or near the center of the disk, but one has to wonder whether there may be an effect of inducing fracture initiation at or near the loaded edge(s)? (In multiple tests, especially tests run at very low displacement rates, it was clear that the principal fracture did not initiate at the edge(s), because the two halves that were separated in the middle still hung together (although barely) at the edges. An observation identical to one made by Berenbaum and Brodie, 1959, and Mellor and Hawkes, 1971. It is interesting that Gramberg (1989, fig. 12) in what appears to be a very careful fractographic observation of the fractured surface in a Brazilian test locates the initiation point, the fracture nucleus, well off center (although on the compressed diameter).
Several options/approaches may be worthwhile pursuing in order to clarify the effect of the surface roughness on the contact pressure distribution. One method might be to impose smoothness requirements on the contact area, which could be accomplished for example by rounding and smoothing the samples in a lathe, or by grinding the cylindrical (contact) surface area. This would add considerably to the time and hence cost of sample preparation. It may be possible to investigate analytically and/or numerically the influence of surface roughness, although this also would present considerably challenges, both with respect to determining the roughness, and with respect to calculating its effect (e.g. Sayles et al, 1981). Moreover, the analysis would have to be three-dimensional.
Vardar and Finnie (1975) flattened the contact area with the explicit purpose of simplifying the contact pressure and making it uniform over an imposed width.
Hertzian type contact problems pose major analysis challenges, as demonstrated by the fact that it took many decades for correct numerical results to be obtained from the original Hertz formulation (Hertz, 1881), (e.g. Cooper, 1969, Shigley, 1986, p. 79), and that these problems remain difficult to model numerically (e.g. Hilss et al, 1993, p.x). We assume that the contact stresses are strictly normal, i.e. free of shear, an assumption strictly correct only when both bodies in contact have the same moduli (e.g. Lubkin, 1962), an assumption obviously violated in our tests. Moreover, there are fundamental inconsistencies in the application of the “classical” theory to two-dimensional problems (e.g. Schwartz and Harper, 1971). If the contact deformation/pressure is a significant cause of uncertainty about the diametrical compression, its resolution may not be simple.
Mirza et al (1997) calculated the deformations of Brazilian specimens by numerical integration of the diametrical strains. This may be an approach worthwhile pursuing for the analysis of our displacement data. They observed, in their tests on asphalt concrete (bitumen + aggregate mixtures) that the aggregate inclusions/particles significantly affected crack propagation. It is possible that this heterogeneous material behavior may be parallel to the heterogeneity effects in tuff? (In this case, with soft, rather than stiff inclusions?)
Some Brazilian tests have been videorecorded, with the objective of determining the fracture initiation point and the fracture propagation. These measurements have been only partially successful. While the records usually clearly show the prime and secondary fractures, the prime (“diametrical”) fracture usually is completely developed in a single frame, providing no information about where the fracture initiates nor about how fast it propagates. The fast completion of the fracture, even at very low loading rates, may confirm the exceedingly brittle behavior of these tuffs?
Most Brazilian testing has been performed on specimens with nominal diameters of 2.4 inch (61 mm), primarily of the Tptpmn (Topopah Spring middle nonlithophysal) formation. Some tests have been performed on specimens with a smaller diameter (1.77 inch (45mm)), thus allowing the beginning of an investigation into size effects, although clearly not sufficient to allow even a preliminary size effect determination (e.g. Yegulalp and Kim, 1993).
It is striking that the force-displacement graphs of the Brazilian tests consistently show nonlinear behavior (e.g. Figs. 2.5.1 – 2.5.6), although frequently with a linear section as failure is being approached. The initial nonlinearity may be due to the contact area and pressure distribution changing, and/or to intrinsically nonlinear material behavior (as consistently observed in uniaxial and triaxial compression tests)?
2.3. Uniaxial Compression Test
One uniaxial compression test has been performed, on a 2.4 inch (61 mm) diameter sample from the Tptpln (Topopah Spring lower nonlithophysal) formation, at an average axial stress rate of slightly over 9 MPa/min. The specimen failed after slightly less than seven minutes. Details are given in Appendix 3. Figures 3.1 and 3.2 show axial displacement – force and stress – strain loading and unloading curves, suggestive of very brittle behavior.
This test was intended to become a creep test, but the specimen failed before reaching the first intended creep level (70 MPa). The photographs included in Appendix 3 illustrate the extreme heterogeneity of this specimen, which may explain its very low strength? Failure appears to have been predominantly slabbing near one end, although some fairly pervasive axial splitting also is clearly visible.
2.4. Uniaxial Compression Creep Test
One creep test has been performed, on a sample from the Tptpmn formation, with a diameter of 2.4 inch (61 mm). The test, described in Appendix 4, consisted of three loading steps, a typical stepwise creep testing approach (e.g. Kie, 1993). The results are given in Appendix 4. Figure 4.1 shows the force-displacement curves for the three stress levels to which the specimen has been loaded. Figure 4.2 shows the axial stress – axial strain curves. Figure 4.3 shows axial strain as a function of time. Ultimate failure appears to have been fairly localized (Figs 4.4 – 4.8), with a local slab forming on one side, although some additional axial splitting took place.
2.5. Particle size distribution
Simple visual inspection strongly suggests a correlation between strain rate and particle size of the fragments resulting from uniaxial compression tests. Figures 5.1 and 5.2 illustrate this perception. Particle size analysis documented in Appendix 5 confirms this perception, but is in need of further confirm
ation.
The particle size distribution study was performed by sieving (ASTM C 136, ASTM D 422). The grading, or particle size distribution, is given in Tables 5.1 and 5.2. An initial analysis of the dependency of particle size distribution on strain rate is given in Figures 5.2 through 5.9. These figures confirm the perception that faster strain rates result in smaller particles. We recognize that the statistical reliability of these results (of this very preliminary study) is uncertain. Reasons for statistical uncertainty include the intrinsically large variability of mechanical properties of Yucca Mountain tuffs, and the relatively small number of tests we have been able to do at very low and at very high strain rates. It obviously would be highly desirable to increase the data base by additional testing, especially in these extreme strain ranges.
Because axial splitting is a major mechanism of tuff failures in uniaxial compression, especially at low strain rates, the fragments resulting from the low strain rates in particular tend to have a markedly elongated shape. This shape effect is not accounted for in the sieving analysis performed here. (In fact, the sieving may have been affected somewhat by manual assistance to assure that particles with highly unequal dimensions were passing the sieve size for the smallest dimension.)
It is well known and has long been recognized that particle shape affects sieving, and, more generally, particle size distribution determinations (e.g. Rosen and Hulburt, 1970, Novak and Thompson, 1986, Ferreira et al, 1993, Hogg et al, 2004). Hence, it certainly would be preferable to repeat particle sizing using techniques that account for any shape effects.
It is clear that a much more comprehensive analysis of the influence of strain rate on failure mechanics would be highly desirable. The most obvious immediate step would be to construct the grading curves for the results obtained. As a next step, this could involve an investigation with more emphasis on the particle shape, rather than on particle size only. A number of techniques are available to pursue such shape investigations. Most basic would be to determine particle shapes according to ASTM D 3398 and/or ASTM D 4791. This would allow classification of the fragments into elongated, flaky, or both (see also Smith and Collis, 1993, pp. 173 – 175, Smith and Collis, 2001, pp. 173 – 175, Primel and Tourenq, 2000, pp. 133-4). In addition, complementary to such most basic measurements would be an analysis following one of a number of well established procedures for determining particle shape characteristics (e.g. in geology/sedimentology (e.g. Wadell, 1933, Krumbein, 1941, Rittenhouse, 1943, Krumbein and Sloss, 1963, pp. 106 – 113) and/or soil mechanics/geotechnical engineering (e.g. Vallerga et al, 1957, Holubec and D’Appolonia, 1973, Dickin, 1973)). These “conventional” or “traditional” approaches are likely to clearly distinguish flaky and/or elongated fragments from more cuboidal or equidimensional ones (e.g. Figures 5.1 and 5.2). In fact, visual observation of the particles suggests that even a simple aspect ratio definition might suffice as a discriminating characteristic? The Rittenhouse (1943) (also Vallejo, 1995) approach may be particularly attractive for this determination, and instructive, because it could provide a quick purely visual estimating framework, without the need for laborious and time consuming manual labor required by more formal numerical schemes. Among these, the axial ratio shape factors (e.g. Eerola and Ylosjoki, 1970) certainly would be expected to be clarifying, although the sphericity/shape factors, according to Barrett (1980), may be better discriminators than simple axial ratios.
An improvement over this basic relatively elementary approach might be to classify the fragments according to the Zingg classification (e.g. Krumbein and Sloss, 1963, Fig. 4-8).
A further improvement undoubtedly would be the use of more comprehensive numerical classifications, e.g. using Fourier and/or fractal analysis (e.g. Ehrlich and Weinberg, 1970, Meloy, 1977, Schwarz and Exner, 1980, Dowdeswell, 1982, Clark, 1986, Meloy and Clark, 1986, Vallejo, 1995, Thomas et al, 1995, Bowman et al, 2001, Wettimuny and Penumadu, 2004). This would allow a much more rigorous definition of the particle shapes (and sizes), and should allow a correlation with induced fracture patterns. We recognize that the immediate physical meaning of the variables involved tends to be lost with such methods, as stated by Kwan et al, 1999, one reason why these methods are considered a complement to rather than a substitute for the more “elementary” conventional but physically more obvious and clearer methods. A most rigorous analysis and discussion of the shape definition issues is presented by MacLeod (2002), which certainly deserves pursuing.
Almost certainly it would be preferable to use some of the more recently developed digital shape acquisition hardware and shape analysis software (e.g. Franklin et al, 1996, Podczeck, 1997, Hundal et al, 1997, Brzezicki and Kasperkiewicz, 1999, Maerz, 2004) for the practical implementation of such analyses.
An implied justification for the study of fragment size/shape as a function of strain rate is that a relation exists between fracture patterns and fragment size/shape. It would be desirable, probably preferable, to directly focus on fracture patterns, rather than indirectly through the study of fragments. Wu and Pollard (1993) convincingly demonstrate a pronounced relation between strain rate and fracture shape and density. It is likely that a study focusing on the fracture geometries would assist in describing and explaining the differences in failure behavior as a function of strain rate. Gramberg (1989) discusses fracture development in some detail, and, specifically (Fig. 17) mentions the “splintering in an explosive way” of glass in uniaxial compression, a rather typical failure mode for the tuffs we tested as well.
3 Summary, Conclusions, and Recommendations
Mechanical testing has been performed to investigate the long term mechanical behavior of Yucca Mountain tuffs. Most of the testing has been performed on specimens from the Topopah Spring crystal-poor middle nonlithophysal (Tptpmn) zone), and some on specimens from the Topopah Spring crystal-poor lower nonlithophysal (Tptpln) zone.
Many of the tested samples are obviously heterogeneous. It may be worthwhile to analyze the mechanical behavior explicitly recognizing this heterogeneity, e.g. following Chen et al, 2004. It certainly would be desirable to normalize all results with respect to density (e.g. Olsson, 1991). This most likely would reduce at least some of the variability. Ideally all such testing should be accompanied by a detailed characterization of the inhomogeneity, in particular distribution, density, shape, etc. distribution of lithophysal cavities and soft vapor-phase altered volumes (e.g. Martin III et al, 1993).
The dominant significant of lithophysal cavities on the mechanical behavior of these tuffs has been recognized and investigated by Karakouzian and associates (e.g. Hudyma, 2001, Avar, 2003, Avar et al, 2003, Hudyma et al, 2004). Price and Bauer (1985) and Price et al (1994) also explicitly address the influence of porosity on mechanical behavior of tuffs.
It is recommended that more cyclic testing be performed, and that the analysis procedures developed by Costin and Holcomb (1981) be applied to the results.
It almost certainly would be productive to pursue damage analysis (e.g. Sun and Hu, 1997, Pan and Wen, 2001).
A high priority would be a continued systematic investigation of the long term strength (and stiffness?) of the various rock types that will form the host rock of an eventual repository. Most promising potential analysis tools have been developed by Cruden (1974, 1987), and Lajtai and co-authors (e.g. Schmidtke and Lajtai, 1985, Lajtai and Schmidtke
, 1986, 1987, Lajtai and Bielus, 1986). Ideally long term testing should be conducted under a range of environmental conditions that the rock might be subjected to over the duration of the required repository performance, e.g. with respect to temperature and moisture conditions. In light of the considerable variability of the mechanical properties of these tuffs, it is likely that a considerable number of tests would be required in order to obtain statistically significant results, A combination of uniaxial and triaxial compression tests, with Brazilian and point load tests, might lead to a sufficient data base under a sufficiently wide range of test conditions and for a variety of failure modes.
The effect of water (steam) on the long term mechanical behavior of these tuffs almost certainly deserves much more investigation. It is obvious that the development of a defensible model of the long term mechanical behavior of these tuffs requires considerably more research. As a minimum, a significantly larger data base needs to be developed, in order to assure that the (spatial) variability of the tuffs is adequately understood. Experimental results are needed under the full range of anticipated or likely repository conditions. Rational mechanical models are needed to integrate the data into a credible predictive model.
It clearly would be desirable to perform more detailed petrographic and mineralogical characterization of tested specimens. If only to investigate to what extent such characterizations might allow correlations with mechanical properties, and hence reduce the need for mechanical testing by allowing credible estimates of the mechanical behavior based on mineralogical/petrographical characterizations.
In all probability it would be most helpful to complement mechanical testing with detailed investigations of fractures developing in the specimens (e.g. Åkesson et al, 2004). A better understanding of the physical failure modes might assist in identifying the most appropriate failure model(s).
4. References
- Addinall, E. and P. Hackett, 1964, Tensile Failure in Rock-like Materials, pp. 515 – 538, Proceedings of the Sixth Symposium on Rock Mechanics, E.M. Spokes and C.R. Christiansen, The University of Missouri at Rolla.
- Amadei, B., J.D. Rogers and R.E. Goodman, 1983, Elastic constants and tensile strength of anisotropic rocks, Proceedings Fifth Congress of the ISRM, Melbourne, Australia, Vol. 1, pp. A189 – A 196, A.A. Balkema, Rotterdam.
- Ameen, M.S., Editor, 1995, Fractography: fracture topography as a tool in fracture mechanics and stress analysis, Geological Society Special Publication No. 92, The Geological Society, London.
- Andreev, George E., 1995, Brittle Failure of Rock Materials Test Results and Constitutive Models, A.A. Balkema, Rotterdam/Brookfield.
- Åkesson, Urban, Jan Hansson, and Jimmy Stigh, 2004, Characterisation of microcracks in the Bohus granite, western Sweden, caused by uniaxial cyclic loading, Engineering Geology, Vol. 72, pp. 131 – 142.
- ASTM C 136 – 96a, Standard Test Method for Sieve Analysis of Fine and Coarse Aggregates, Annual Book of ASTM Standards 2000, Section 4, Construction, Volume 04.02, Concrete and Aggregates, ASTM, West Conshohocken, PA.
- ASTM D 422 – 63 (Reapproved 1998), Standard Test Method for Particle-Size Analysis of Soils, Annual Book of ASTM Standards 2000, Section 4, Construction, Volume 04.08, Soil and Rock (1): D 420 – D 5779, ASTM, West Conshohocken, PA.
- ASTM D 2938 – 95, Standard Test Method for Unconfined Compressive Strength of Intact Rock Specimens, Annual Book of ASTM Standards 1996, Section 4, Construction, Volume 04.08, Soil and Rock (1): D 420 – D 4914, ASTM, West Conshohocken, PA
- ASTM D 3148 – 96, Standard Test Method for Elastic Moduli of Intact Rock Core Specimens in Uniaxial Compression, Annual Book of ASTM Standards 2000, Section 4, Construction, Volume 04.08, Soil and Rock (1): D 420 – D 5779, ASTM, West Conshohocken, PA.
- ASTM D 3398 – 97, Standard Test Method for Index of Aggregate Particle Shape and Texture, Annual Book of ASTM Standards 2000, Section 4, Construction, Volume 04.03, Road and Paving Materials; Vehicle-Pavement Systems, ASTM, West Conshohocken, PA.
- ASTM D 3967 – 95a, Standard Test Method for Splitting Tensile Strength of Intact Rock Core Annual Book of ASTM Standards 2000, Section 4, Construction, Volume 04.08, Soil and Rock (1): D 420 – D 5779, ASTM, West Conshohocken, PA., West Conshohocken, PA.
- ASTM D 4791 – 99, Standard Test method for Flat particles, Elongated Particles, or Flat and Elongated particles in Coarse Aggregate, Annual Book of ASTM Standards 2000, Section 4, Construction, Volume 04.03, Road and Paving Materials; Vehicle-Pavement Systems, ASTM, West Conshohocken, PA.
- Avar, Bahri B., The Influence of Lithophysal Porosity on the In-Situ Stress-Strain Properties of Topopah Spring Tuff, Final Technical Report U.S. DOE/UCCSN Cooperative Agreement, DE-FC28-98NV12081, Document Number TR-02-008, https://hrc.nevada.edu/QA/Report/TR-02-008.pdf.
- Avar, B., N. Hudyma, and M. Karakouzian, 2003, Porosity dependence of the elastic modulus of lithophysae-rich tuff: numerical and experimental investigations, International Journal of Rock Mechanics and Mining Sciences, Vol. 40, May, pp. 919-928.
- Barrett, P.J., 1980, The shape of rock particles, a critical review, Sedimentology, Vol. 27, pp. 291 – 303.
- Berenbaum, R., and I. Brodie, 1959, Measurement of the tensile strength of brittle materials, pp. 281-287, British Journal of Applied Physics, Vol. 12, January.
- Bieniawski, Z.T., 1970, Time-Dependent Behaviour of Fractured Rock, Rock Mechanics, Vol. 2, pp. 123-137.
- Bieniawski, Z.T., and I. Hawkes, 1977, Suggested Methods for Determining Tensile Strength of Rock Materials, ISRM Commission on Standardization of Laboratory and Field Tests, Committee on Laboratory Tests, Document No. 8, Int. J. Rock mech. Min. Sci. & Geom. Abstracts, Vol. 15, No.3, pp. 99-103 (1978).
- Bieniawski, Z.T., J.A. Franklin, M.J. Bernede, P. Duffaut, F. Rummel, T. Horibe, E. Broch, E. Rodrigues, W.L. Van Heerden, U.W. Vogler, I. Hansagi, J. Szlavin, B.T. Brady, D.U. Deere, I. Hawkes, and D. Milovanovic, 1978, Suggested Methods for Determining the Uniaxial Compressive Strength and Deformability of Rock Materials, Published in International Journal of Rock Mechanics and Mining Sciences & Geomechanics Abstracts, Vol. 16, No. 2, pp. 135 – 140 (1979), and in Rock Characterization Testing and Monitoring, ISRM Suggested Methods, pp. 113 – 116, E.T. Brown, Editor, Pergamon Press, Oxford, 1981.
- Bowman, E.T., K. Soga, and W. Drummond, 2001, Particle shape characterisation using Fourier descriptor analysis, Géotechnique, Vol. 51, No. 6, pp. 545-554.
- Brady, B.H.G., and E.T. Brown, 1985, Rock Mechanics For Underground Mining, George Allen & Unwin, London.
- Brown, E.T., and D.H. Trollope, The Failure of Brittle Materials under Effective Tensile Stress, Felsmechanik un Ingenieurgeologie – Rock Mechanics and Engineering Geology, Vol. VI, No. 1-2, pp. 229 – 239.
- Brzezicki, Jerzy M. and Janusz Kasperkiewicz, 1999, Automatic Image Analysis in Evaluation of Aggregate Shape, Journal of Computing in Civil Engineering, Vol. 13, No. 2, April, pp. 123 – 128.
- Chen, Rui and Brian Stimpson, 1993, Indirect Tension Tests on Rock – Analytical/Numerical Correction for Material Bimodularity, Geotechnical Testing Journal, Vol 16, No. 2, pp. 238 – 245.
- Chen, S., Z.Q. Yue, L.G. Tham, and P.K.K. Lee, 2004, Modeling of the indirect tensile test for inhomogeneous granite using a digital image-based numerical method, Paper 2B 01 – SINOROCK 2004 Symposium, Int. J. Rock Mech. Min. Sci. Vol. 41, No. 3, CD-ROM.
- Claesson, J. and B. Bohloli, 2002, Brazilian test: stress field and tensile strength of anisotropic rocks using an analytical solution, Int. J. Rock Mech. Min. Sci.
, Vol. 39, pp. 991 – 1004. - Clark, N.N., 1986, Three Techniques for Implementing Digital Fractal Analysis of Particle Shape, Powder Technology, Vol. 46, pp. 45 – 52.
- Coker, E.G., L.N.G. Filon, 1957, A Treatise on Photo-Elasticity, Revised by H.T. Jessop, Cambridge at the University Press.
- Colback, P.S.B., An analysis of brittle fracture initiation and propagation in the Brazilian test, Proc. First Congress International Society of Rock Mechanics, Vol. 1, pp. 385 – 391.
- Cooper, Duane H., 1969, Hertzian Contact-Stress Deformation Coefficients, Journal of Applied Mechanics, Transactions of the ASME, Vol. 36, Series E, Number 2, June, pp. 296 – 303.
- Costin, Laurence S., 1967, Time-Dependent Deformation and Failure, Ch. 5, pp. 167-215, Fracture Mechanics of Rock, Barry Kean Atkinson, Editor, Academic Press, London.
- Costin, L.S. and D.H. Holcomb, 1981, Time-Dependent Failure of Rocks Under Cyclic Loading, Tectonophysics, Vol. 79, pp. 279-296.
- Cristescu, N.D. and U. Hunsche, 1998, Time effects in rock mechanics, Wiley, Chichester; New York.
- Cristescu, N.D., H.R. Hardy, Jr., and R.O. Simionescu, Editors, 2002, Basic and applied salt mechanics: proceedings of the fifth Conference on Mechanical Behavior of Salt, MECASALT V, Bucharest, Romania, 1999, A.A. Balkema Publishers, Lisse (The Netherlands).
- Cruden, D.M., 1970, A theory of Brittle Creep in Rock under Uniaxial Comprssion, Journal of Geophysical Research, Vol. 75, No. 17, June, pp. 3431-42.
- Cruden, D.M., 1971a, The Form of the Creep Law for Rock Under Uniaxial Compression, Int. J. Rock Mech. Min.Sc., Vol. 8, pp. 105-126.
- Cruden, D.M., 1971b, Single-Increment Creep Experiments on Rock Under Uniaxial Compression, Int. J. Rock Mech. Min.Sc., Vol. 8, pp. 127-142.
- Cruden, D.M., 1974, The Static Fatigue of Brittle Rock Under Uniaxial Compression, Int. J. Rock Mech. Min. Sci. & Geomech. Abstr., Vol. 11, pp. 67-73.
- Cruden, D.M., 1983, Creep in brittle rock after an increment of uniaxial load, Canadian Geotechnical Journal, Vol. 20, pp. 836-839.
- Cruden, D.M., 1987, Discussion of Lajtai and Schmidtke, 1986, Rock Mechanics and Rock Engineering, Vol. 20, pp. 87-88.
- Dickin, E.A., 1973, Influence of Grain Shape and Size upon the Limiting Porosities of Sands, pp. 113 – 120, Evaluation of Relative Density and Its Role in Geotechnical Projects Involving Cohesionless Soils, ASTM STP 523, American Society for Testing and Materials, Philadelphia, Pa.
- Dowdeswell, Julian A., 1982, Scanning Electron Micrographs of Quartz Sand Grains From Cold Environments Examined Using Fourier Shape Analysis, Journal of Sedimentary Petrology, Vol. 52, No. 4, December, pp. 1315 – 1323.
- Dreyer, W., 1972, The Science of Rock Mechanics, Trans Tech Publications, Bay Village, Ohio.
- Dreyr, W., 1982, Underground Storage of Oil and Gas in Salt Deposits and other Non-Hard Rocks, Halsted Press, New York.
- Eerola, M. and M. Ylosjoki, 1970, The effect of particle shape on the friction angle of coarse-grained aggregates, Vol. 1, pp. 445-456, First international congress of the International Association of Engineering Geology, Paris, France.
- Ehrlich, Robert and Bernhard Weinberg, 1970, An exact method for characterization of grain shape, Journal of Sedimentary Petrology, Vol. 40, No. 1, pp. 205 – 212.
- Exadaktylos, G.E. and K.N. Kaklis, 2001, Applications of an explicit solution for the transversely isotropic disc compressed diametrically, Int. J. Rock Mech. Min. Sci., Vol. 38, pp. 227 – 243.
- Fairhurst, C., 1964, On the validity of the “Brazilian” test for brittle materials, Int. J. Rock Mech. Mining Sci., Vol. 1, pp. 535-546.
- Ferreira, P.J., M.G. Rasteiro, and M.M. Figueiredo, 1993, Influence of Shape on Particle Size Analysis, Particulate Science and Technology, Vol. 11, pp. 199 – 206.
- Franklin, J.A., J.M. Kemeny, and K.K. Girdner, 1996, Evolution of measuring systems: a review, pp. 47 – 52, Measurement of Blast Fragmentation, Proceedings of the Fragblast-5 Workshop on Measurement of Blast Fragmentation, Montreal, Quebec, Canada, August 1996, A.A. Balkema, Rotterdam/Brookfield.
- Gramberg, J., 1965, Axial Cleavage Fracturing, a Significant Process in Mining and Geology, Engineering Geology, Vol. 1, No. 1, pp. 31-72.
- Gramberg, J., 1989, A Non-Conventional View on Rock Mechanics and Fracture Mechanics, Published for the Commission of the European Communities by A.A. Balkema/Rotterdam/Brookfield.
- Hertz, Heinrich, 1881, Ueber die Beruhrung fester elastischer Korper (On the contact between solid elastic bodies), Journal fuer die reine und angewandte Mathematik, Vol. 92, pp. 156-171.
- Hills, D.A., D. Nowell, and A. Sackfield, 1993, Mechanics of elastic contacts, Butterworth-Heinemann Ltd., Oxford.
- Hiramatsu, Yoshio, and Oka, Yukitoshi, 1970, Disc Test, Ring Test, Rectangular Plate Test and Irregular Specimen Test for Determining the Tensile Strength of Rocks, Paper 3-29, pp. 199-206, Vol. II, Proceedings of the Second Congress of the International Society for Rock Mechanics, Beograd, Jugoslavia.
- Hoek, E., and E.T. Brown, 1980, Underground Excavations in Rock, The Institution of Mining and Metallurgy, London.
- Hogg, R., M.L. Turek, and E. Kaya, 2004, The Role of Particle Shape in Size Analysis and the Evaluation of Comminution Processes, Particulate Science and Technology, Vol. 22, pp. 355 – 366.
- Holubec, I. and E. D’Appolonia, 1973, Effect of Particle Shape on the Engineering Properties of Granular Soils, pp. 304 – 318, Evaluation of Relative Density and Its Role in Geotechnical Engineering Involving Cohesionless Soils, ASTM STP 523, American Society for Testing and Materials, Philadelphia, Pa.
- Hondros, G., 1959, The Evaluation of Poisson’s Ratio and the Modulus of Materials of a Low Tensile Resistance by the Brazilian (Indirect Tensile) Test with Particular Reference to Concrete, Australian Journal of Applied Science, Vol. 10, pp. 243 – 268.
- Hooper, J.A., 1971, The Failure of Glass Cylinders in Diametral Compression, J. Mech. Phys. Solids, Vol. 19, pp. 179 – 200.
- Hudson, J.A. and E.T. Brown, 1973, Studying Time-Dependent Effects in Failed Rock, pp. 25-34, Proceedings, New Horizons in Rock Mechanics, Proceedings, Fourteenth Symposium on Rock Mechanics, ASCE, New York.
- Hudson, J.A.., E.T. Brown, and F. Rummel, 1972, The controlled failure of rock discs and rings loaded in diametrical compression, Int. J. Rock Mech. Min. Sci., Vol. 9, pp. 241-248.
- Hudyma, Nick, 2001, Influence of Lithophysal Porosity on Stress-Strain Properties of Topopah Spring Tuff – Numerical Analysis, Document MOD-01-003 Revision 0, https://hrc.nevada.edu/QA/Report/MOD-01-003.pdf.
- Hudyma, N., B. Avar, and M. Karakouzian, 2004, Compressive strength and failure modes of lithophysae-rich Topopah Spring Tuff specimens and analog models containing cavities, Engineering Geology, Vol. 73, pp. 179-190.
- Hundal, H.S., S. Rohani, H.C. Wood, and M.N. Pons, 1997, Particle shape characterization using image analysis and neural networks, Powder Technology, Vol. 91, pp. 217 – 227.
- Jaeger, J.C. and N.G.W. Cook, 1979, Fundamentals of Rock Mechanics, A Halsted Press Book, Chapman and Hall, London.
- Jakus, K., D.C. Coyne, and J.E. Ritter, Jr., 1978, Analysis of fatigue data for lifetime predictions for ceramic materials, Journal of Materials Science, Vol. 13, pp. 2071 – 2080.
- Kaiser, P.K. and N.R. Morgenstern, Phenomenological Model for Rock with Time-Dependent Strength, pp. 153 – 165, Int. J. Rock Mech. Min. Sci. & Geomech. Abstr., Vol. 18.
- Kawamoto, Toshikazy and Toshiaki Saito, 1974, The Behavior of Rock-Like Materials in some controlled strain rates, pp. 161 – 166, Vol. II, Part A, Advances in Rock Mechanics, Reports of Current Research, Proceedings of the Third Congress of the International Society for Rock Mechanics, Denver, CO, Natio
nal Academy of Sciences, Washington, D.C. - Kie, Tan Tjong, 1993, The Importance of Creep and Time-dependent Dilatancy, as Revealed from Case Records in China, Chapter 31, pp. 709 – 744, Comprehensive Rock
- Engineering, John A. Hudson, Editor-in-Chief, Vol. 3, Rock Testing and Site Characterization, John A. Hudson, Volume Editor, Pergamon Press, Oxford.
- Kranz, Robert L., 1979, Crack Growth and Development During Creep of Barre Granite, Int. J. Rock mech. Min. Sci. & Geomech. Abstr., Vol. 16, pp. 23-35.
- Kranz, Robert L., 1980, The Effects of Confining Pressure and Stress Difference on Static Fatigue of Granite, Journal of Geophysical Research, Vol. 85, No. B4, April 10, pp. 1854-1866.
- Krumbein, W.C., 1941, Measurement and Geological Significance of Shape and Roundness of Sedimentary Particles, Journal of Sedimentary Petrology, Vol. 11, No. 2, pp. 64 – 72.
- Krumbein, W.C., and L.L. Sloss, 1963, Stratigraphy and Sedimentation, Second Edition, W.H. Freeman and Company, San Francisco.
- Kwan, A.K.H., C.F. Mora, and H.C. Chan, 1999, Particle shape analysis of coarse aggregate using digital image processing, Cement and Concrete Research, Vol. 29, pp. 1403 – 1410.
- Lajtai, E.Z. and L.P. Bielus, 1986, Stres Corrosion Cracking of Lac du Bonnet Granite in Tension and Compression, Rock Mechanics and Rock Engineering, Vol. 19, pp. 71-87.
- Lajtai, E.Z. and R.H. Schmidtke, 1986, Delayed Failure in Rock Loaded in Uniaxial Compression, Rock Mechanics and Rock Engineering, Vol. 19, pp. 11-25.
- Lajtai, E.Z. and R.H. Schmidtke, 1987, Authors’ Reply to Cruden, 1987, Rock Mechanics and Rock Engineering, Vol. 20, pp. 88-89.
- Lubkin, J.L., 1962, Contact Problems, Ch. 42, Handbook of Engineering Mechanics, W. Flugge, Editor, McGraw-Hill Book Company, Inc., New York.
- Ma, Lumin, 2004, Experimental Investigation of Time Dependent Behavior of Welded Topopah Spring Tuff, Ph.D. Dissertation, Geo-Engineering, University of Nevada, Reno.
- Ma, L. and J. Daemen, 2004, Time Dependent Mechanical Behavior of Welded Tuff, Part 2, Final Technical Report, Prepared for U.S. DOE/UCCSN Cooperative Agreement DE-FC28-98NV12081, Document ID: TR-03-018, University of Nevada, Reno.
- MacLeod, N., 2002, Geometric morphometrics and geological shape-classification systems, Earth-Science Reviews, Vol. 59, pp. 27 – 47.
- Maerz, Norbert H., 2004, Technical and Computational Aspects of the Measurement of Aggregate Shape by Digital Image Analysis, journal of Computing in Civil Engineering, Vol. 18, No.1, January 1, pp. 10 – 18.
- Martin, R.J., J.S. Noel, P.J. Boyd, and R.H. Price, 1997, Creep and Static Fatigue of Welded tuff from Yucca Mountain, Nevada, Int. J. Rock Mech. & Min. Sci., Vol. 34, No. 3-4, Paper No. 190.
- Martin, R.J., III, R.H. Price, P.J. Boyd, and J.S. Noel, 1993, The Influence of Strain Rate and Sample Inhomogeneity on the Moduli and Strength of Welded Tuff, pp. 1507-1510, Int. J. Rock Mech. Min. Sci. & Geomech. Abstr., Vol. 30, No. 7.
- Mellor, Malcolm, and Ivor Hawkes, 1971, Measurement of Tensile Strength by Diametral Compression of Discs and Annuli, Engineering Geology, Vol. 5, pp. 173-225.
- Meloy, T.P., 1977, Fast Fourier Transforms Applied to Shape Analysis of Particle Silhouettes to obtain Morphological Data, Powder Technology, Vl. 17, pp. 27 – 35.
- Meloy Thomas P. and Nigel N. Clark, 1986, Fourier Analysis: A computer based approach for particle shape characterization, Proceedings of the Third Conference on the Use of Computers in the Coal Industry, Morgantown, WV, July 1986, Y.J. Wang, R.Larry Grayson, and Richard L. Sanford, Editors, A.A. Balkema, Rotterdam/Boston.
- Mirza, M. Waseem, Richard A. Graul, Jonathan L. Groeger, and Aramis Lopez, 1997, Theoretical Evaluation of Poisson’s Ratio and Elastic Modulus Using Indirect Tensile Test with Emphasis on Bituminous Mixtures, Transportation Research Record No. 1590, pp. 34 – 44, Transportation Research Board, National Academy Press, Washington, D.C.
- Muskhelishvili, N.I., 1963, Some basic problems of the mathematical theory of elasticity, P. Noordhoff, Groningen, The Netherlands.
- Novak, J.W. Jr., and J.R. Thompson, 1986, Extending the Use of Particle Sizing Instrumentation to Calculate Particle Shape Factors, Powder Technology, Vol. 45, pp. 159 – 167.
- Olsson, W.A., 1991, Compressive strength of tuff as a function of strain rate from 10-6 to 103 /sec, International Journal of Rock Mechanics and Minng Sciencess & Geomechanics Abstracts, Vol. 28, No. 1, January, pp. 115 – 118.
- Pan, Y.-W., and B.-H. Wen, 2001, Constitutive model for the continuous damage of brittle rock, Géotechnique, Vol. LI, No. 2, pp. 155 – 159.
- Podczeck, Fridrun, 1997, A shape factor to assess the shape of particles using image analysis, Powder Technology, Vol. 93, pp. 47 – 53.
- Price, Neville J., 1966, Fault and Joint Development in Brittle and Semi-Brittle Rock, Pergamon Press, Oxford.
- Price, R.H., and S.J. Bauer, 1985, Analysis of the elastic and strength properties of Yucca Mountain tuff, Nevada, pp. 89 – 96, Vol. 1, Research & Engineering Applications in Rock Masses, Proceedings of the 26th U.S. Symposium on Rock Mechanics, South Dakota School of Mines & Technology, June 1985, Eileen Ashworth, Editor, A.A. Balkema/Rotterdam/Boston.
- Price, R.H., P.J. Boyd, J.S. Noel & R.J. Martin III, 1994, Relationship between static and dynamic rock properties in welded and nonwelded tuff, pp. 505 – 512, Rock Mechanics Models and Measurements Challenges from Industry, Proceedings of the 1st North American Rock Mechanics Symposium, The University of Texas at Austin, June 1994, Priscilla P. Nelson and Stephen E. Laubach, Editors, A.A. Balkema/Rotterdam/Brookfield.
- Primel, Luis and Claude Tourenq, Editors, 2000, Aggregates, A.A. Balkema, Rotterdam/Brookfield.
- Ray, S.K., M. Sarkar, and T.N. Singh, 1999, Effect of cyclic loading and strain rate on the mechanical behavior of sandstone, pp. 543-549, Int. Journal of Rock Mechanics and Mining Sciences, Vol. 36.
- Rittenhouse, Gordon, 1943, A Visual Method of Estimating Two-Dimensional Sphericity, Journal of Sedimentary Petrology, Vol. 13, No. 2, pp. 79-81.
- Rosen, Howard N., and Hugh M. Hulburt, 1970, Size Analysis of Irregular Shaped Particles in Sieving, Ind. Eng. Chem. Fundam., Vol. 9, No. 4, pp. 658 – 661.
- Rudnick, A., A.R. Hunter, and F.C. Holden, 1963, An Analysis of the Diametral-Compression Test, Materials research and standards, Vol. 3, Issue 4, April, pp. 283-289.
- Saada, Adel S., 1993, Elasticity Theory and Applications , Second Edition, Krieger Publishing Company, Malabar, Florida.
- Sayles, R.S., G.M.S. deSilva, J.A. Leather, J.C. Anderson and P.B. Macpherson, 1981, Elastic conformity in Hertzian contacts, Tribology international, Vol. 14, Issue 6, December, pp. 315-322.
- Schmidtke, R.H. and E.Z. Lajtai, 1985, The Long-Term Strength of Lac du Bonnet Granite, Int. J. Rock Mech. Min. Sci. & Geomech. Abstr., Vol. 22, No. 6, pp. 461-465.
- Schwartz, Jeremy and Edward Y. Harper, 1971, On the relative approach of two-dimensional elastic bodies in contact, Int. J. Solids Structures, vol. 7, pp. 1613-1626.
- Schwarz, H. and H.E. Exner, 1980, The Implementation of the Concept of Fractal Dimension on a Semi-Automatic Image Analyser, Powder Technology, vol. 27, pp. 207 – 213.
- Shigley, Joseph Edward, 1986, Mechanical Engineering Design, Mc-Graw-Hill Book Company, New York.
- Singh, D.P., V.R. Sastry & P. Srinivas, 1989, Effect of strain rae on mechanical behaviour of rocks, pp. 109 – 114, Rock at Great Depth, Proceedings, V. Maury & D. Fourmaintraux, Editors, A.A. Balkema/Rotterdam/Brookfield.
- Smith, M.R. and L. Collis, Editors, 1993, Aggregates Sand, gravel and crushed rock aggregates for construction purposes, Second Edition, The Geological Society of London.
- Smith, M.R., and L. Collis, Edito
rs, 2001, Aggregates Sand, gravel and crushed rock aggregates for construction purposes, Third Edition, The Geological Society of London. - Sun, J., and Y.Y. Hu, 1997, Time-dependent Effect on the Tensile Strength of Saturated Granite at Three Gorges Project in China, Int. J. Rock Mech. Min. Sci., Vol. 34, No. ¾, p. 381, paper no. 306.
- Thomas, M.C., R.J. Wiltshire, and A.T. Williams, 1995, The use of Fourier descriptors in the classification of particle shape, Sedimentology, Vol. 42, pp. 635 – 645.
- Timoshenko, S., and J.N. Goodier, 1970, Theory of Elasticity, McGraw-Hill, New York.
- Vallejo, L.E., 1995, Fractal analysis of granular materials, Géotechnique, Vol. 45, No. 1, pp. 159-163.
- Vallerga, B.A., H.B. Seed, C.L. Monismith, and R.S. Cooper, 1957, Effect of Shape, Size, and Surface Roughness of Aggregate Particles on the Strength of Granular Materials, pp. 63 – 74, Road and Paving Materials, ASTM Special Publication No. 212, American Society for Testing Materials, Philadelphia, Pa.
- Vardar, Ö. and I. Finnie, 1975, An analysis of the Brazilian disk fracture test using the Weibull probabilistic treatment of brittle strength, Int. Jnl. of Fracture, Vol. 11, No.3, June, pp. 495 – 508.
- Wadell, Hakon, 1933, Sphericity and Roundness of Rock Particles, The Journal of Geology, Vol. LXI, No. 3, pp. 310 – 331.
- Wawersik, W.R., 1972, Time-Dependent Rock Behavior in Uniaxial Compression, pp. 85-106, New Horizons in Rock Mechanics, Proceedings, Fourteenth Symposium on Rock Mechanics, held at The Pennsylvania State University, University park, Pennsylvania, H.R. Hardy, Jr. and R. Stefanko, Editors, published by American Society of Civil Engineers, New York, N.Y., 1973.
- Wettimuny, Ramitha and Dayakar Penumadu, 2004, Application of Fourier Analysis to Digital Imaging for Particle Shape Analysis, Journal of Computing in Civil Engineering, Vol. 18, No.1, January 1, pp. 2 – 9.
- Wu, H. and D.D. Pollard, 1993, Effect of Strain Rate on a Set of Fractures, Int. J. Rock Mech. Min. Sci. & Geomech. Abstr., Vol. 30, No. 7, pp. 869-872.
- Yegulalp, T.M., and K. Kim, 1993, Statistical assessment of scale effect on rock properties using the theory of extremes, Transactions of Society of Mining, Metallurgy, and Exploration, Inc., Vol. 294, pp. 1834 – 1837.
1.1 Summary of Results
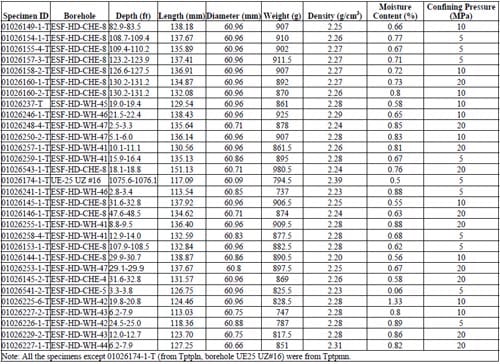
Table 1.1 – Source Information of Specimens for Triaxial Tests
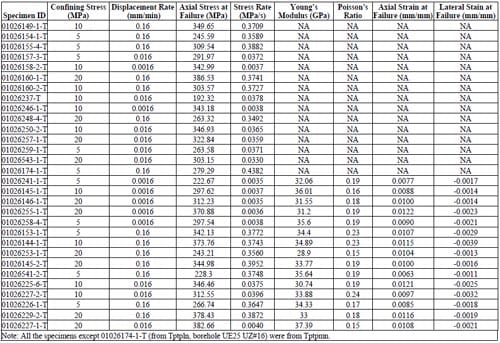
Table 1.2 – Results of Triaxial Tests
1.2 Force-Displacement Graphs
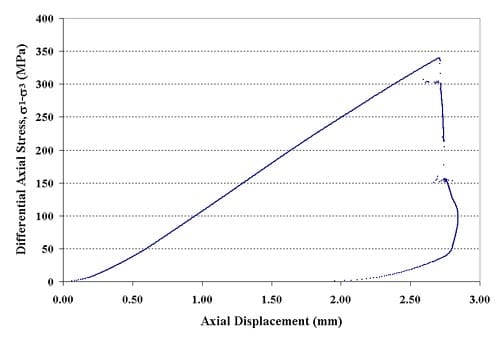
Figure 1.2.1 – Axial force-axial displacement curve for Specimen 01026149-1-T, Confining pressure = 10 MPa, Axial stress at failure= 349.65 MPa, Displacement rate = 0.16 mm
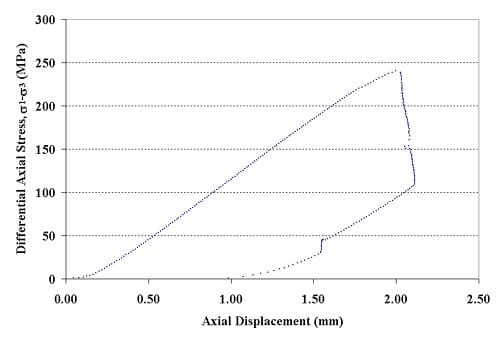
Figure 1.2.2 – Axial force-axial displacement curve for specimen 01026154-1-T, Confining pressure = 5MPa, Axial stress at failure = 245.59 MPa, Displacement rate = 0.16 mm
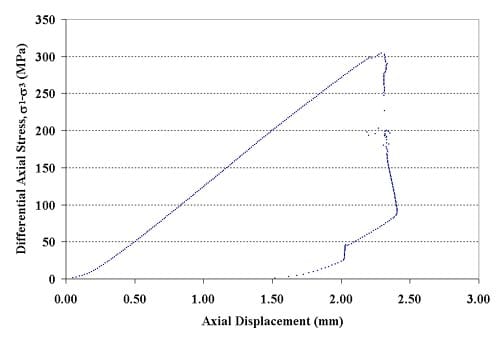
Figure 1.2.3 – Axial force-axial displacement curve for specimen 01026155-4-T, Confining pressure = 5 MPa, Axial stress at failure = 309.54 MPa, Displacement rate = 0.16 mm
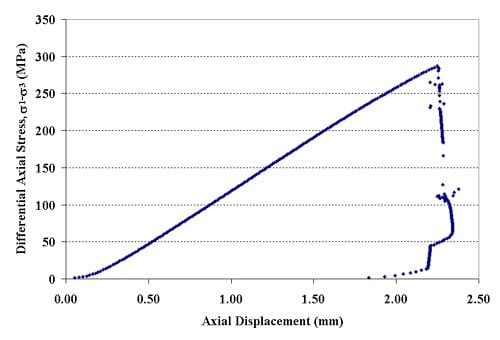
Figure 1.2.4 – Axial force-axial displacement curve for specimen 01026157-3-T, Confining pressure = 5 MPa, Axial stress at failure = 291.97 MPa, Displacement rate = 0.016 mm
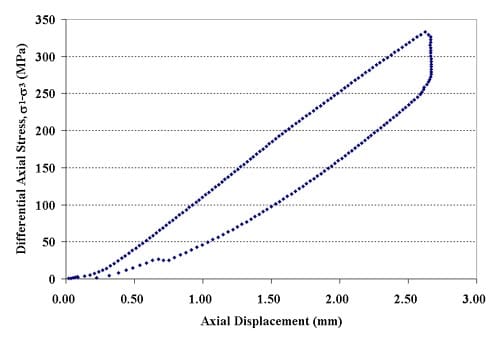
Figure 1.2.5 – Axial force-axial displacement curve for specimen 01026158-2-T, Confining pressure = 10 MPa, Axial stress at failure = 342.99 MPa, Displacement rate = 0.0016 mm
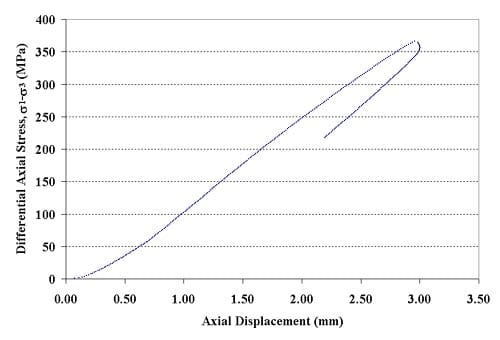
Figure 1.2.6 – Axial force-axial displacement curve for specimen 01026160-1-T, Confining pressure = 20 MPa, Axial stress at failure = 386.53 MPa, Displacement rate = 0.16 mm
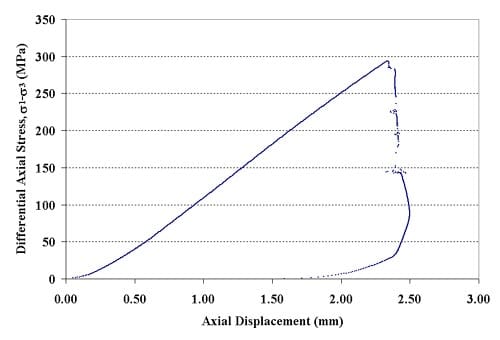
Figure 1.2.7 – Axial force-axial displacement curve for specimen 01026160-2-T, Confining pressure = 10 MPa, Axial stress at failure = 303.57 MPa, Displacement rate = 0.16 mm
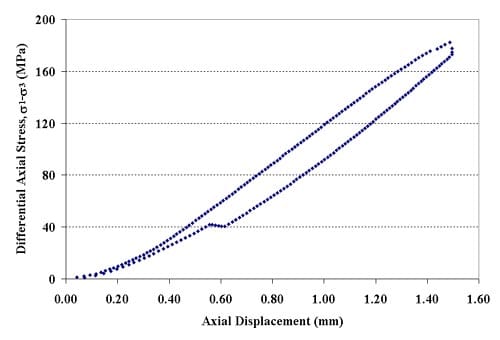
Figure 1.2.8 – Axial force-axial displacement curve for specimen 01026237-T, Confining pressure = 10 MPa, Axial stress at failure = 192.32 MPa, Displacement rate = 0.016 mm
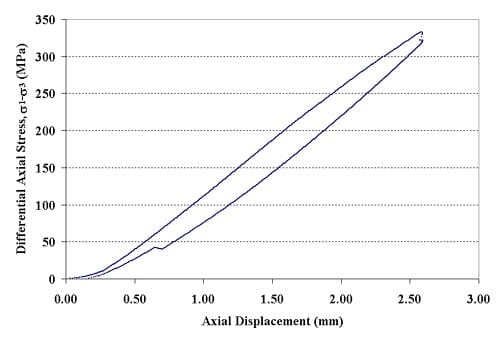
Figure 1.2.9 – Axial force-axial displacement curve for specimen 01026246-1-T, Confining pressure = 10 MPa, Axial stress at failure = 343.18 MPa, Displacement rate = 0.0016 mm
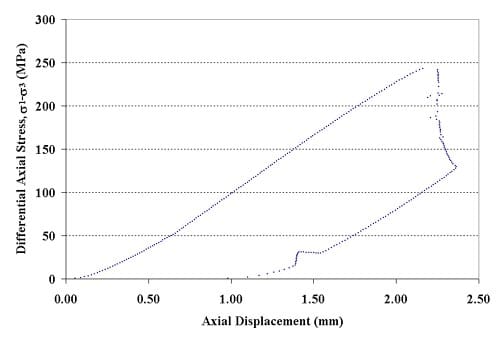
Figure 1.2.10 – Axial force-axial displacement curve for specimen 01026248-4-T, Confining pressure = 20 MPa, Axial stress at failure = 263.32 MPa, Displacement rate = 0.16 mm
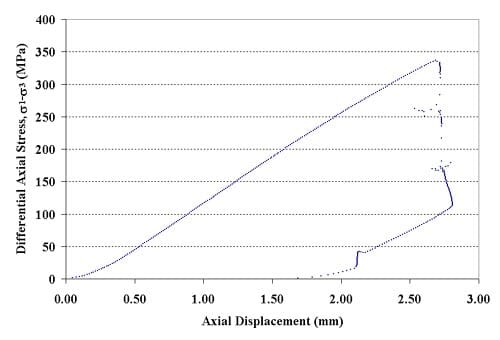
Figure 1.2.11 – Axial force-axial displacement curve for specimen 01026250-2-T, Confining pressure = 10 MPa, Axial stress at failure = 346.93 MPa, Displacement rate = 0.016 mm
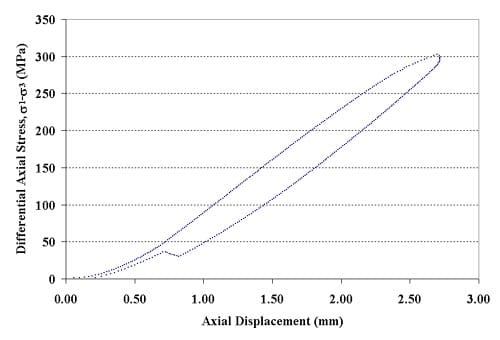
Figure 1.2.12 – Axial force-axial displacement curve for specimen 01026257-1-T, Confining pressure = 20 MPa, Axial stress at failure = 322.84 MPa, Displacement rate = 0.016 mm
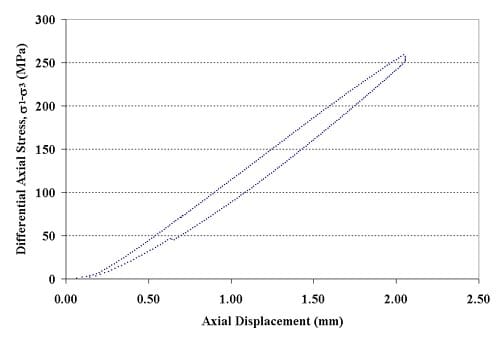
Figure 1.2.13 – Axial force-axial displacement curve for specimen 01026259-1-T, Confining pressure = 5 MPa, Axial stress at failure = 263.58 MPa, Displacement rate = 0.016 mm
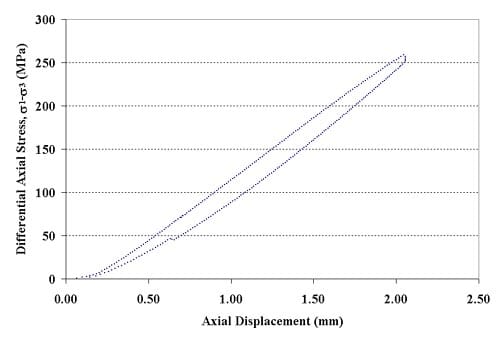
Figure 1.2.14 – Axial force-axial displacement curve for specimen 01026543-1-T, Confining pressure = 20 MPa, Axial stress at failure = 303.15 MPa, Displacement rate = 0.016 mm
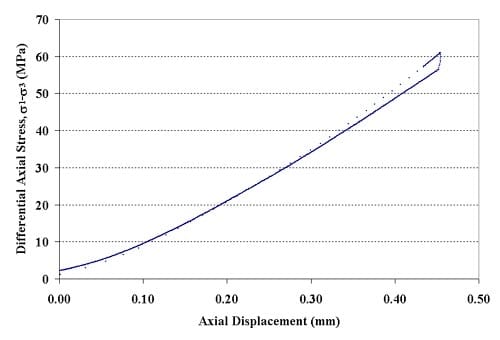
Figure 1.2.15 – Axial force-axial displacement curve for specimen 01026174-1-T, Confining pressure = 5 MPa, Axial stress at failure= 279.29 MPa, Displacement rate = 0.16 mm
1.3 Stress-Strain Graphs
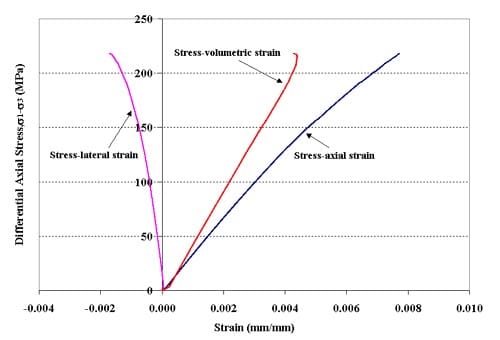
Stress-strain curves for specimen 01026241-1-T, Confining pressure = 5 MPa, Axial stress at failure = 222.67 MPa, Stress rate = 0.0035 MPa/s
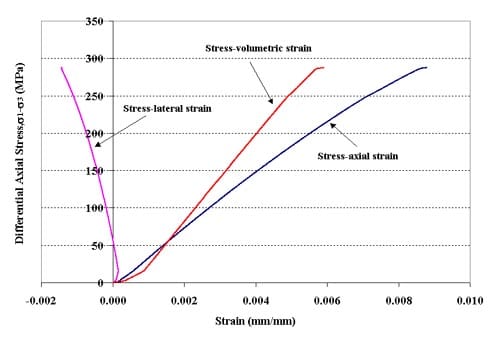
Stress-strain curves for specimen 01026145-1-T, Confining pressure = 10 MPa, Axial stress at failure = 297.62 MPa, Stress rate = 0.0037 MPa/s
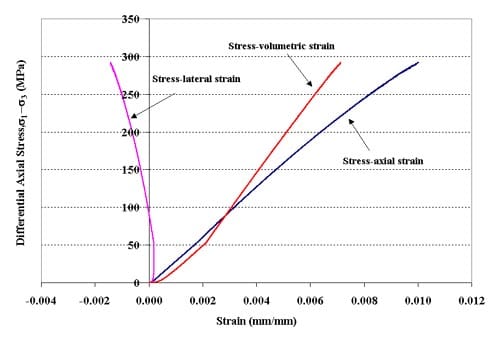
Figure 1.3.3 – Stress-strain curves for specimen 01026146-1-T, Confining pressure = 20 MPa, Axial stress at failure = 312.23 MPa, Stress rate = 0.0035 MPa/s
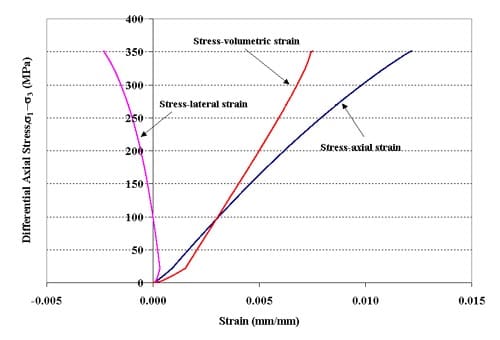
Figure 1.3.4 – Stress-strain curves for specimen 01026255-1-T, Confining pressure = 20 MPa, Axial stress at failure = 370.88 MPa, Stress rate = 0.0036 MPa/s
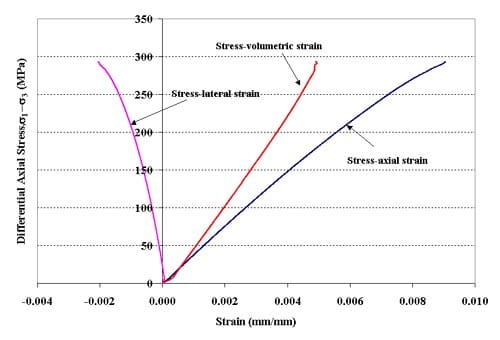
Figure 1.3.5 – Stress-strain curves for specimen 01026258-4-T, Confining pressure = 5 MPa, Axial stress at failure = 297.54 MPa, Stress rate = 0.0038 MPa/s
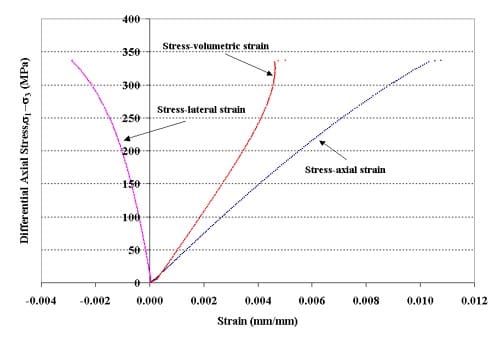
Figure 1.3.6 – Stress-strain curves for specimen 01026153-1-T, Confining pressure = 5 MPa, Axial stress at failure = 342.13 MPa, Stress rate = 0.3772 MPa/s
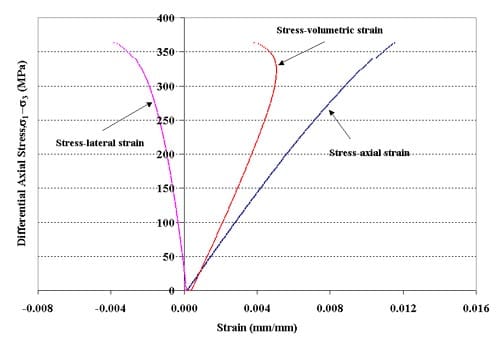
Figure 1.3.7 – Stress-strain curves for specimen 01026144-1-T, Confining pressure = 10 MPa, Axial stress at failure = 373.76 MPa, Stress rate = 0.3743 MPa/s
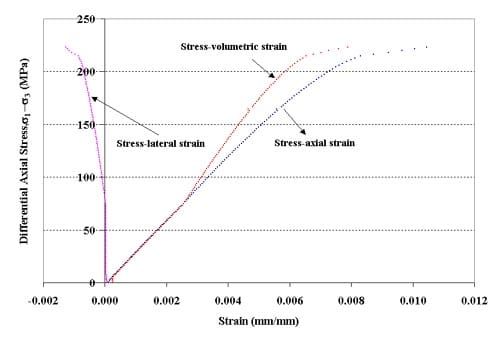
Figure 1.3.8 – Stress-strain curves for specimen 01026253-1-T, Confining pressure = 20 MPa, Axial stress at failure = 243.21 MPa, Stress rate = 0.3560 MPa/s
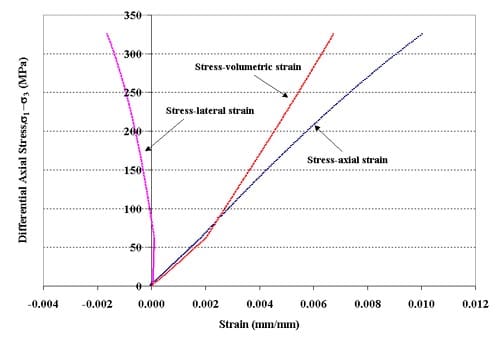
Figure 1.3.9 – Stress-strain curves for specimen 01026145-2-T, Confining pressure = 20 MPa, Axial stress at failure = 344.98 MPa, Stress rate = 0.3952 MPa/s
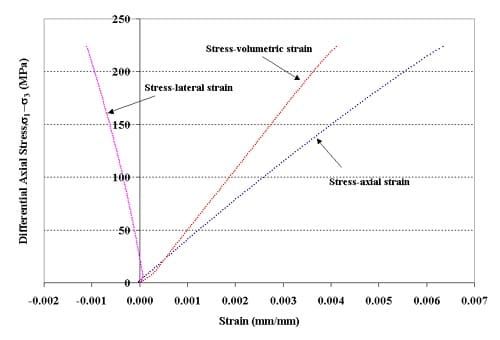
Figure 1.3.10 – Stress-strain curves for specimen 01026541-2-T, Confining pressure = 5 MPa, Axial stress at failure = 228.3 MPa, Stress rate = 0.3748 MPa/s
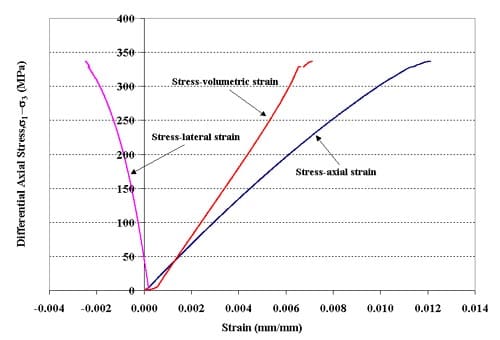
Figure 1.3.11 – Stress-strain curves for specimen 01026225-6-T, Confining pressure = 10 MPa, Axial stress at failure = 346.46 MPa, Stress rate = 0.0375 MPa/s
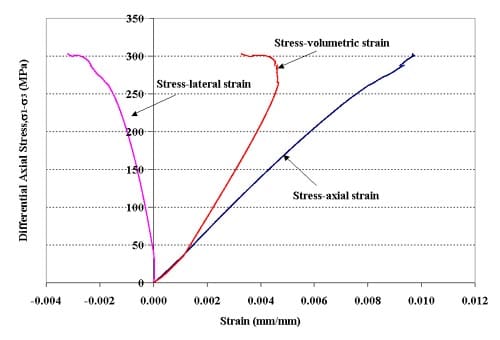
Figure 1.3.12 – Stress-strain curves for specimen 01026227-2-T, Confining pressure = 10 MPa, Axial stress at failure = 312.55 MPa, Stress rate = 0.0396 MPa/s
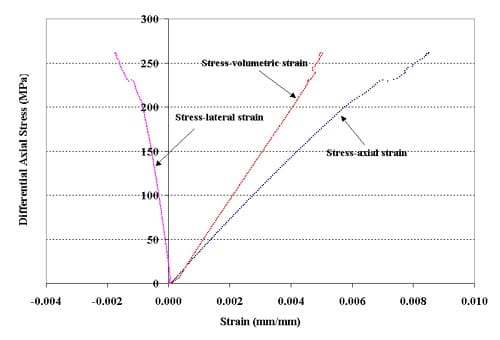
Figure 1.3.13 – Stress-strain curves for specimen 01026226-1-T, Confining pressure = 5 MPa, Axial stress at failure = 266.74 MPa, Stress rate = 0.3647 MPa/s
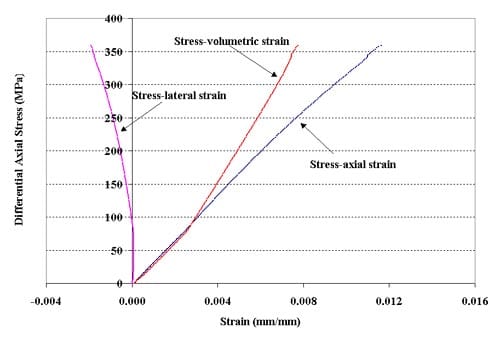
Figure 1.3.14 – Stress-strain curves for specimen 01026229-2-T, Confining pressure = 20 MPa, Axial stress at failure = 378.43 MPa, Stress rate = 0.3872 MPa/s
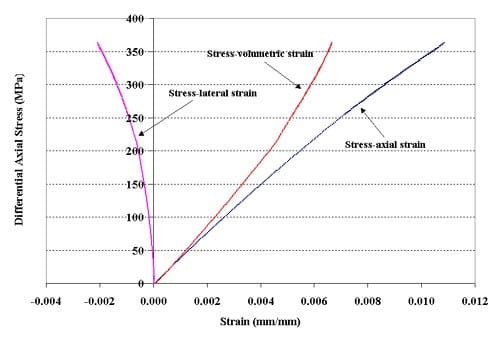
Figure 1.3.15 – Stress-strain curves for specimen 01026227-1-T, Confining pressure = 20 MPa, Axial stress at failure = 382.66 MPa, Stress rate = 0.0040 MPa/s
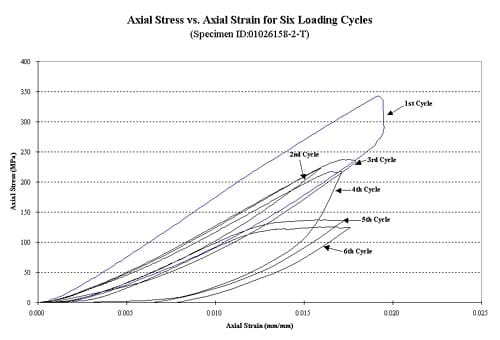
Figure 1.3.16 – Axial stress vs. axial strain for six loading cycles, specimen ID 01026158-2-T, the confining pressure for these tests was 10 MPa
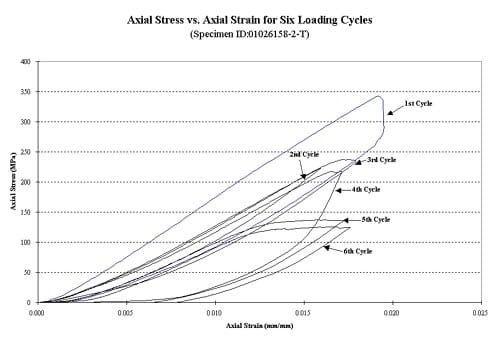
Figure 1.3.17 – Axial stress vs axial strain for six loading cycles, specimen ID 01026174-1-T, the confining pressure for these tests was 5 MPa
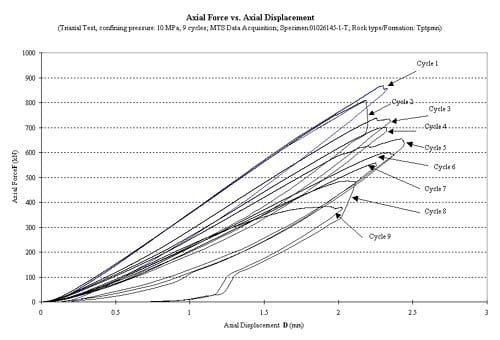
Figure 1.3.18 – Axial force vs axial displacement for six loading cycles, specimen ID 01026145-1-T, the confining pressure for these tests was 10 MPa
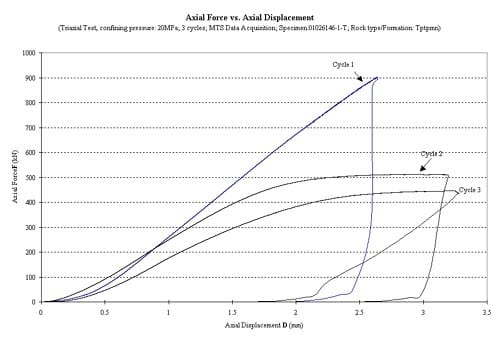
Figure 1.3.19 – Axial force vs axial displacement for six loading cycles, specimen ID 01026146-1-T, the confining pressure for these tests was 20 MPa
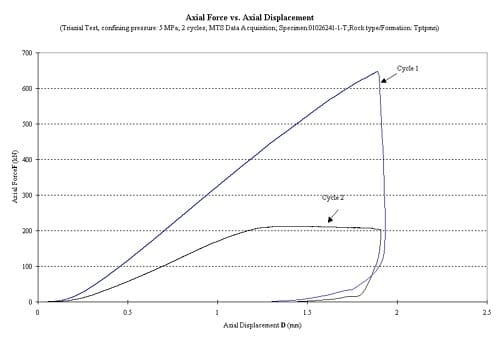
Figure 1.3.20 – Axial force vs axial displacement for six loading cycles, specimen ID 01026241-1-T, the confining pressure for these tests was 5 MPa
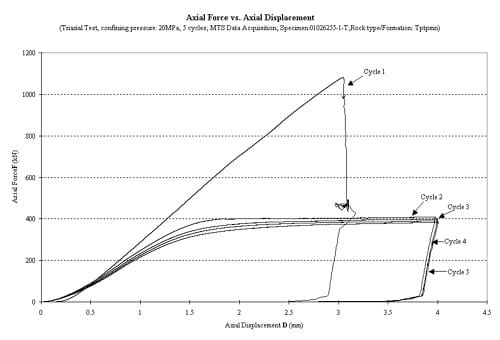
Figure 1.3.21 – Axial force vs axial displacement for six loading cycles, specimen ID 01026255-1-T, the confining pressure for these tests was 20 MPa
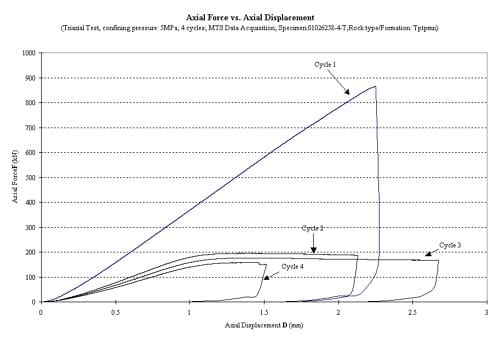
Figure 1.3.22 – Axial force vs axial displacement for six loading cycles, specimen ID 01026258-4-T, the confining pressure for these tests was 5 MPa
1.4 Failure Envelopes
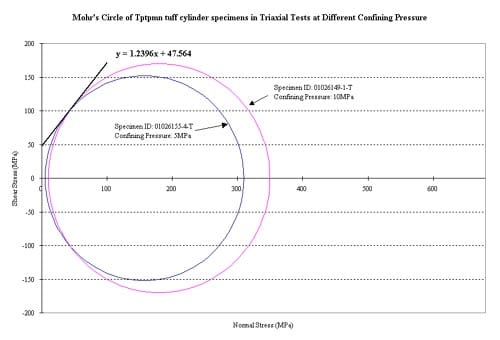
Figure 1.4.1 – Strength envelope
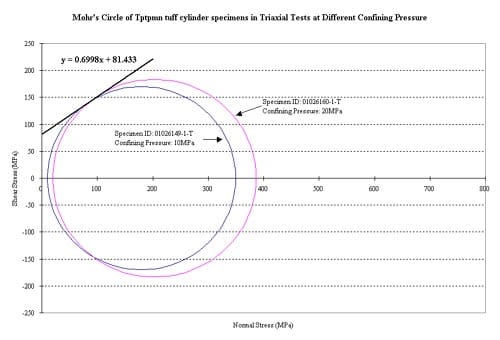
Figure 1.4.2 – Strength envelope
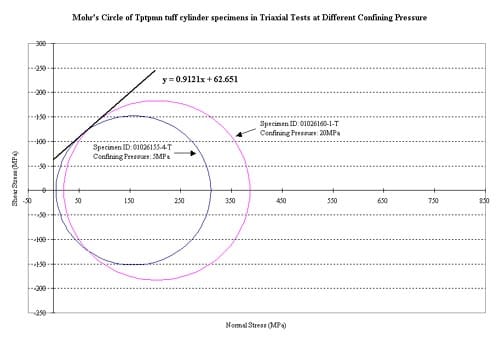
Figure 1.4.3 – Strength envelope
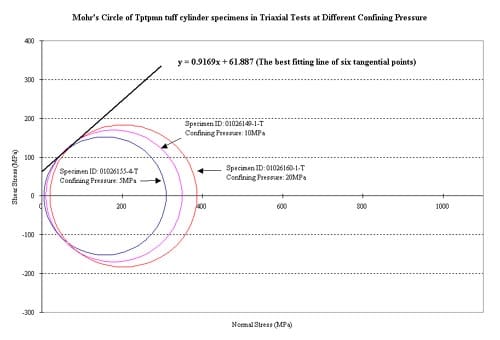
Figure 1.4.4 – Strength envelope
1.5 Specimen Photographs
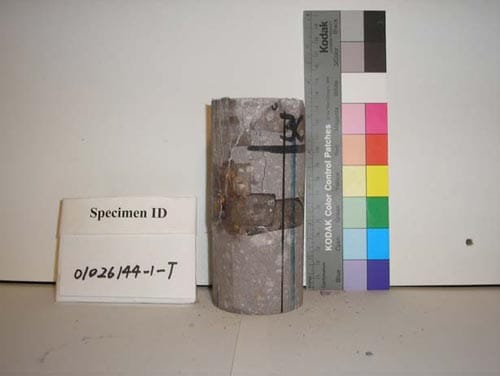
Figure 1.5.1 – Specimen after triaxial test, specimen ID 01026144-1-T
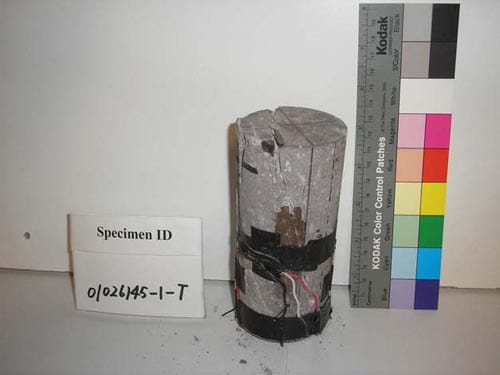
Figure 1.5.2 – Specimen after triaxial test, specimen ID 01026145-1-T
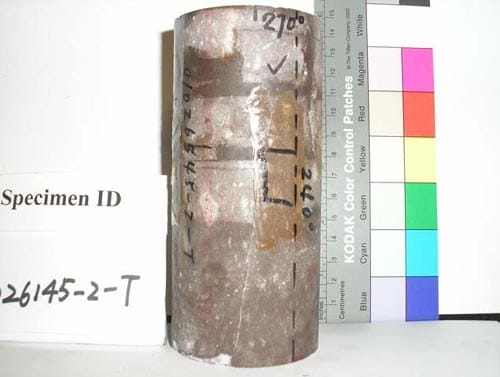
Figure 1.5.3 – Specimen after triaxial test, specimen ID 01026145-2-T
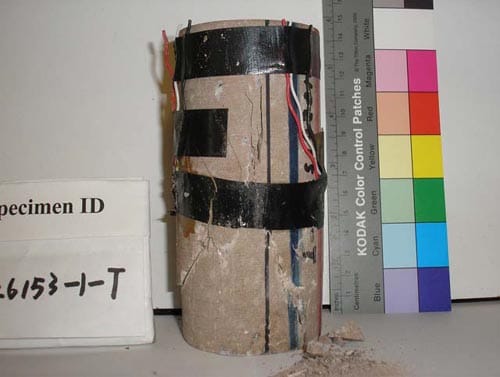
Figure 1.5.4 – Specimen after triaxial test, specimen ID 01026153-1-T
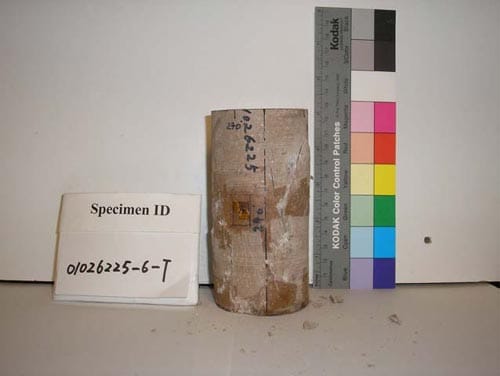
Figure 1.5.5 – Specimen after triaxial test, specimen ID 01026225-6-T
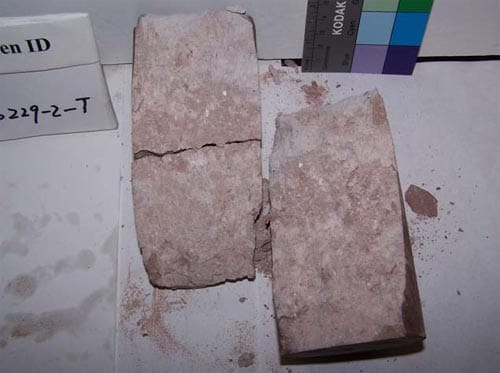
Figure 1.5.6 – Specimen after triaxial test, specimen ID 01026229-2-T
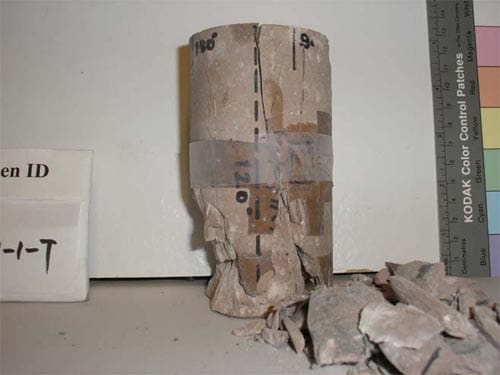
Figure 1.5.7 – Specimen after triaxial test, specimen ID 01026241-1-T
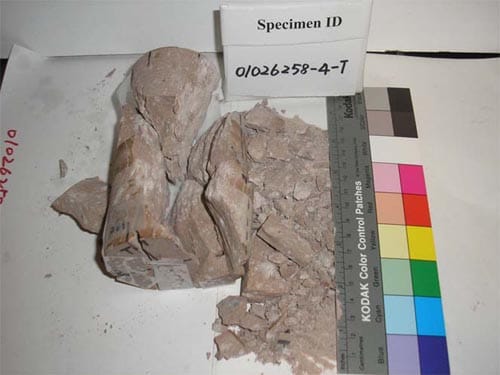
Figure 1.5.8 – Specimen after t
riaxial test, specimen ID 01026258-4-T
Appendix 2 – Indirect Tensile Splitting “Brazilian” Tests
2.1 Summary of results
By Feb. 17th, 2006, all together 111 indirect tensile splitting (“Brazilian”) tests were performed. Among them, there are 99 valid tests, which mean the primary fracture of these tests is diametrical or nearly diametrical. The maximum tensile strength is 23.69 MPa, the minimum tensile strength is 7.71MPa, and the average tensile strength is 16.45MPa.
Most of the specimens used in these tests are with the diameter of approximate 60.96 mm, some smaller ones with diameter of approximate 44.96 mm were also used.
The specimen characteristics of valid tests and corresponding test results are summarized in Table 2.1.
2.2 The influence factors of tensile strength
From table 2.1 we can see that the tensile strength is very scattering. This is caused by multi -factors. The main influence factors are summarized as follows:
2.2.1 Geological formations
All the specimens are from the two geological formations: Topopah Spring crystal-poor middle nonlithphysal zone (Tptpmn) and Topopah Spring crystal-poor lower nonlithphysal zone (Tptpln). It seems that the rock cores from the different formations are made up from the different grains, and their appearances are much different, see Fig. 2.1 and 2.2. According to test results, their strength is also different: for specimens from Tptpmn formations, the mean tensile strength is 17.03 MPa, which is 21.7% higher than that of the ones from Tptpln (13.99 MPa).
2.2.2 Flaws
Here flaws mainly refer to a kind of special weak spot in specimen: the vapor-phase altered spot, which is a region of tuff matrix altered by gases in the early stage of tuff emplacement and is common in Yucca mountain tuffs. The flaw’s influence on tensile strength mainly depends on two aspects:
1) Flaw quantity
Because the vapor-phase altered spots have lower density, the density of specimen will decreased along with the increasing of the flaws. Thus we can use the average density of the specimen as the indicator of the quantity of the flaws. In order to find the influence of the flaw quantity on tensile strength, the specimen tensile strength-density distribution plot was generated and the trend line was added (See Figure 2.3).
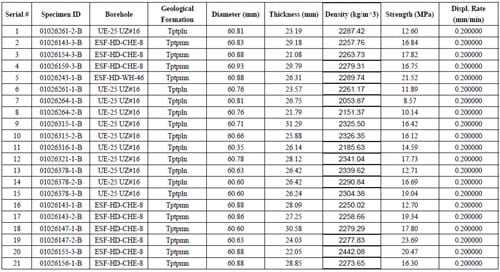
Table 2.1 – Brazilian test samples, source, rock type, geometry, density, strength and imposed test machine displacement rate
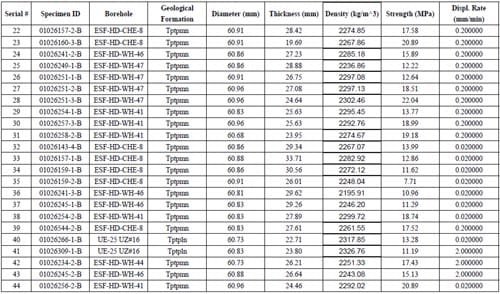
Table 2.1 – Brazilian test samples, source, rock type, geometry, density, strength and imposed test machine displacement rate
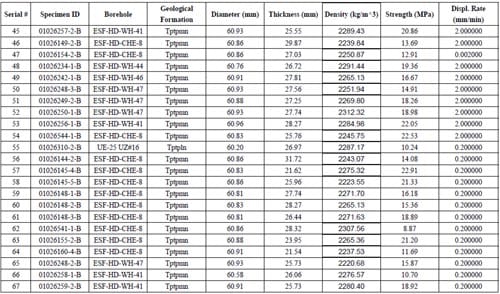
Table 2.1 – Brazilian test samples, source, rock type, geometry, density, strength and imposed test machine displacement rate
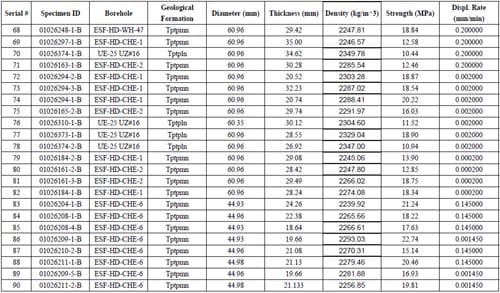
Table 2.1 – Brazilian test samples, source, rock type, geometry, density, strength and imposed test machine displacement rate

Table 2.1 – Brazilian test samples, source, rock type, geometry, density, strength and imposed test machine displacement rate
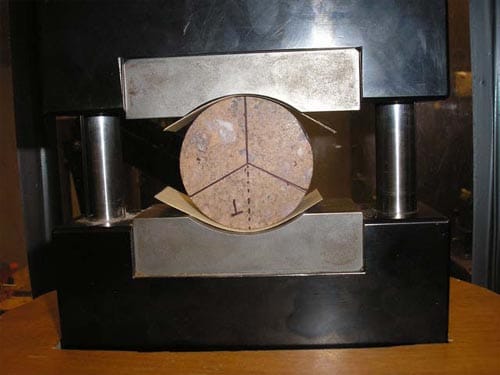
Fig. 2.1 Brazilian test arrangement (specimen diameter = 44.96 mm)
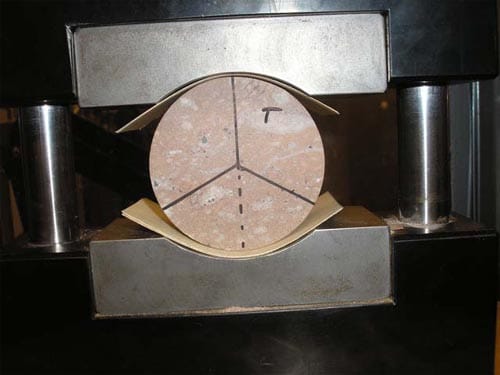
Fig.2.2 Brazilian test arrangement (specimen diameter = 60.96 mm)
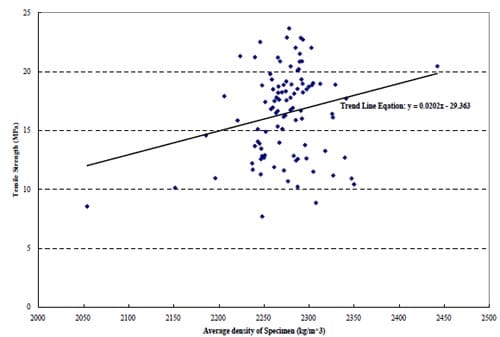
Fig. 2.3
From figure 2.3 we can see that the tensile strength increases along with the decreasing of the quantity of the vapor-phase altered spots (or: the increasing of the average density).
2) The location of flaws
If flaws are not along the loaded diameter, the specimen’s mechanical characteristics will not be symmetrical, so the fracture of the specimen is no longer diametrical. This is a possible reason why most of the specimens’ fracture is not exactly diametrical. If the fracture deviates from the center too much, the test will be invalid (see fig. 2.4). In the example in Fig. 2.2.4 it seems probable that the primary fracture has initiated in the vapor altered spot just to the right off center, and then has propagated along a tensile principal stress trajectory. The reported numerical value of the tensile strength probably more appropriately should be considered as a lower bound to the tensile strength? A “corrected” value could be obtained by estimating, preferably measuring, the location of the trajectory and adjusting the estimated strength accordingly. For example in Fig. 2.2.4, estimating that the primary fracture is at 0.36 R from the center, and using the (point load) stress contours in Hooper (1971, Fig. 8), we estimate the stress at the (assumed) initiation point along the horizontal diameter to have been 60% of the maximum tensile stress (at the center of the disk, horizontal).
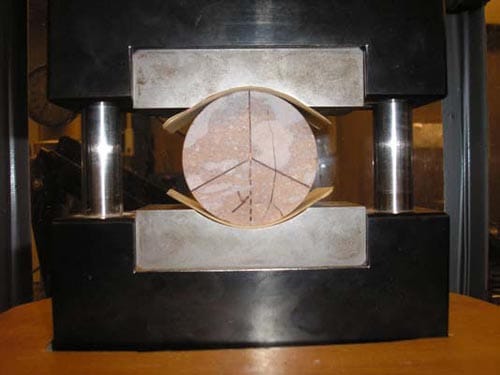
Fig. 2.4
If flaws are located on the loading diameter, they may significantly decrease the tensile strength. For example, the specimen 01026159-2-B has the lowest tensile stress (7.71MPa) of all samples, and there is an obvious flaw on the loading diameter (see fig. 2.5).
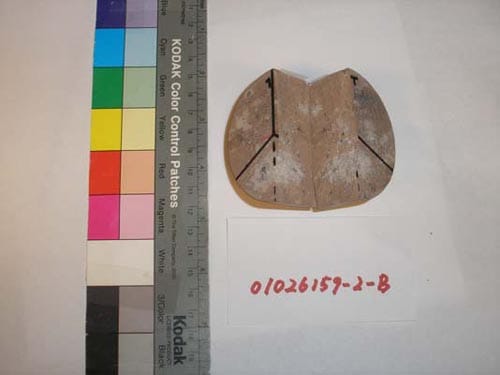
Fig. 2.5
2.2.3 Load rate
As a matter of fact, it should be displacement rate, because in our tests, load is applied by displacement control. For specimens with the diameter of about 60.96mm, the displacement rates vary from 0.0002mm/min to 2mm/min. For specimens with the diameter of about 44.96mm, the displacement rates vary from 0.000145 to 0.145mm/min. Tensile strength-Displacement rate graph with trend line is shown in Fig. 2.6. The figure indicates the tensile strength increases slightly with increasing load rate.
2.2.4 Contact pressure distribution
The tensile strength formula for Brazilian test is based on the assumption that the contact pressure between specimen and load platen is uniform. But because of the coarseness of specimen surface, the real contact pressure distribution is highly uneven, as discussed in detail in section 2.4: contact pressure experimental results.
To evaluate the influence of uneven pressure on the tensile strength, we conducted comparison tests: two groups of tests were performed in almost the same test conditions, and all specimens came from the same geological formation (Tptpmn). In group 1, one bearing strip (cardboard) was inserted between the specimen and load platen to distribute the pressure evenly; in group 2, two bearing strips were used to get more even pressure distribution. Test results are listed in Table 2.2.
From the table we can see that using two more bearing strips may increase the tensile strength. Because two bearing strips cause more even pressure distribution, we can draw the conclusion that uneven pressure distribution lowers the tensile strength. In all the subsequent Brazilian tests, the two bearing strips were used to attain the more precise result.
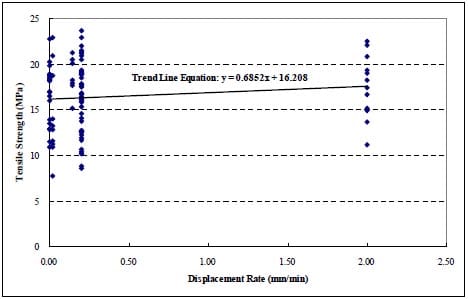
Fig. 2.6 Brazilian tensile strength as a function of imposed displacement rate
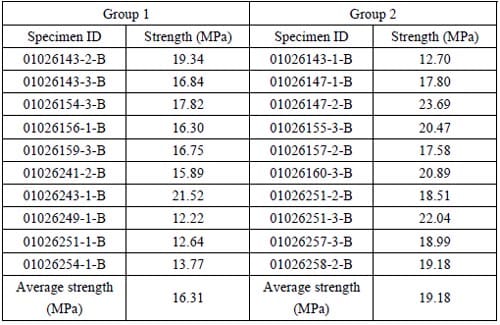
Table 2.2 Brazilian tensile strength as a function of number of cardboard inserts at each loading point. Group 1:1 insert; Group 2: 2 inserts.
2.3 Calculation of radial displacement for indirect tensile splitting (“Brazilian”) test
In this Appendix Section the radical displacement is calculated for indirect tensile splitting (“Brazilian”) tests according to Jaeger and Cook, 1979, Section 10.7, equations (15) and (16), and according to an exact (closed form) solution derived in parallel with the formula (16) of section 10.6 of Jaeger and Cook (1979).
2.3.1. Introduction
The immediate objective of this analysis is to implement a method for calculating the radial displacements (which can readily be converted into diameter changes) of a specimen tested in tensile splitting (“Brazilian”) test. The ultimate objective is to evaluate whether it might be possible to calculate the elastic properties of the rock tested from measurements of diameter changes. If such determination were possible, it would greatly expand the data base obtained of elastic properties of the rock tested.
2.3.2. Procedures
(1) Use Section 10.7, formula (15) in reference to calculate the displacements when θ = 0, 45, 90, 135, 180, 215, 270, 315 degrees. The following parameters were adopted: Specimen radius R = 30.48mm, thickness t = 25mm, contact angle 2α = 12 degrees, load P = 50kN; Material properties: E = 35000MPa, ν = 0.16. The first 30 terms of the infinite series were used to calculate the displacements.
(2) Use Section 10.7, formula (16) in Jaeger and Cook (1979) to calculate the results when θ =90, 270 degrees, then compared with the results in procedure (1).
(3) Use an exact formula derived in parallel to formulas (16) and (17) in Section 10.6 in Jaeger and Cook (1979) to calculate the results when θ = 0, 90,180 and 270 degrees, then compare with the results in procedure (1).
The derived formula is: If θ = 0, 180, then:

(4) Use Section 10.7, formula (15) and derived formula to calculate the displacement of Specimen 01026209-6-B, then compared with the test result. Specimen characters: R = 22.48 mm, t = 24.98 mm, contact angle 2α = 16.514 degrees. The same material properties were adopted as for procedure (1).
2.3.4 Conclusions and Discussion
1) In general, using the first 20-30 terms of infinite series in Section 10.7 formula (15) gives results having good agreement with the simplified and exact formulas.
2) The derived formula was verified using different α values, and the differences from the results calculated by formula (15) are less than 0.76%.
3) The computation result for specimen 01026209-6-B is much different from the test data. Possible causes are as follows:
- All formulas are derived in linear elastic condition, but in test the specimen (force-displacement) shows strong non-linear character.
- The load was taken as the uniform pressure, but in real contact problems, its distribution is very complicated.
- Young’s Modulus, Poisson’s Ratio and contact angle 2α are all approximation.
- Test result includes the deformation of the test machine.
- The formulas are derived assuming linear elastic isotropic behavior. It is possible that the Young’s modulus in tension is smaller than the Young’s modulus in compression, and hence that the actual behavior is anisotropic.
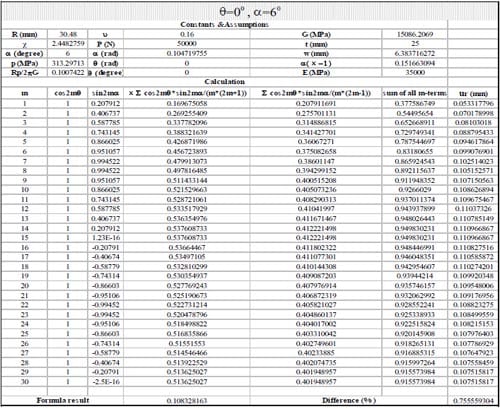
Table 2.3.1
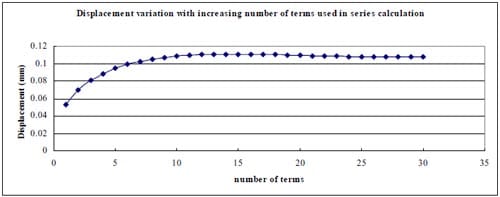
Fig 2.3.1
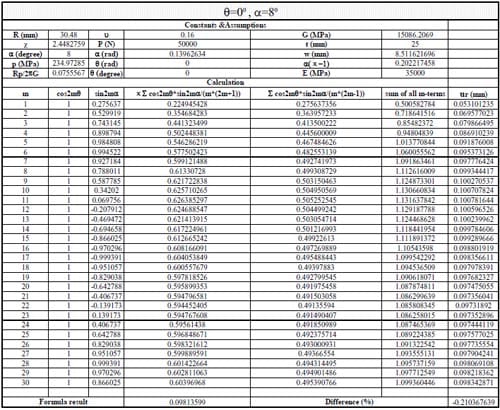
Table 2.3.2
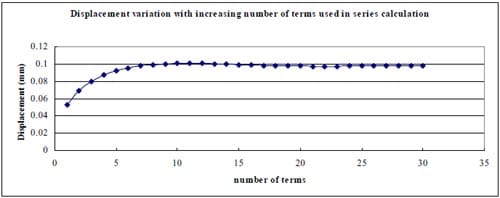
Fig. 2.3.2
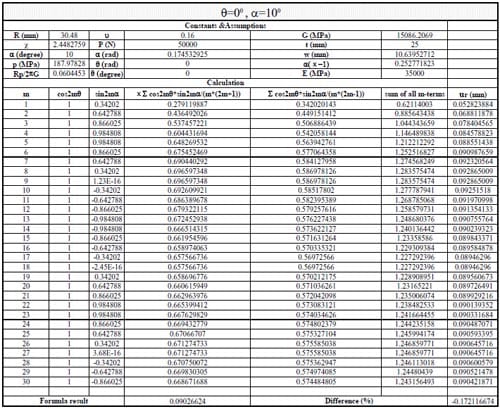
Table 2.3.3
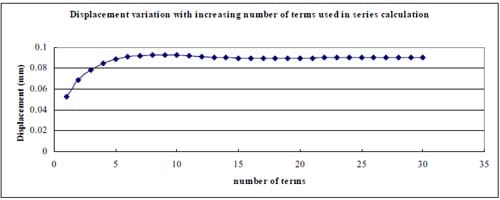
Figure 2.3.3
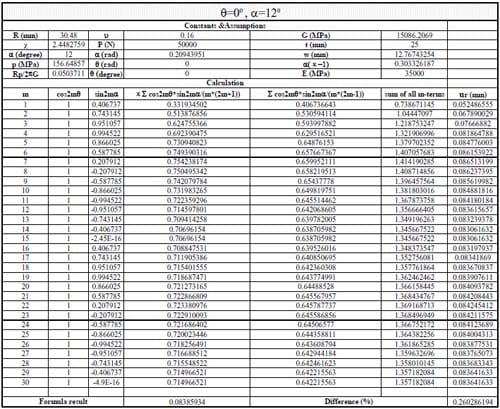
Table 2.3.4
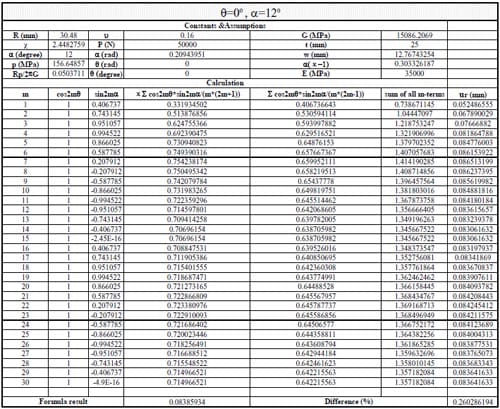
Fig 2.3.4
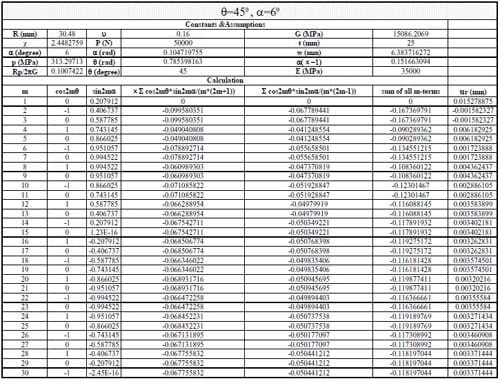
Table 2.3.5
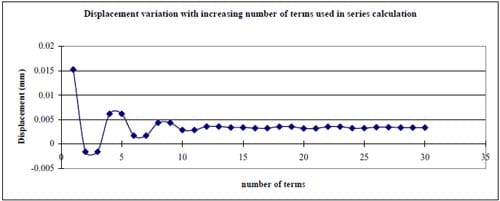
Fig. 2.3.5
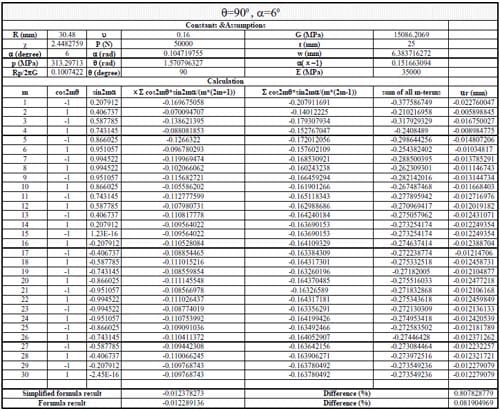
Table 2.3.6

Fig 2.3.6
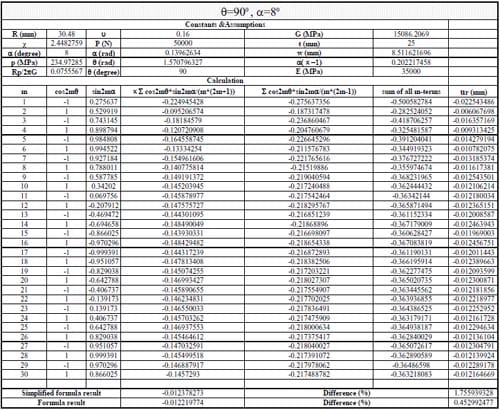
Table 2.3.7
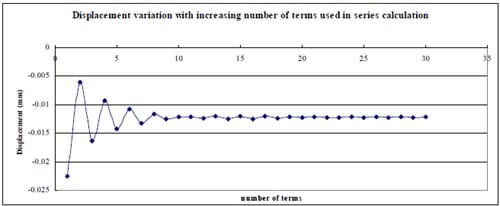
Fig. 2.3.7
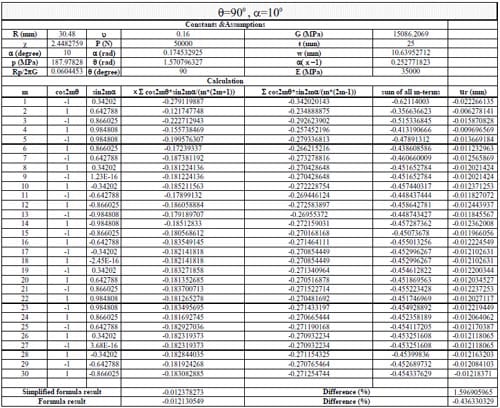
Table 2.3.8
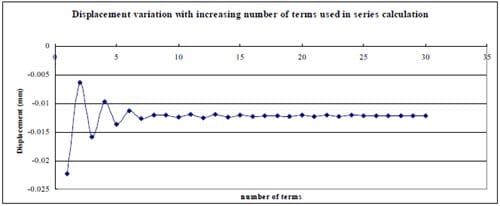
Fig. 2.3.8
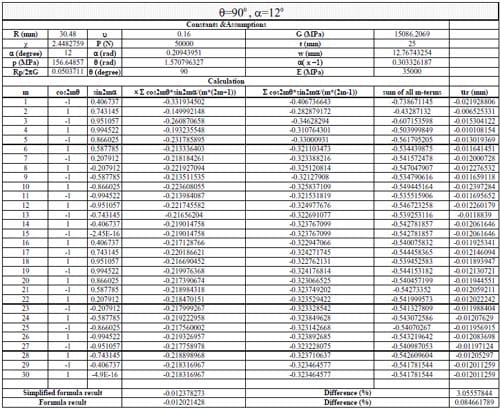
Table 2.3.9
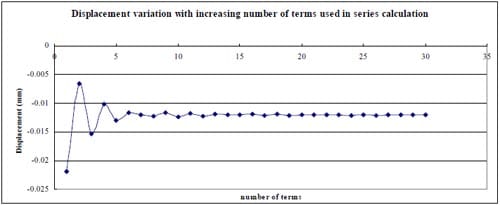
Fig 2.3.9
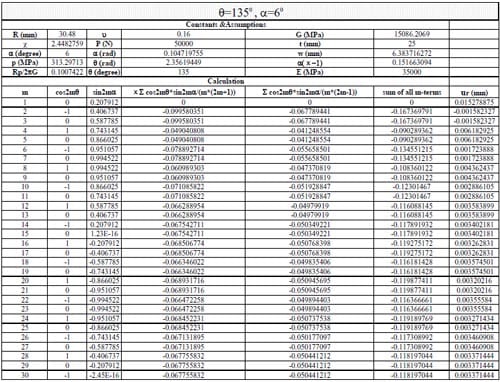
Table 2.3.10
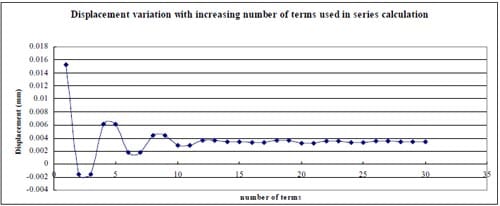
Fig. 2.3.10
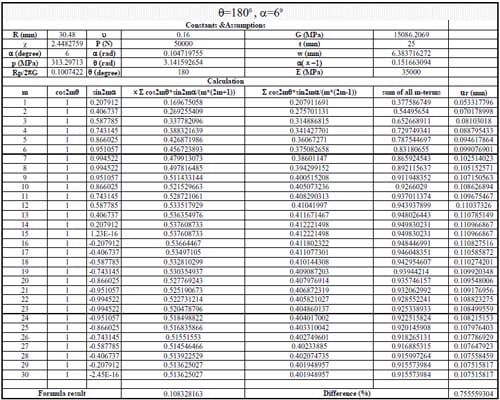
Table 2.3.11
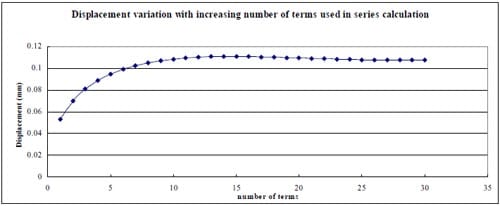
Fig. 2.3.11
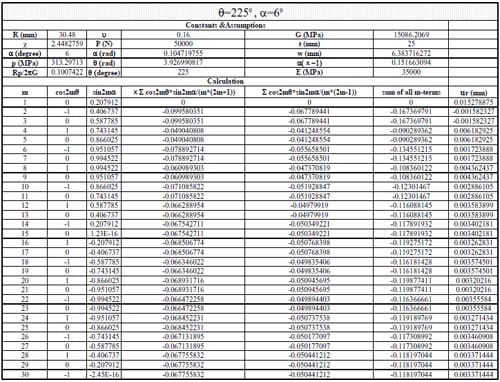
Table 2.3.12
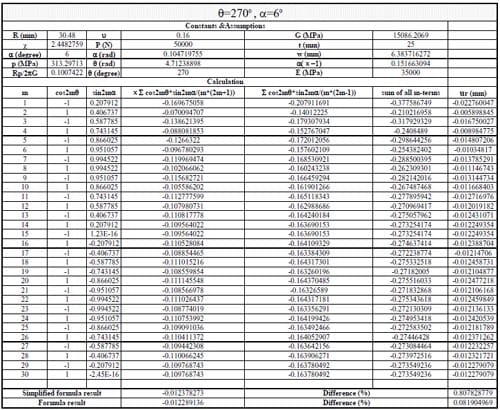
Table 2.3.13
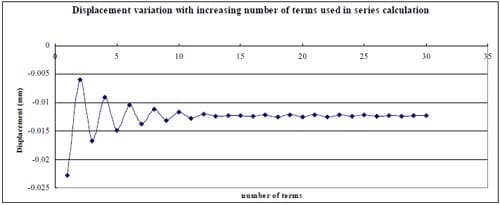
Fig 2.3.13
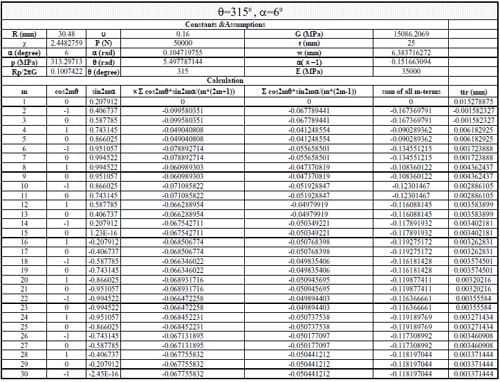
Table 2.3.14
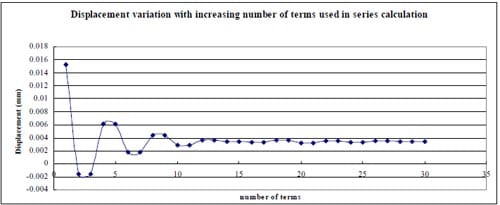
Fig. 2.3.14
2.4 Contact pressure experimental results
The contact pressure distribution of the specimen and load platen in a Brazilian test is a typical contact problem, which had been solved by Hertz (1881) theoretically. But because it’s impossible for the real test conditions to meet the n
eeds of theory, for example, the surface of a real specimen can’t be absolutely smooth, the real contact pressure distribution should be determined by experimental method.
The pressure film of SPI Corporation East Hanover, NS, was employed to measure the contact pressure distribution. The film can be inserted between the two contact surfaces. After testing, it can be processed and show the distribution of contact pressure. Unfortunately, the contact pressure in our Brazilian tests is very high. SPI Corporation can’t process this type of film precisely: they can’t give the numerical results, but only the outline of the pressure distribution.
The following are examples of the results (specimen 01026155-2-B):
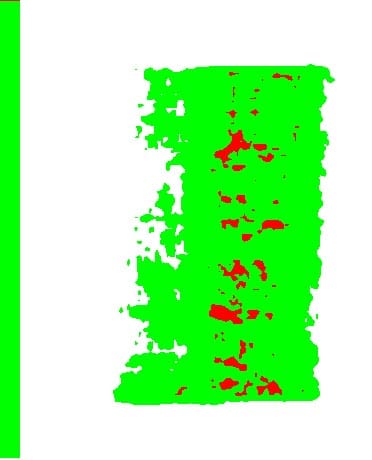
Fig. 1: Original film result of the top of specimen 01026155-2-B.
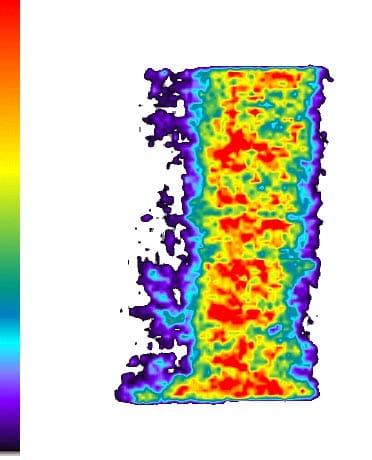
Fig. 2: Enhanced film result of the top of specimen 01026155-2-B (The left legend shows the pressures from low to high according to the colors from bottom to top).
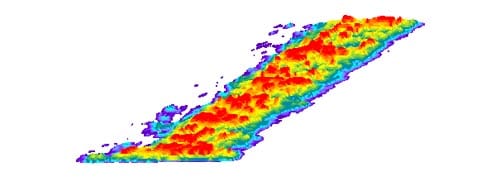
Fig. 3: Three-dimensional demonstration of pressure distribution of the top of specimen 01026155-2-B
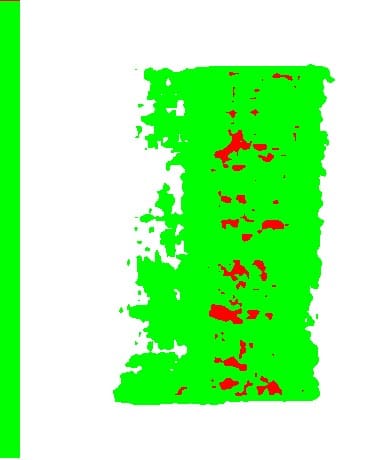
Fig. 4: Specimen 01026155-2-B (bottom) (1)
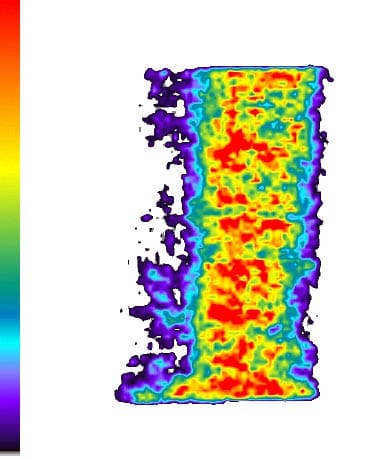
Fig. 5: Specimen 01026155-2-B (bottom) (2)
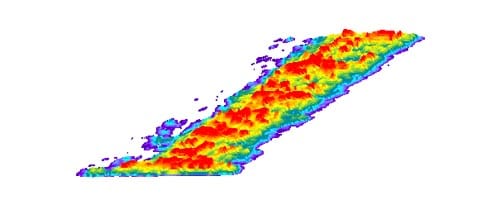
Fig. 6: Specimen 01026155-2-B (bottom) (3)

Fig. 7: Specimen 01026248-2-B (Top) (1)
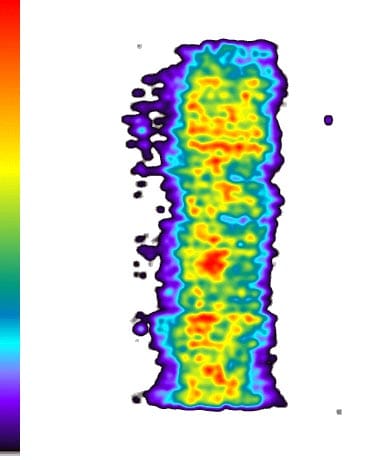
Fig. 8: Specimen 01026248-2-B (Top) (2)
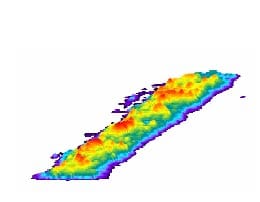
Fig. 9: Specimen 01026248-2-B (Top) (3)
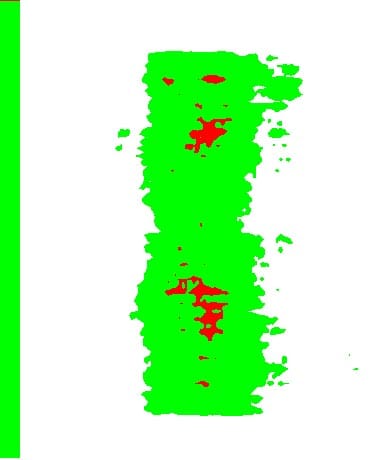
Fig. 10: Specimen 01026248-2-B (Bottom) (1)
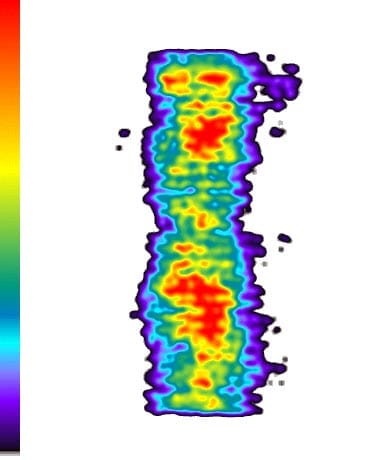
Fig. 11: Specimen 01026248-2-B (Bottom) (2)
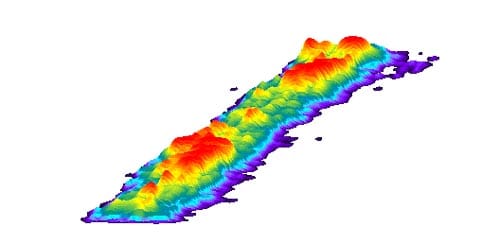
Fig. 12: Specimen 01026248-2-B (Bottom) (3)
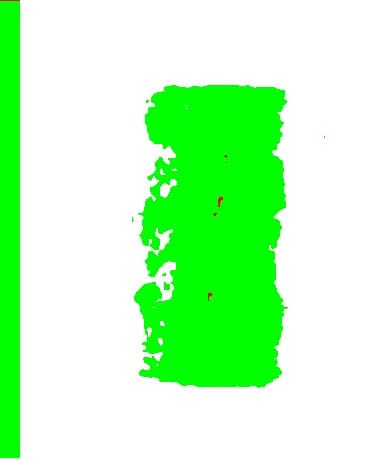
Fig. 13: Specimen 01026160-4-B (Top) (1)
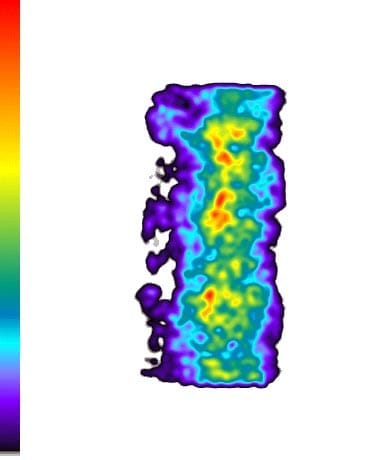
Fig. 14: Specimen 01026160-4-B (Top) (2)
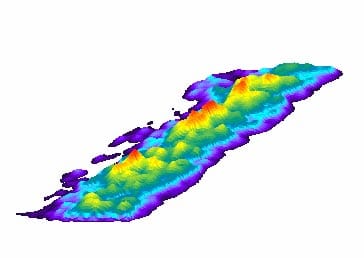
Fig. 15: Specimen 01026160-4-B (Top) (3)
Fig. 16: Specimen 01026160-4-B (Bottom) (1)
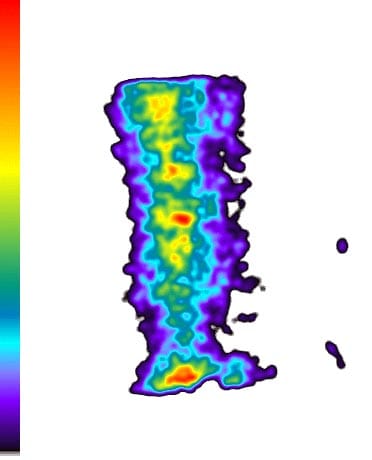
Fig. 17: Specimen 01026160-4-B (Bottom) (2)
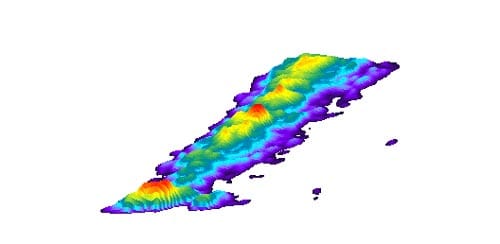
Fig. 18: Specimen 01026160-4-B (Bottom) (3)
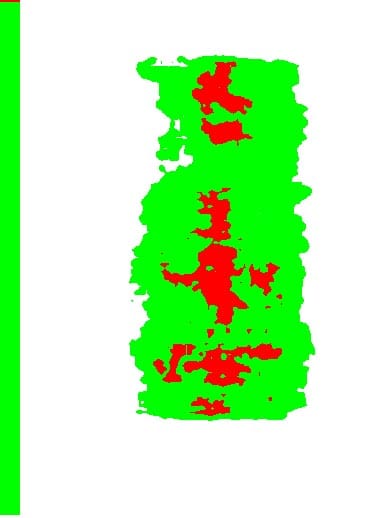
Fig. 19: Specimen 01026259-2-B (Top) (1)
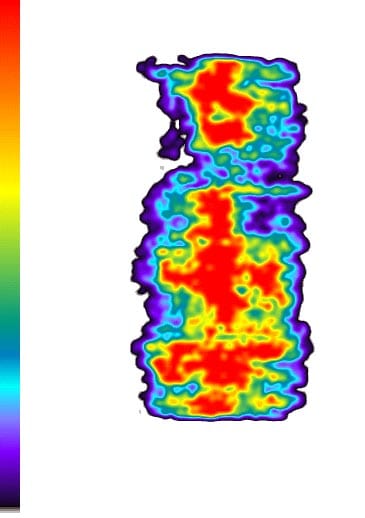
Fig. 20: Specimen 01026259-2-B (Top) (2)
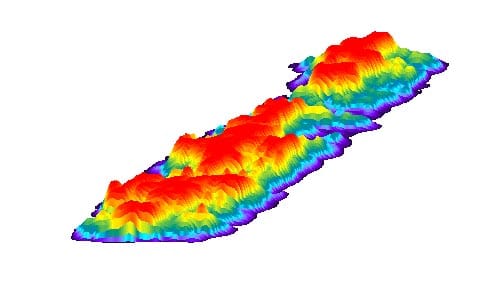
Fig. 21: Specimen 01026259-2-B (Top) (3)
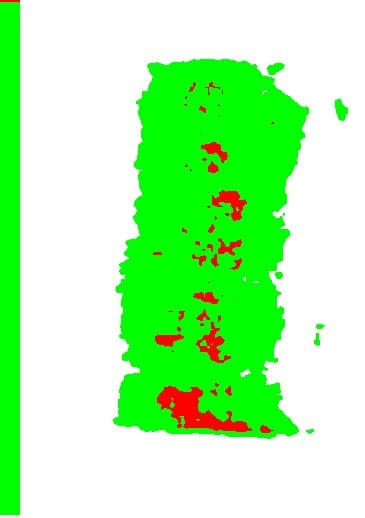
Fig. 22: Specimen 01026259-2-B (Bottom) (1)
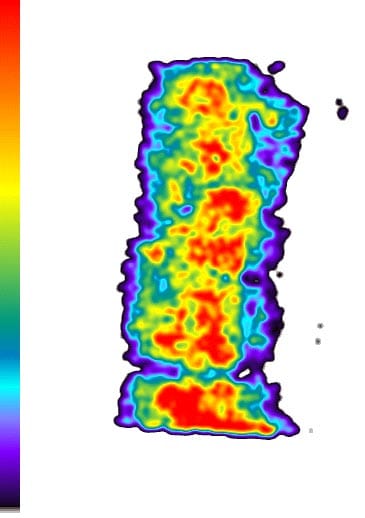
Fig. 23: Specimen 01026259-2-B (Bottom) (2)
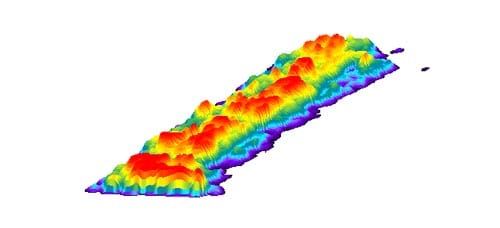
Fig. 24: Specimen 01026259-2-B (Bottom) (3)
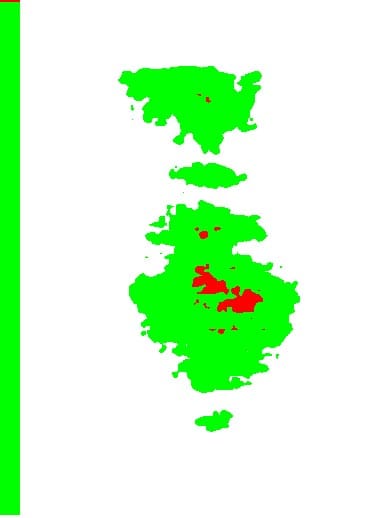
Fig. 25: Specimen 01026258-1-B (Top) (1)
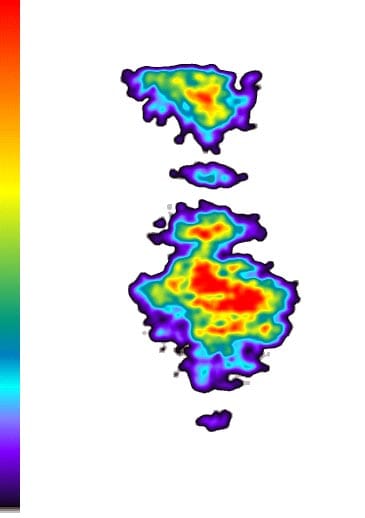
Fig. 26: Specimen 01026258-1-B (Top) (2)
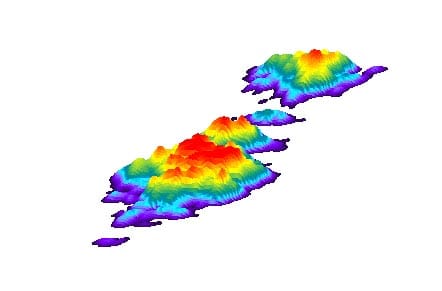
Fig. 27: Specimen 01026258-1-B (Top) (3)
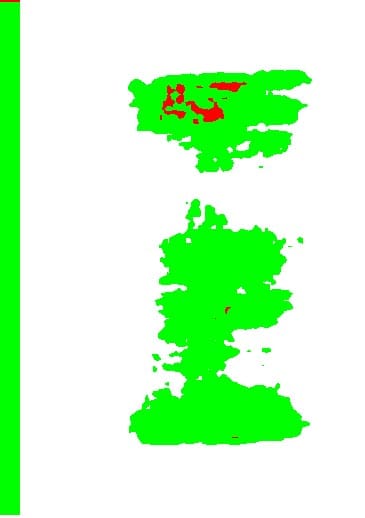
Fig. 28: Specimen 01026258-1-B (Bottom) (1)
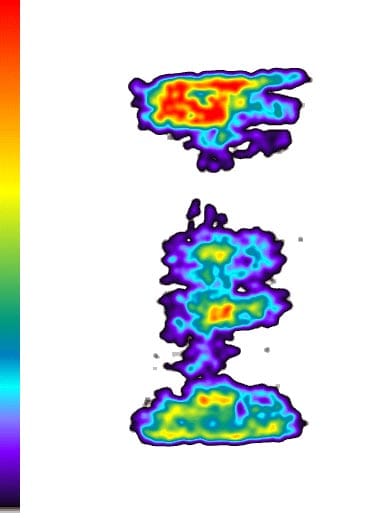
Fig. 29: Specimen 01026258-1-B (Bottom) (2)
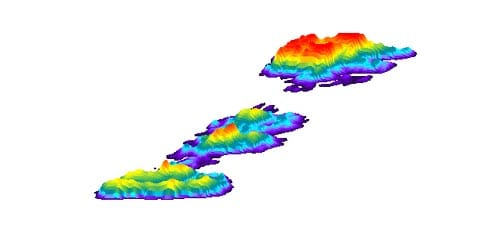
Fig. 30: Specimen 01026258-1-B (Bottom) (3)
These results show: the contact pressure distribution is highly uneven and very different from the theoretical results. The condition probably caused by the rough surface of specimen.
2.5 Force-displacement curves
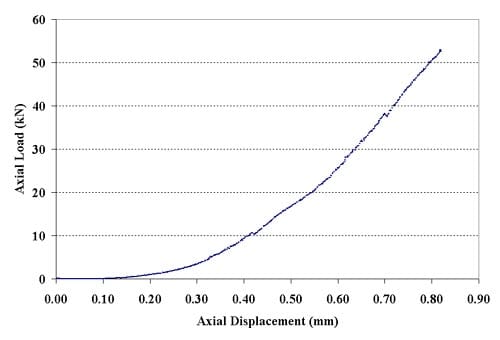
Figure 2.5.1 – Force-displacement curves for specimen 01026161-3-B; displacement rate = 0.0002 mm/minute; tensile strength = 18.75 MPa
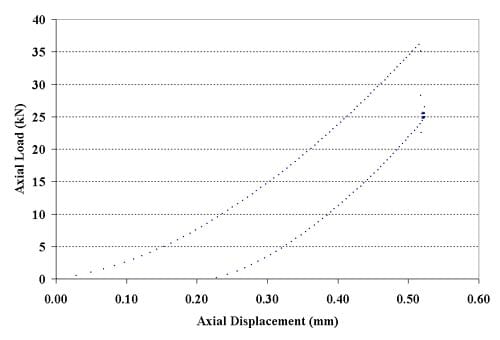
Figure 2.5.2 – Force-displacement curves for specimen 01026163-1-B; displacement rate = 0.2 mm/minute; tensile strength = 12.46 MPa
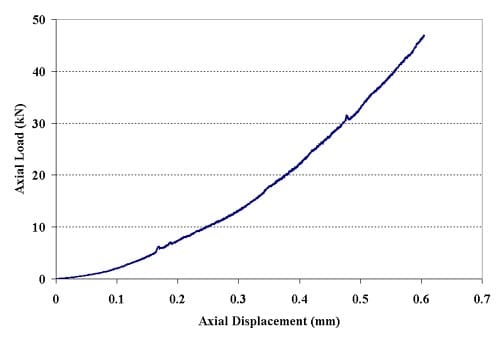
Figure 2.5.3 – Force-displacement curves for specimen 01026167-2-B; displacement rate = 0.0002 mm/minute; tensile strength = 16.49 MPa
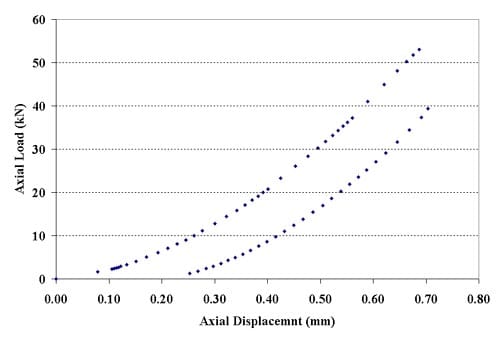
Figure 2.5.4 – Force-displacement curves for specimen 01026248-1-B; displacement rate = 0.2 mm/minute; tensile strength = 18.84 MPa
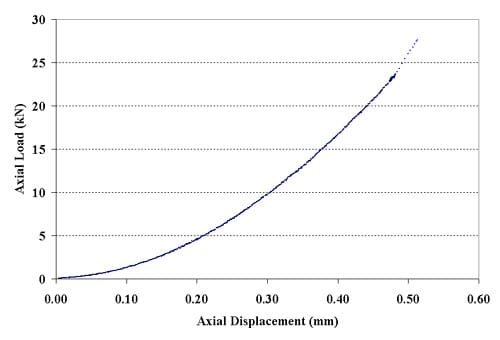
Figure 2.5.5 – Force-displacement curves for specimen 01026294-1-B; displacement rate = 0.002 mm/minute; tensile strength = 20.22 MPa
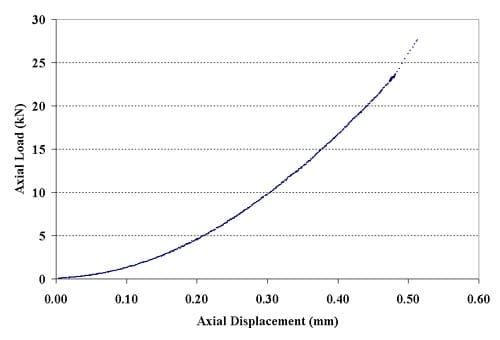
Figure 2.5.6 – Force-displacement curves for specimen 01026294-3-B; displacement rate = 0.002 mm/minute; tensile strength = 18.54 MPa
2.6 Photographs
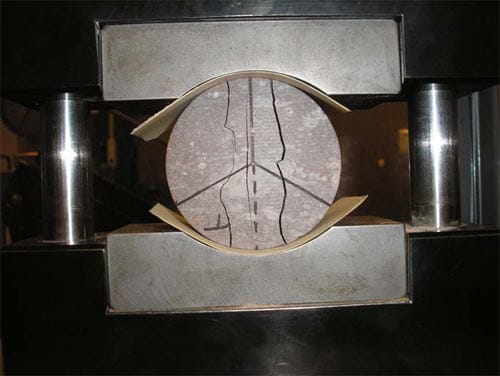
Figure 2.5.7 – Specimen after Brazilian (ind
irect tensile strength) test, specimen ID 01026167-4-B
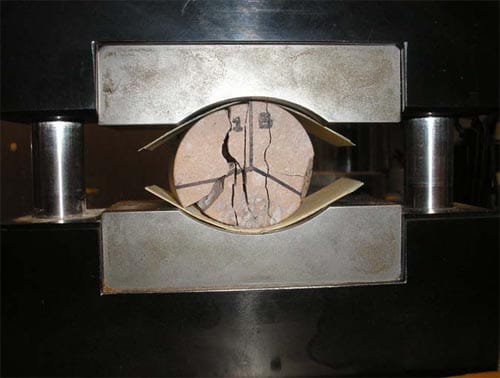
Figure 2.5.8 – Specimen after Brazilian (indirect tensile strength) test, specimen ID 01026206-1-B
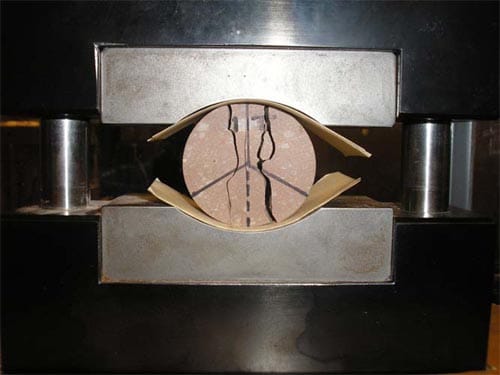
Figure 2.5.9 – Specimen after Brazilian (indirect tensile strength) test, specimen ID 01026209-4-B
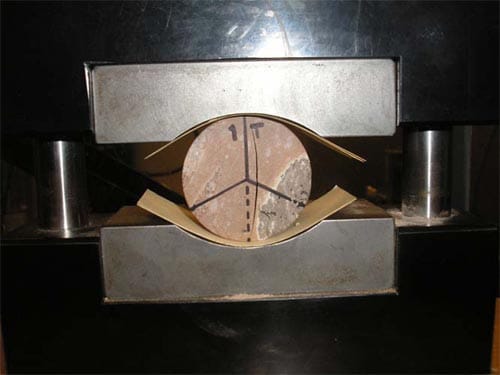
Figure 2.5.10 – Specimen after Brazilian (indirect tensile strength) test, specimen ID 01026209-3-B
3.1 Specimen

Table 3.1 Specimen characteristics
3.2 Test Summary

Table 3.2 Test Summary
Note: Calculations of Young’s Modulus and Poisson’s ratio follow ASTM D3148-96 Standard Test Method for Elastic Moduli of Intact Rock Core Specimens in Uniaxial Compression. They are determined at 50% of the peak stress level.
3.3 Plots and Photos
3.3.1 Plots
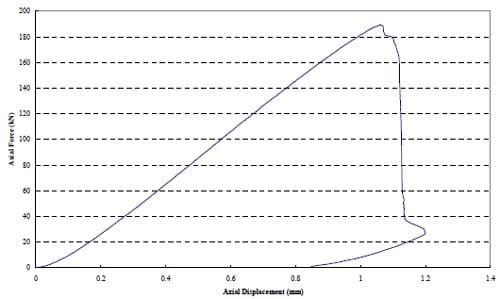
Table 3.2 Test Summary
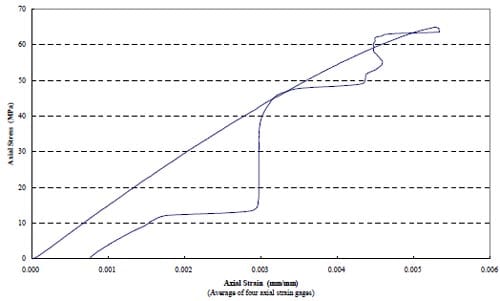
Axial Force vs. Axial Displacement
3.3.2 Photos of failed specimen
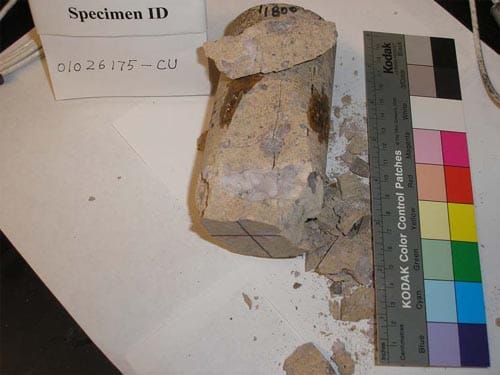
Fig. 3.3
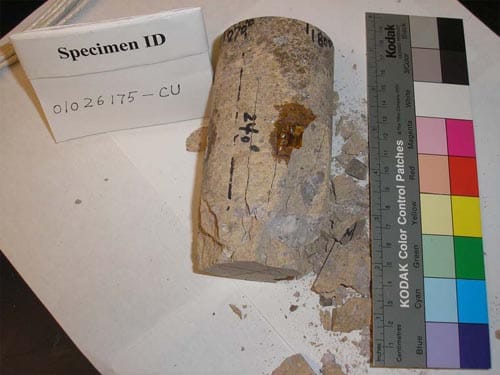
Fig 3.4
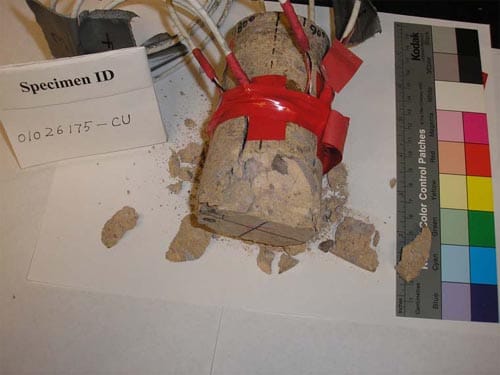
Fig 3.5
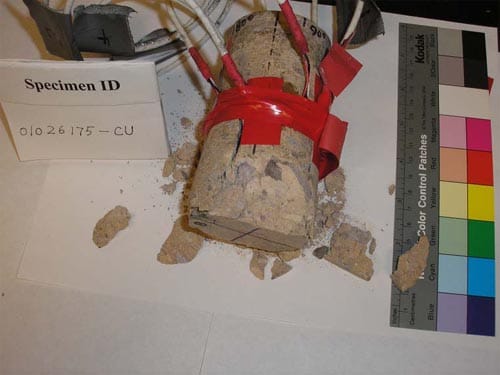
Fig 3.6
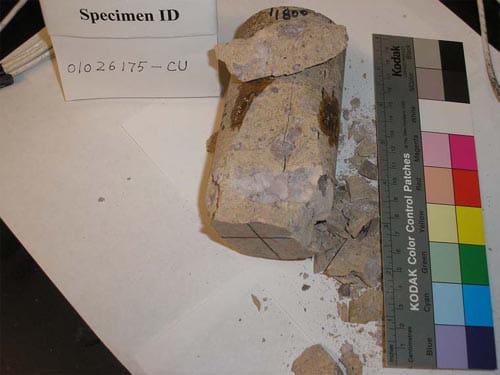
Fig 3.7
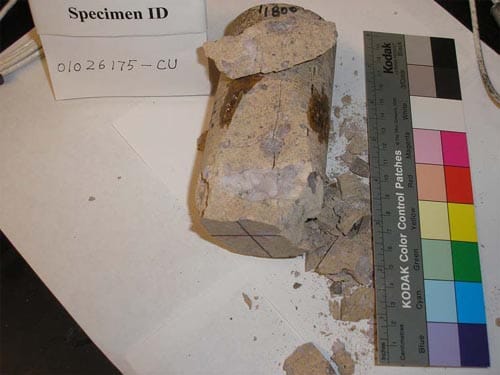
Fig 3.8
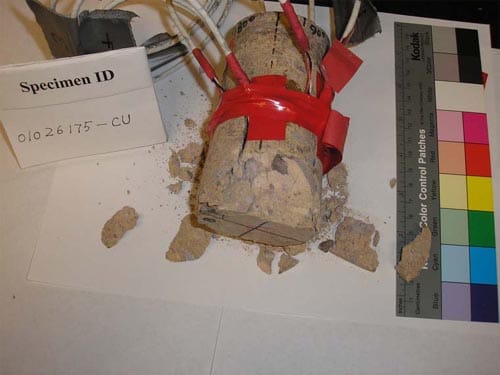
Fig 3.9
4.1 Specimen

Table 4.1 Specimen Characteristics
4.2 Test Summary

Table 4.2 Test Summary
Note: Young’s Modulus and Poisson’s ratio are determined at the 50% of first stress level (70MPa).
4.3 Plots and Photos
4.3.1 Plots
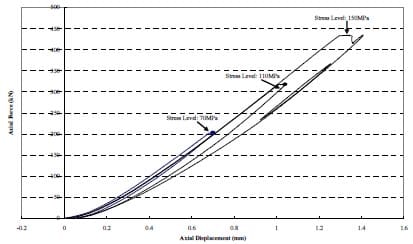
Fig 4.1
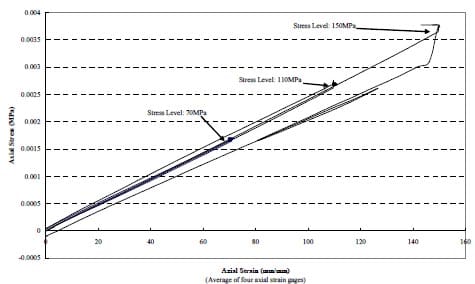
Fig 4.2
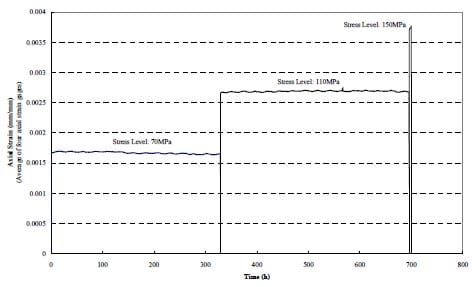
Fig 4.3
4.3.2 Photos of failed specimen
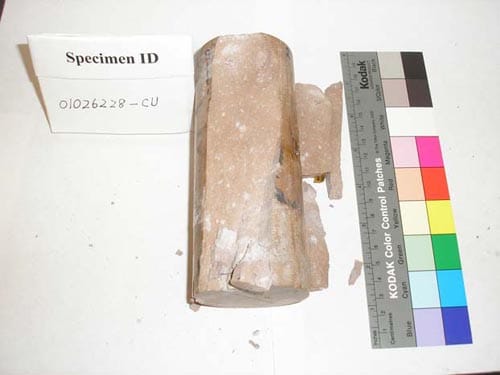
Fig 4.4
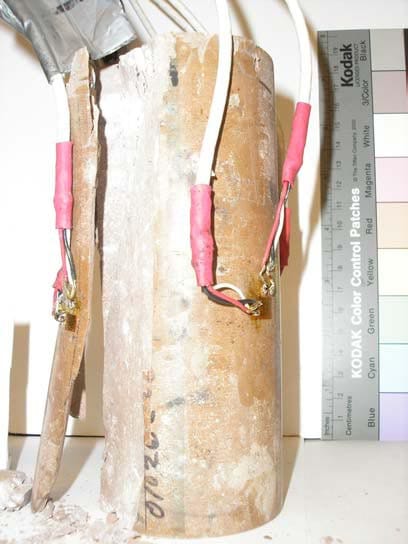
Fig 4.5
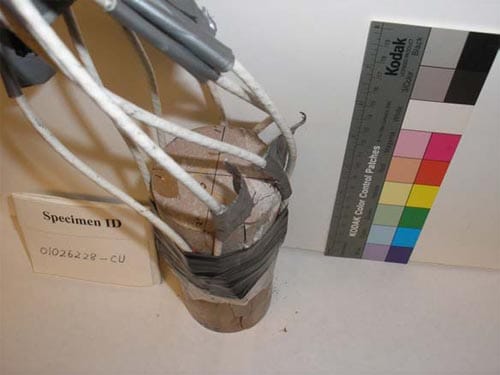
Fig 4.6
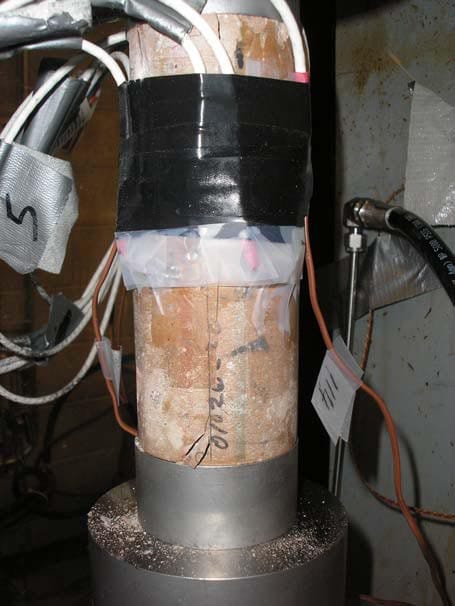
Fig 4.7
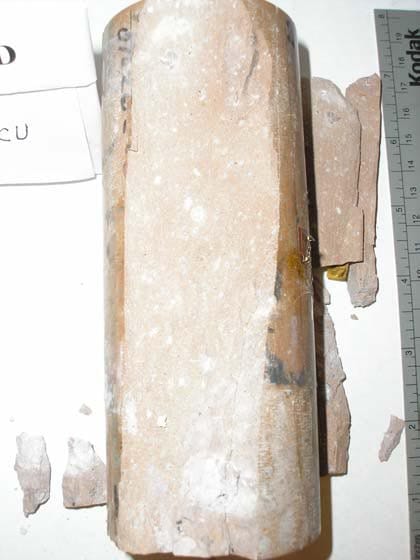
Fig 4.8
Appendix 5 – Particle Size Distribution of failed Tptpmn (Topopah Spring Middle Nonlithophysal) Tuff Cylinder Specimens Tested in Uniaxial Compression at Various Strain Rates
5.1. Introduction
The strain rate at which tests are performed impacts the strength of rock. Perhaps it will influence the crack pattern of the rock. In fact, in the more than 80 uniaxial tests performed to determine the strength of the Tptpmn Tuff, we observed it might be a rule that when the strain rate goes up, the size of the resulting particles gets smaller (Figures 5.1 and 5.2).
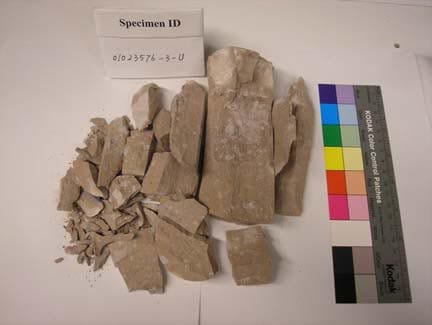
Fig. 5.1: Typical failure at low strain rate (Strain rate=1.10e-8)
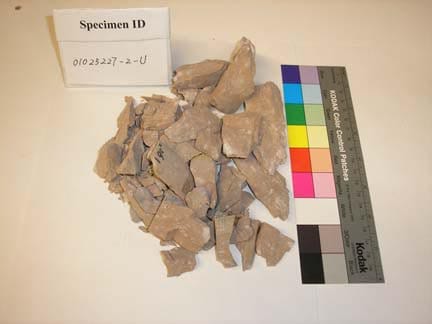
Fig. 5.2: Typical failure at high strain rate (Strain rate=8.85e-3)
To verify our viewpoint, sieving was used to determine the particle size distribution.
5.2 Sieving
The sizes of the sieve openings we used are 1.5 in, 1.0 in, 0.75 in, 0.5 in, 0.375 in and 0.25 in. Because the failure of specimens under compressive load is predominately longitudinal, especially at low strain rates (Fig. 5.1), many particles are much larger in one dimension, so it is difficult to sieve them mechanically. Thus we manually sieved them to ensure that all the particles less than the sieve openings size in the two shorter dimensions can pass through the openings. The weights of particles retained on each sieve and of those falling into the container are written down. The percentage of the particle weight in each sieve size and in the lowest container is calculated.
5.3 Results and discussion
5.3.1. Sieving results
The samples we used were failed specimens of the uniaxial compression tests in Yucca Mountain Project Task 18 (See Task 18 Final Report (Ma and Daemen, 2004), or: https://www.unr.edu/rockmech/Research.htm for detail). All are from the same rock formation, Tptpmn (Topopah Spring crystal-poor Middle Nonlithophysal). Before sieving, the specimens without major flaws were selected in the specimen database. A total of 63 specimens were selected. The sieving results are listed below (Tables 5.1 and 5.2):
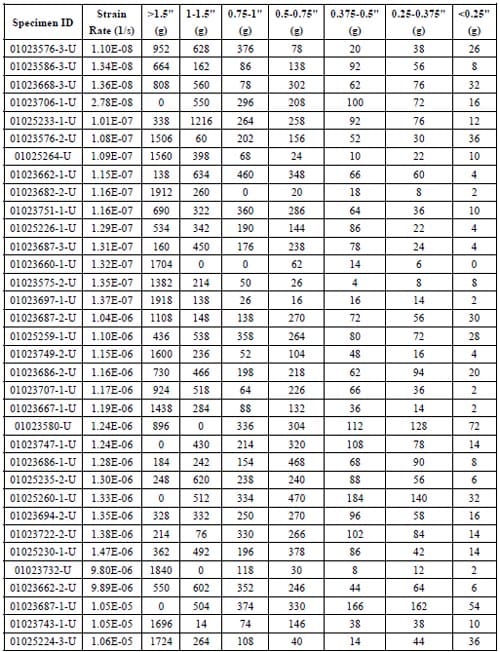
Table 5.1: The particle weight distribution
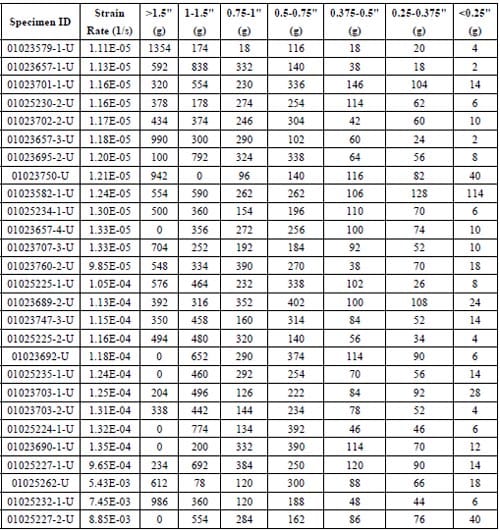
Table 5.1: The particle weight distribution
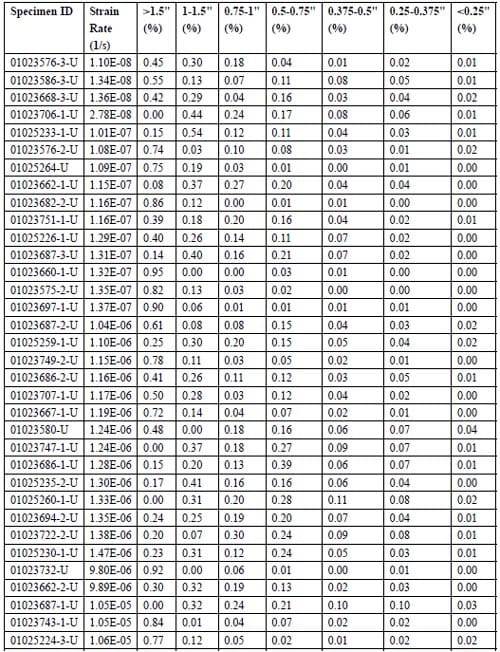
Table 5.2: Distribution of the weight percentage
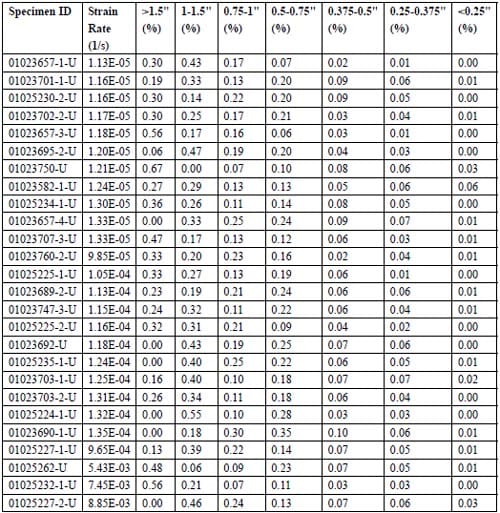
Table 5.2: Distribution of the weight percentage
5.3.2. Discussion
In order to determine the relationship between particle size and strain rate, the linear regression method was adopted. The regression equations are shown in the following graphs (the x-coordinate, strain rate, uses the logarithmic scale):
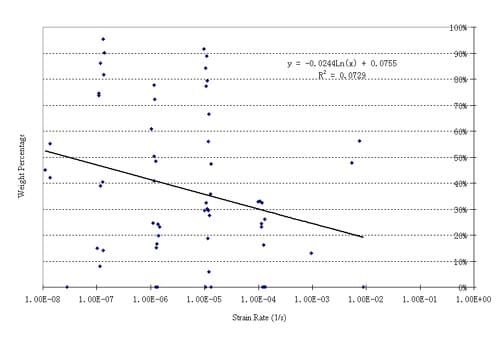
Fig. 5.3 – Weight Percentage vs. Strain Rate (1) – Particles larger than 1.5”
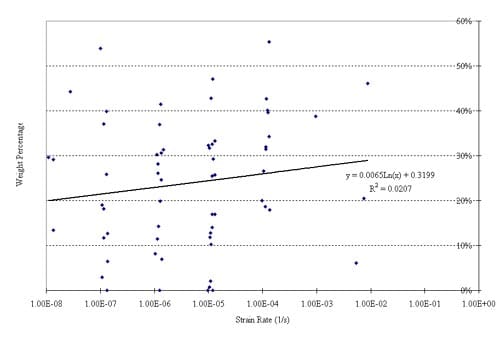
Fig. 5.4 – Weight Percentage vs. Strain Rate (2)
– Particles between 1” and 1.5”
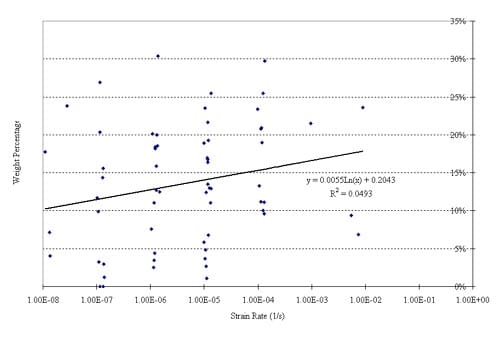
Fig. 5.5 – Weight Percentage vs. Strain Rate (3) – Particles between ¾” and 1”
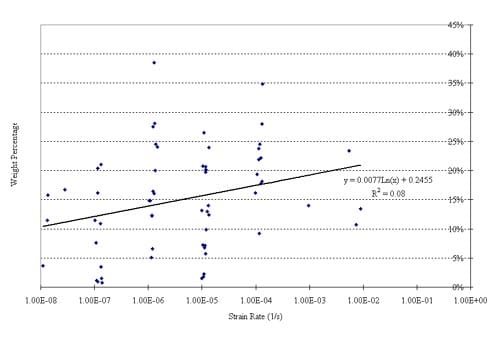
Fig. 5.6 – Weight Percentage vs. Strain Rate (4) – Particles between ½” and ¾”
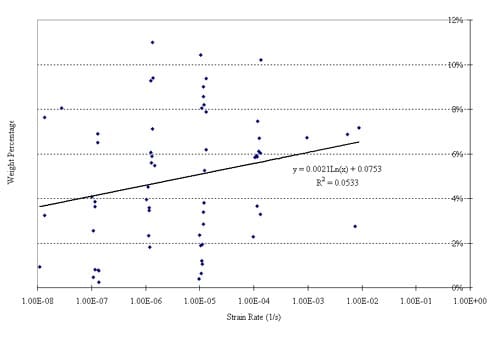
Fig. 5.7 – Weight Percentage vs. Strain Rate (5) – Particles between 3/8” and ½”
Fig. 5.8 – Weight Percentage vs. Strain Rate (6) – Particles between 0.187” and 0.375”
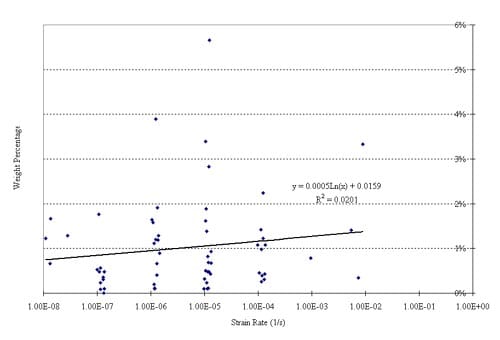
Fig. 5.9 – Weight Percentage vs. Strain Rate (7) – Particles smaller than 0.187”
From the graphs we can see that the percentage of the largest particles (larger than 1.5 in) has the trend of going down with increasing strain rate. The fraction of smaller particles tends to increase with increasing strain rate. That is to say, at the higher strain rate, tuff breaks into smaller pieces.
The statistical validity of the results is questionable, for at least two reasons: the extreme scatter in the results, typical of many mechanical properties of Yucca Mountain tuffs, and the small number of results at the highest and lowest strain rates.
Stress Rate Dependent Strength of a Welded Tuff in Triaxial Tests
Ma, L., Vector Engineering, Inc., Grass Valley, CA 95945, USA
Zhao, G., School of Civil Engineering, Jinan University, P.R.China
Sunkara, A. and Daemen, J. J. K., Department of Mining Engineering, University of Nevada, USA
ABSTRACT
Twenty seven triaxial compression tests have been conducted on welded tuff at constant and controlled axial piston displacement rates. The piston displacement rates were then converted to axial stress rates according to a nearly linear load-displacement relation. Specimens were tested in three orders of displacement rates or stress rates and at three confining pressures. Results of thirty eight uniaxial compression tests were incorporated into the group of triaxial tests. The specimens for the uniaxial tests were collected from the same location in Yucca Mountain as for the triaxial tests. The stress rates for triaxial and uniaxial tests are the same.
Strain gages were used for thirteen triaxial tests and all the uniaixal tests. Tests in three stress rates of the order of 0.4, 0.04 and 0.004 MPa/s and four confining pressures, 0, 5, 10 and 20 MPa were analyzed. Differential axial stress at failure increases with confining pressure and stress rate, both relations following power laws. Volumetric strain increases with confining pressure following an exponential law and decreases with stress rate following a power law. Young’s modulus decreases with confining pressure and increases with stress rate. Poisson’s ratio increases with confining pressure and stress rate.
1. INTRODUCTION
Results of twenty seven triaxial and thirty eight uniaxial compression tests on welded Topopah Spring tuff are presented. This testing program was a part of an investigation of long-term mechanical behavior of Yucca Mountain tuff in Nevada. Yucca Mountain has been selected as a candidate site for a High Level Nuclear Waste Repository in the United States [1]. The welded Topopah Spring Tuff is where the repository is to be excavated. Units exposed in the Topopah Spring Tuff include the Topopah Spring crystal-poor upper lithophysal zone (Tptpul), the Topopah Spring crystal-poor middle nonlithophysal zone (Tptpmn), the Topopah Spring crystal-poor lower lithophysal zone (Tptpll), and the Topopah Spring crystal-poor lower nonlithophysal zone (Tptpln) [2].
All the test specimens were from the Tptpmn zone. The specimens were prepared from rock drill cores received from the Sample Management Facility (SMF), Yucca Mountain Site Characterization Project. The drill cores were mainly from sidewalls of Alcove 5, which is for drift scale thermal test. The nominal diameter of the cores was 61 mm. For triaxial tests the ratio of length to diameter was controlled in the range of 1.9-2.5 to fit the 61 mm inner diameter Hoek triaxial cell. For uniaxial testing the ratio was between 1.8-2.6. The triaxial tests were conducted at constant and controlled axial piston displacement rates. The piston displacement rates were then converted to axial stress rates according to a nearly linear load-displacement relation. Specimens were tested at three orders of displacement rates or stress rates and three confining pressures. Results of thirty eight uniaxial tests [3] were incorporated into the group of triaxial tests. The stress rates for triaxial and uniaxial tests are the same. The average moisture content was 0.7%. The average density is 2.26 g/cm3. The porosity of the specimens in Tptpmn zone is in the range of 10-13% [3].
2. EXPERIMENTAL SETUP AND RESULTS
The tests were conducted in an MTS (Material Testing System), servo-controlled hydraulic test system. Load was measured using a load cell. Axial displacement was measured using an LVDT (Linear Variable Differential Transducer) in the MTS. Confining pressure was applied using an MTS servo-controlled hydraulic confining pressure generator which is controlled by the same program as axial load. The confining pressure is applied in such a way that the rate is slightly lower than axial loading rate to meet ASTM 2664 [4]. Strain was measured using electrical resistance strain gages. Four strain gages were used on each specimen for triaxial and six for uniaxial testing. Two or four measure axial strain. Two measure lateral strain. Strain gages were cemented at about midheight of each specimen. Strain in each direction was calculated by averaging all measurements in that direction. Strain gages were used in thirteen triaxial tests and all the uniaxial tests. The triaxial tests were conducted at three confining pressures, 5, 10 and 20 MPa and three stress rates of the order of 0.4, 0.04 and 0.004 MPa/s. Thus tests at four confining pressures and three stress rates are analyzed in this paper. Figure 1 shows a specimen with strain gage wires and the Hoek triaxial cell sitting in the MTS frame.
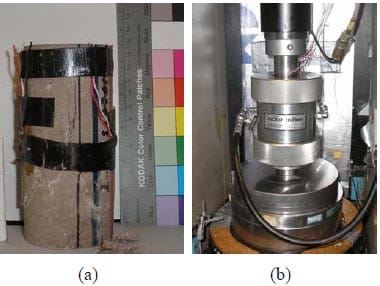
Fig. 1. A specimen with strain gages and wires (a), and the Hoek triaxial cell sitting in the MTS frame (b).
Figures 2-5 give curves of differential axial stress (axial stress for uniaxial test)-axial strain (right), curves of differential axial stress-lateral strain (left) and curves of differential axial stress-volumetric strain (middle) for confining pressures 0, 5, 10 and 20 MPa, respectively at different stress rates. Test results used in the following analysis are summarized in Table 1. Volumetric strain is calculated by εv = ε1 + 2ε3 where ε1 is axial strain taken positive and ε3 lateral strain taken negative.
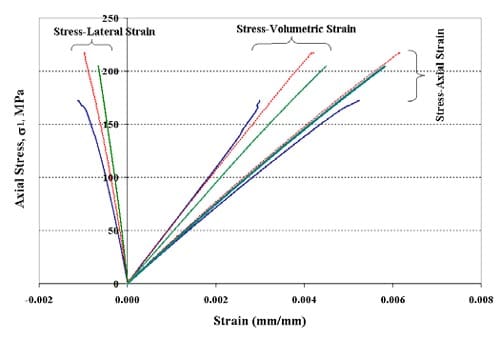
Fig. 2. Stress-strain curves for uniaxial compression tests. Specimen 01023657-3-U: axial stress at failure = 217 MPa, stress rate = 0.3604 MPa/s; Specimen 01023580-U: axial stress at failure = 172 MPa, stress rate = 0.0362 MPa/s; Specimen 01023662-1-U: axial stress at failure = 205 MPa, stress rate = 0.0036 MPa/s.
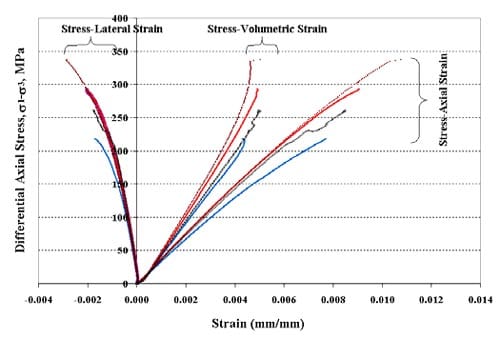
Fig. 3. Stress-strain curves for tests at confining pressure equal to 5 MPa. Specimen 01026153-1-T: axial stress at failure = 337 MPa, stress rate = 0.3772 MPa/s; Specimen 01026226-1-T: axial stress at failure = 262 MPa, stress rate = 0.3647 MPa/s; Specimen 01026258-4-T: axial stress at failure = 293 MPa, stress rate = 0.0038 MPa/s; Specimen 01026241-1-T: axial stress at failure = 218 MPa, stress rate = 0.0035 MPa/s.
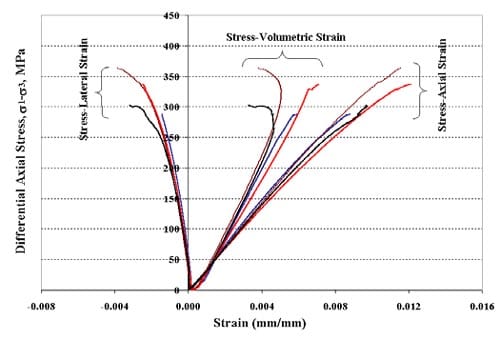
Fig. 4. Stress-strain curves for tests at confining pressure equal to 10 MPa. Specimen 01026144-1-T: axial stress at failure = 363 MPa, stress rate = 0.3743 MPa/s; Specimen 01026227-2-T: axial stress at failure = 303 MPa, stress rate = 0.0396 MPa/s; Specimen 01026225-6-T: axial stress at failure = 336 MPa, stress rate = 0.0375 MPa/s; Specimen 01026145-1-T: axial stress at failure = 288 MPa, stress rate = 0.0037 MPa/s.
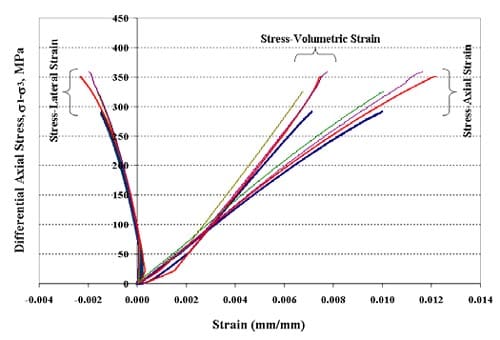
Fig. 5. Stress-strain curves for tests at confining pressure equal to 20 MPa. Specimen 01026145-2-T: axial stress at failure = 325 MPa, stress rate = 0.3952 MPa/s; Specimen 01026229-2-T: axial stress at failure = 358 MPa, stress rate = 0.3872 MPa/s; Specimen 01026255-1-T: axial stress at failure = 351 MPa, stress rate = 0.0036 MPa/s; Specimen 01026146-1-T: axial stress at failure = 292 MPa, stress rate = 0.0035 MPa/s.
3. ANALYSIS AND DISCUSSION
3.1. General observations
All the specimens in uniaxial tests exhibited brittle failure at all stress rates. The brittleness decreases with an increase of confining pressure. In uniaxial tests fractures were nearly parallel to the axis of the specimens, which failed predominantly by longitudinal splitting (Figure 6a). The main mechanism of inelastic deformation in brittle rocks under uniaxial compression is the development of cracks parallel to the compressive stress direction [5, 6]. In triaxial tests the main fracture exhibits inclined shear failure (Figure 6b). The inclination angle (to axis of specimen) increases with an increase of confining pressure. Stress-strain curves for uniaxial tests remain linear until very close to the peak (Figure 2). Nonlinearity increases with increasing confining pressure (Figures 3-5).
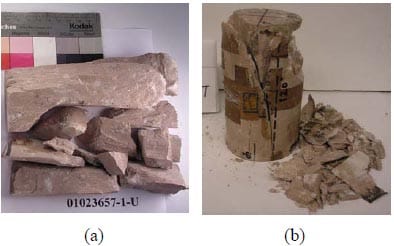
Fig. 6. Specimens after failure: (a) After uniaxial test, longitudinal splitting dominates the failure mode. Specimen ID: 01023657-1-U (stress rate = 0.3805 MPa/s); (b) After triaxial test, shear failure. Specimen ID: 01026241-1-T (stress rate = 0.0035 MPa/s, confining pressure = 5 MPa).
3.2. Stress rate dependence of volumetric strain at failure
Given each stress rate and each confining pressure, volumetric strain at failure versus confining pressure and versus stress rate are plotted in Figures 7 and 8, respectively. To investigate the combined effects of confining pressure and stress rate on volumetric strain at failure, multivariate regression is performed. Eq. (2) is the regression equation that best describes the relationship among them.
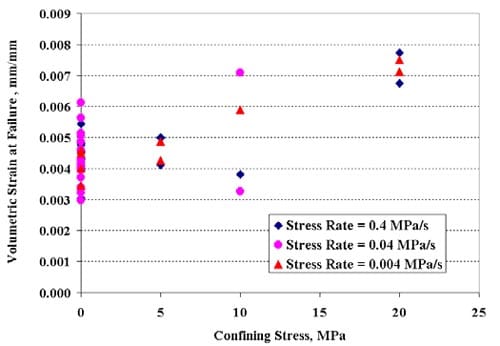
Fig. 7. Volumetric strain at failure as a function of confining pressure for each stress rate.
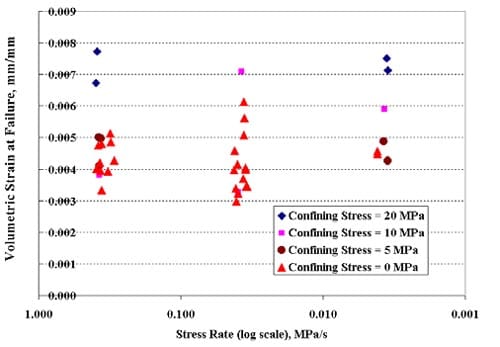
Fig. 8. Volumetric strain at failure as a function of stress rate for each confining pressure.
![]()
where δ denotes stress rate. In Eq. (2), volumetric strain at failure increases with an increase of confining pressure in an exponential law and decreases slightly with an increase of stress rate following a power law.
Eq. (2) was estimated using nonlinear regression. The results of the tests with strain measurement in Table 1 were used in the estimation. This regression was conducted using PROC NLIN with Marquardt algorithm in SAS (Version 8.2) program [7]. The PROC NLIN is a procedure to find least squares estimates of coefficients for nonlinear models. The Marquardt algorithm is a direct numerical search method.
In Eq. (2) student t-tests indicate that the coefficient of the whole term in the right hand side and the coefficient of δ3 are significantly different from zero at the 95% confidence level (both P-values < 0.0001), the exponent of δ is not (P-value = 0.8, greater than 0.05). Pseudo-R-square for Eq. (2) is 0.52. This value explains the proportion of variance accounted for in the dependent variable by the model. It is equivalent to the R-square, the coefficient of determination, in linear regression.
3.3. Stress Rate dependence of Young’s modulus and Poisson’s ratio
Brittle failure of the tuff results from crack development [3]. Crack development causes dilatancy [6]. Dilatancy is an inelastic increase in volume due to fracturing. With an increase of confining pressure, more restriction is applied to decrease the dilatancy of a specimen. For a given confining pressure, the longer a specimen takes to fail, the more fatigue crack development and propagation will be created in the specimen. Dilatancy therefore gets larger.
Figures 9 and 10 give a plot of Young’s modulus versus stress rate and a plot of Poisson’s ratio versus stress rate at each confining stress level. Young’s modulus and Poisson’s ratio were calculated according to ASTM 3148 [8]. Eqs. (3) and (4) are the best estimates of their relations. The equations were estimated using the same method as in section 3.2.
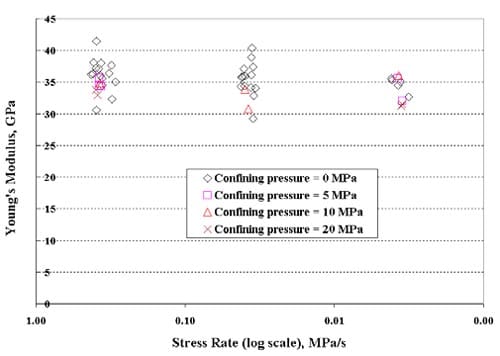
Fig. 9. Young’s modulus as a function of stress rate for four confining pressures.
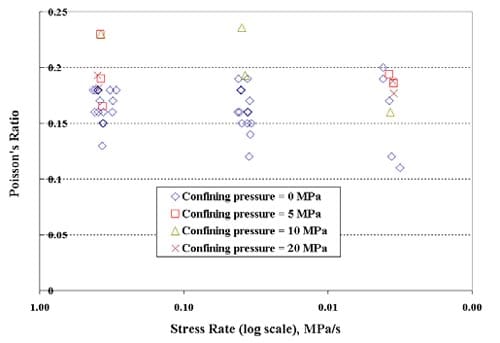
Fig. 10. Poisson’s Ratio as a function of stress rate for four confining pressures.

Calculation 3 and 4
In Eq. (3) the 36.41 factor on the right hand side (P value < 0.0001) and the coefficient of δ3 (P-value = 0.0073) are significantly different from zero at the 95% confidence level, the exponent of δ is not (P-value = 0.11, greater than 0.05). Pseudo-R-square is 0.22.
Young’s modulus decreases with an increase in confining pressure, and increases slightly with an increase in stress rate. The former is the opposite from the observation by Li et al. [9] for the Bukit Timah granite of Singapore. They reported that Young’s modulus seems to increase slightly with increasing confining pressure.
From Eq. (4), Poisson’s ratio increases with confining pressure and increases slightly with stress rate. The coefficient of the whole term in the right hand side (P value < 0.0001) and the coefficient of δ3 (P-value = 0.0033) are significantly different from zero at the 95% confidence level, the exponent of δ is not (P-value = 0.22, greater than 0.05). Pseudo-R-square is 0.19.
3.4. Stress rate dependency of differential axial stress at failure
Differential axial stress at failure increases with confining pressure and stress rate as shown in Figures 11 and 12. The brittle strength increases at higher confining pressure, because it becomes more difficult for microcracks to open and propagate. The dependency of differential axial stress on stress rate and confining st
ress can be best described by a power law (e.g. [10, 11, 12]) as in Eq. (5). Eq. (5) is the best estimation for the test results. When δ = 1, Eq. (5) is an expression of the relation between differential axial stress at failure and confining pressure at standard loading rate specified in ASTM 2938 [13]. If δ3 = 0, Eq. (5) reduces to the case of stress rate dependency under uniaxial compression. The intercept in the parenthesis is the average uniaxial strength of the tuff at standard loading rate.
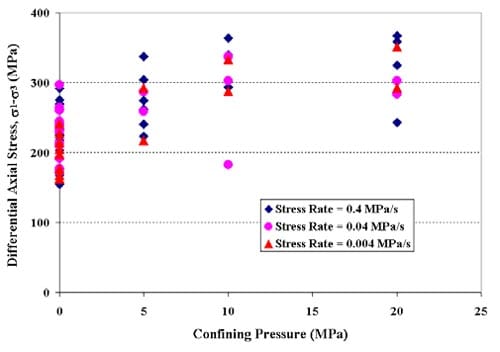
Fig. 11. Differential axial stress as a function of confining pressure for each stress rate.
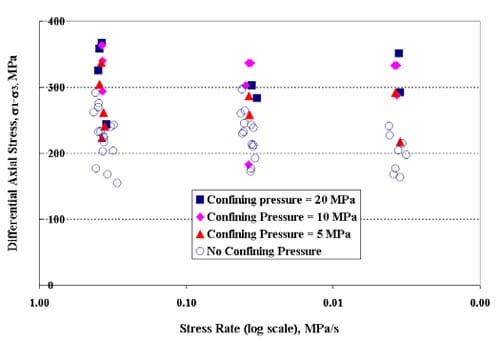
Fig. 12. Differential axial stress as a function of stress rate for each confining pressure.
Calculation 5
Eq. (5) was estimated using the same procedure described in sections 3.2 and 3.3. Student t-tests indicate that the coefficient and the exponent of δ3 in Eq. (5) are significantly different from zero at the 95% confidence level (P-value = 0.05 for coefficient, P-value = 0.04 for exponent), but the exponent of δ is not (P-value = 0.2, greater than 0.05). Pseudo-R-square for Eq. (3) is 0.52. Figure 13 shows a 3-D plot of Eq. (5).
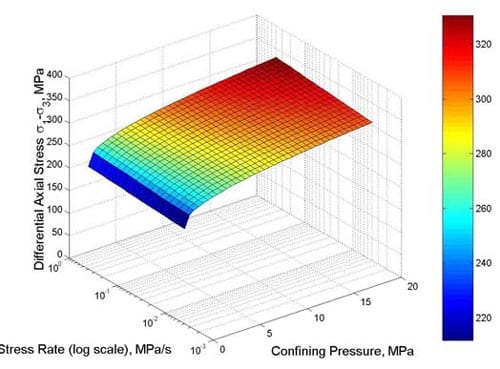
Fig. 13. Differential axial stress as a function of confining pressure and stress rate.
Conclusions
- Brittle failure was observed in uniaxial compression tests at all stress rates.
- Volumetric strain at failure increases with an increase of confining pressure following an exponential law and decreases slightly with an increase in stress rate according to a power law.
- Young’s modulus decreases with an increase in confining pressure following an exponential law and increases slightly with an increase of stress rate following a power law.
- Poisson’s ratio increases with confining pressure following an exponential law and increases slightly with stress rate following a power law.
- Differential axial stress at failure increases with confining pressure and stress rate according to a power law.
- These conclusions have to be tempered and qualified by the fact that the data set is small, the rock properties are highly variable, and hence the resulting statistical significance is marginal, at best.
Acknowledgments
We thank mr. Jaime gonzalez, doe contract manager and mr. Rick blitz for experimental work.
This paper was prepared by university of nevada reno pursuant to a cooperative agreement fully funded by the united states department of energy, and neither university and community college system of nevada nor any of its contractors or subcontractors nor the united states department of energy, nor any person acting on behalf of either:
Makes any warranty or representation, express or implied, with respect to the accuracy, completeness, or usefulness of the information contained in this report, or that the use of any information, apparatus, method, or process disclosed in this report may not infringe privately-owned rights; or
Assumes any liabilities with respect to the use of, or for damages resulting from the use of, any information, apparatus, method or process disclosed in this report. Reference herein to any specific commercial product, process, or service by trade name, trademark, manufacturer, or otherwise, does not necessarily constitute or imply its endorsement, recommendation, or favoring by the united states department of energy. The views and opinions of authors expressed herein do not necessarily state or reflect those of the united states department of energy.
References
- OCRWM (Office of Civilian Radioactive Waste Management). Website: https://www.ocrwm.doe.gov, September 2004.
- OCRWM. 1999. Geology of the ECRB Cross Drift-Exploratory Studies Facility, Yucca Mountain Project,Yucca Mountain, Nevada, Bureau of Reclamation and U.S. Geological Survey, Denver, Colorado.
- Ma, L. and J.J.K. Daemen. 2006. Strain Rate Dependent Strength and Stress-Strain Characteristics of a Welded Tuff. Bull. Eng. Geol.Env., https://dx.doi.org/10.1007/s10064-005-0038-6.
- ASTM D 2664 Standard Test Method for Triaxial Compressive Strength of Undrained Rock Core Specimens without Pore Pressure Measurements. In Annual Book of ASTM Standards, Section 4, Construction. Volume 04.08 Soil and Rock; Building Stones. American Society for Testing and Materials, Philadelphia.
- Walsh, J. B. 1965. The Effect of Cracks on the Uniaxial Elastic Compression of Rocks. J. Geophys. Res. 70: 2, 399-411.
- Brace, W. F., B.W. Paulding, Jr., and C.H. Scholz. 1966. Dilatancy in the Fracture of Crystalline Rocks. J. Geophys. Res. 71: 16, 3,939-3,953.
- Fernandez G. 2003. Data Mining Using SAS Applications. Chapman & Hall/CRC.
- ASTM D 3148, Standard Test Method for Elastic Moduli of Intact Rock Core Specimens in Uniaxial Compression. In Annual Book of ASTM Standards, Section 4, Construction. Volume 04.08 Soil and Rock; Building Stones. American Society for Testing and Materials, Philadelphia.
- Li, H.B., J. Zhao and T.J. Li. 1999. Triaxial Compression Tests on a Granite at Different Strain Rates and Confining Pressures. Int. J. Rock Mech. Min. Sci., Technical Note. 30, 1057-1063.
- Bieniawski, Z.T. 1974. Establishing the Strength of Rock Mechanics, J. South African Inst. Min. Metallugy. 74, 312-320.
- Goodman, R. E. 1980. Introduction to Rock Mechanics. John Wiley & Sons, New York, p.88.
- Brady, B.H.G. and E.T. Brown. 1985. Rock Mechanics for Underground Mining, George Allen & Unwin, London, p110.
- ASTM D 2938, Standard Test Method for Unconfined Compressive Strength of Intact Rock Core Specimens. In Annual Book of ASTM Standards, Section 4, Construction. Volume 04.08 Soil and Rock; Building Stones. American Society for Testing and Materials, Philadelphia.
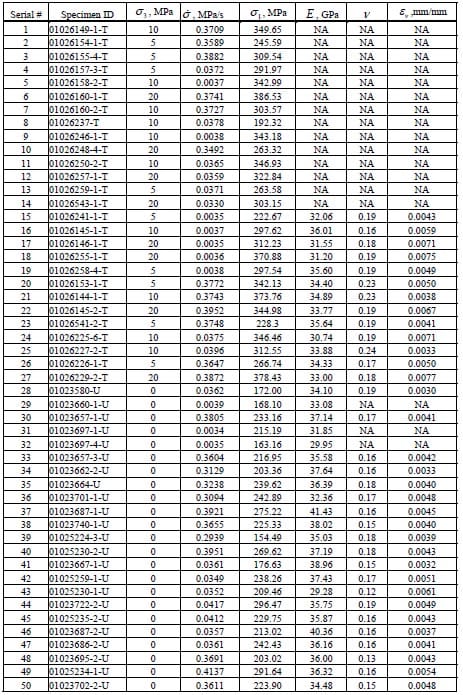
Table 1. Summary of triaxial and uniaxial compression test results
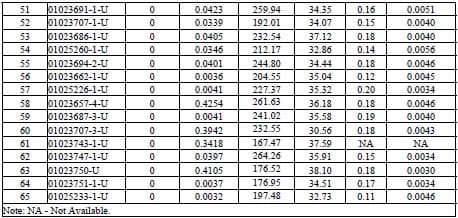
Table 1. Summary of triaxial and uniaxial compression test results
Lithophysal Porosity Effect on Mechanical Properties of Welded Topopah Spring Tuff
Lumin Ma1 and Jaak J.K. Daemen2
1. Vector Engineering, Inc., 143E Spring Hill Dr., Grass Valley, CA 95945, USA, Tel: (775) 771-0899; Email: [email protected]
2. Department of Mining Engineering, University of Nevada, Reno, Reno, Nevada, USA, Tel: (775) 784-4309; Email: [email protected]
Abstract
About 81% of the proposed repository for the permanent disposal of high-level radioactive nuclear waste will be situated in the lower lithophysal unit of the Topopah Spring welded tuff (Tptpll), Yucca Mountain, Nevada, USA, and 4% will be in the upper lithophysal unit (Tptpul). Lithophysae or lithophysal cavities are a major feature in these units (Figure 1). Influence of the lithophysal cavities on properties of the welded tuff was in
vestigated in this study. Seven cylindrical tuff specimens from Tptpll and twelve from Tptpul were tested in uniaxial compression. It was found that both uniaxial compressive strength and elastic modulus decrease with an increase in lithophysal porosity. The relationships between both strength and elastic modulus versus lithophysal porosity can be described with power functions and exponential functions. Exponential fitting has a slightly higher R-square (Figure 2). Sensitivity analysis indicates that sensitivity of strength to porosity is greater than sensitivity of elastic modulus to porosity. The difference between these two results from the dependency of peak axial strain on porosity according to the relationship among strength, strain at failure and elastic modulus. Thus, all three parameters decrease with an increase in lithophysal porosity.
Failure of the tuff specimens exhibited less brittle behavior, certainly for the second and later loading/unloading cycles, and especially as compared to nonlithophysal tuffs, with an increase in porosity. Figure 3 shows failed specimens. Loading/unloading cycles were applied to several specimens (Figure 4). The specimens memorize the unloading stress in the previous cycles before the specimens lost elasticity. A memory loss starts in the third cycle (Figure 4c).
Numerical analysis was conducted to simulate these dependencies using FLAC3D. The results were compared with studies performed by other investigators.
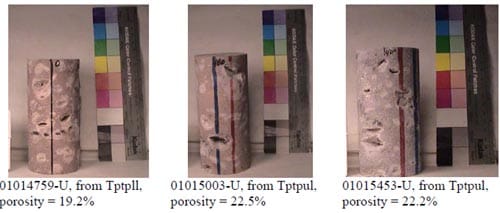
Figure 1 – Welded tuff specimens (61 mm diameter) containing lithophysal cavities
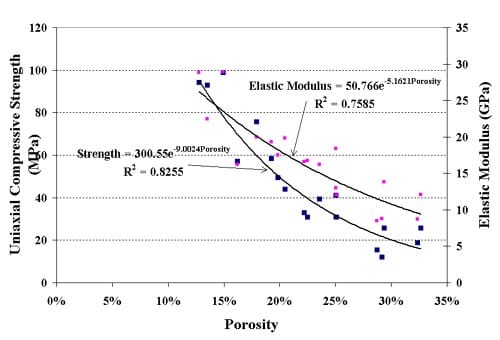
Figure 2 – Uniaxial compressive strength and elastic modulus as exponential functions of lithophysal porosity
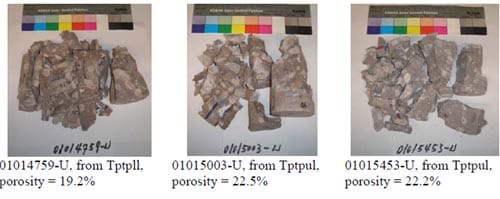
Figure 3 – Tuff specimens after failure (61 mm diameter)
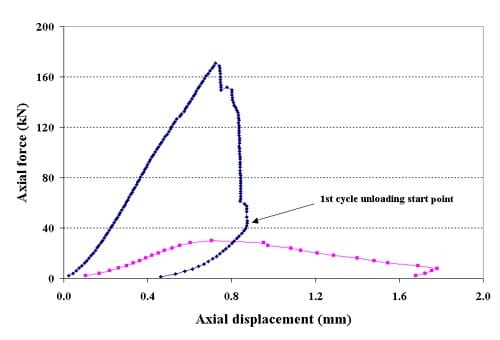
Figure 4 – Curves of force-displacement with 2 to 4 loading/unloading cycles
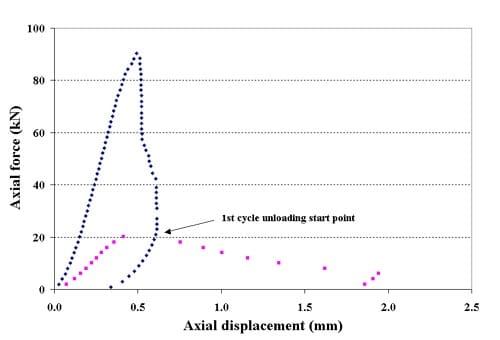
Figure 4 – Curves of force-displacement with 2 to 4 loading/unloading cycles
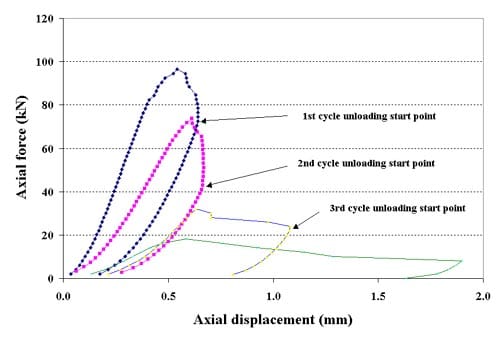
Figure 4 – Curves of force-displacement with 2 to 4 loading/unloading cycles


