Article
Related Links
Peyman Taheri*, Mechatronic Systems Engineering, School of Engineering Science, Simon Fraser University, Surrey, BC, Canada, V3T 0A3, Email: [email protected]
Scott Hsieh, Electronics Engineering, School of Engineering Science, Simon Fraser University, Burnaby, BC, Canada, V5A 1S6, Email: [email protected]
Majid Bahrami, Mechatronic Systems Engineering, School of Engineering Science, Simon Fraser University, Surrey, BC, Canada, V3T 0A3, Email: [email protected]
Abstract
Lithium-ion (Li-ion) batteries are favored in hybrid-electric vehicles and electric vehicles for their outstanding power characteristics. In this paper the energy loss due to electrical contact resistance (ECR) at the interface of electrodes and currentcollector bars in Li-ion battery assemblies is investigated for the first time. ECR is a direct result of contact surface imperfections and acts as an ohmic resistance at the electrode-collector joints. ECR is measured at electrode connections of a sample Li-ion battery, and a straightforward analysis is presented to evaluate the relevant energy loss. Through the experiments, it is observed that ECR is an important issue in energy management of Li-ion batteries. Effects of surface imperfection, contact pressure, joint type, collector bar material, and interfacial materials on ECR are highlighted. The obtained data show that in the considered battery, the energy loss due to ECR can be as high as 20% of the total energy flow in and out of the battery under normal operating conditions. However, ECR loss can be reduced to 6% when proper joint pressure and/or surface treatment are used. A poor connection at the electrode-collector interface can lead to a significant battery energy loss as heat generated at the interface. At sever conditions, heat generation due to ECR might cause serious safety issues, thermal runaway, sparks, and even melting of the electrodes.
1. Introduction
Hybrid electric vehicles (HEVs) and electric vehicles (EVs) are emerging as the most promising solutions for near-term sustainable transportation [1, 2]. The environmental impacts of conventional internal combustion engines (ICE) [3, 4], e.g., greenhouse gas and air pollution emissions, beside economical issues associated with petroleum-based fuels [3], e.g., price fluctuations due to increasing demand and limited supply, are among the major motivations in development of hybrid-electric powertrains.
While EVs completely rely on power supply from electrical storage system (batteries); in HEVs, combination of ICE and batteries’ power provides the propulsion in the hybrid drivetrain. Compared to conventional vehicles, the ICE in the HEV is smaller [5], which is utilized under sever conditions with its near-maximum efficiency, i.e., for high-power acceleration and for charging the batteries. On the other side, the batteries are responsible for power supply at low power demand, where efficiency of the ICE would be poor. Moreover, the energy during braking the vehicle, which is dissipated as heat in conventional braking systems, is stored into the HEV battery for reuse, i.e., regeneration [6]. Accordingly, the performance of HEVs and EVs strongly depends on the efficiency and reliability of the batteries.
Recent leaps in battery technology [7, 8] allow a significant increase in the electrification degree in HEVs. Among the new generation of batteries, polymer-based lithium-ion batteries have attracted a great deal of interest. Lithium is the lightest of metals; it floats on water, and also has the greatest electrochemical potential which makes it one of the most reactive metals [8]. Referring to these properties, lithium-based batteries offer a high energy and power densities. Furthermore, their high voltage, low-self discharge rate, and good stability make them suitable for automotive and standby power applications. Advanced Li-ion batteries offer energy storage density of 150 Wh·kg-1, power density of 2,000W·kg-1, with energy conversion efficiency of 95% and higher [2].
Energy management and optimization of battery packs in HEVs is a critical task in all hybrid powertrains, as it directly affects the cost, weight, safety, efficiency, and reliability of hybrid systems [9]. In general, energy management issues in batteries with high power density fall into two categories; electrical and thermal. Although thermal and electrical managements are different scenarios, the thermal and electrical characteristics of batteries are highly coupled [10]. This coupling turns the overall battery energy management into a challenging task, particularly at extreme operating conditions. It is known that under high discharge rates which involve quick electrochemical reactions, batteries are prone to excessive temperature rise that can initiate electrolyte fire, thermal runaway, and, in the worst case explosion [11, 12]. Furthermore, at cold temperatures, below freezing, the energy and power delivery of Li-ion batteries diminish [11].
In the context of energy management for advanced batteries, minimization of energy losses in battery assemblies can play a prominent role. These energy losses can be divided into internal and external losses.
A portion of internal losses is associated with ohmic heating due to the electrical current flow through electrodes [13], and the rest is the heat generation as a result of charge transfer at the electrode/electrolyte interface, i.e., electrochemical reaction [10, 14].
Electrical contact resistance (ECR), at the contact interface between the electrodes and current-collector bars in battery assemblies, is a significant external loss, which to the authors’ knowledge, has been overlooked in energy management of hybrid and electric vehicles. In addition to potentially significant energy loss, ECR in extreme cases can lead to temperatures that can melt the battery electrodes and collector bars, a phenomenon similar to spot welding.
In the present paper, we attend to investigate and shed light on the importance of ECR in energy management of Li-ion batteries in EVs and HEVs. A custom-designed testbed has been built to measure the ECR at the interface of electrodes and current-collector bars of a sample Li-ion battery. The joints considered in this study are bolted joints. The effects of collector bar material, surface characteristics (surface roughness and outof- flatness), contact pressure, joint type, and applicat
ion of interfacial electrically conductive material (IECM) on ECR are thoroughly investigated. Our experimental results indicate that, for a typical bare electrode-collector joint at relatively low contact pressure, ECR loss can be as high as 20% of the total energy flow in and out of the battery. However, by selecting proper surface treatment, joint pressure, and applying IECM (electrical grease), the loss due to ECR will be reduced to less than 7%.
2 Theoretical Background
The multidisciplinary study of the thermal/electrical contact resistance (T/ECR) in modern engineering is significant [15, 16]. A contact is defined as the interface between the current-carrying members of a device. The primary purpose of a contact is to allow an uninterrupted passage of heat/electric current across the contact interface. In this paper, on account for the considered problem, only separable stationary contacts, i.e., mechanical joints of bolt-and-nut type, are studied.
Despite the differences in the nature of thermal and electrical processes, they exhibit similar interfacial phenomena, particularly, contact resistances [17, 18]. However, the focus of this study is on electrical contact resistance. In order to highlight the importance of contact resistance, we consider two electrically conductive bodies, which are in contact under an applied force F, see Fig. 1(a). In Fig. 1(b) surfaces irregularities are schematically shown in a magnified portion of the contact interface. Owing to the surfaces roughness and their out-of-flatness, the contact between two bodies occurs only at discrete spots which are formed by the mechanical contact of asperities on both surfaces [19]. Accordingly, the real contact area Ar at the interface, the summation of the scattered contact spots, forms only a small percentage of the apparent (or nominal) contact area Aa, often less than 2%.
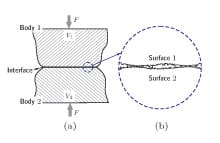
FIGURE 1. Schematic presentation of a stationary electrical contact.
(a) Macroscopic presentation of contact bodies with different voltages.
(b) Microscopic presentation of the contact surface characteristics, i.e.,
roughness and out-of-flatness.
Far from the interface the voltage in body 1 and body 2 are V1 and V2. The voltage difference causes an electric current from the high voltage body to the low voltage one. At the interface, the electric current lines bundle together to pass through the discrete microcontact spots, see Fig. 2(a). Convergence of electrical flow as a result of the microcontact spots reduces the volume of material used for electrical conduction, and causes electrical contact resistance (ECR). It is shown in Ref. [20] that splitting of the bulk current over contact spots depends on the size (area) and also the relative distance of the contact spots. In Fig. 2(b) the corresponding electrical resistance network is shown. The contact resistances at the contact spots, Rc, act as parallel resistances, which align with bulk resistances, Rbu, in series. Bulk resistances in body 1 and 2 arise due to electrical resistivity of their materials.
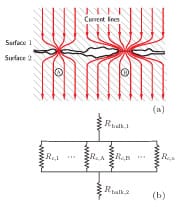
FIGURE 2. (a) Schematic presentation of conductive paths for electrical
current in the contact interface of rough surfaces. Constriction and
spreading of current lines rise to contact resistances at the interface. (b)
The total resistance is the combination of bulk resistances and contact resistances.
In a general form, where n contact spots exist, the total resistance reads

Electrical contact resistance analysis involves three major components: (i) surface topology, (ii) contact mechanics and (iii) electrical transport. Components (i) and (ii) are coupled since the contact mechanic analysis strongly depends on surfaces topology and the applied force [19]. Moreover, in the case of significant heat generation at the interface, the materials properties alter, and consequently the surface topology and contact mechanic.
The electrical contact resistance may be reduced by several methods including:
- Increasing the real contact area, accomplished by i) increasing the contact pressure, or ii) reducing the roughness and out-offlatness of the contact surfaces,
- Bounding (e.g., brazing) the contact surfaces,
- Using interfacial electrically conductive materials (IECM), also known as electrical grease or electrical contact lubricant, that can conform to the imperfect surface features of the mating surfaces. These materials are usually used in the power industry to reduce electrical contact resistance in the joints. They might also include some materials to prevent corrosion deposits in electrical connectors for easier maintenance.
Manufacturing highly finished surfaces is not practical due to cost restrains. Brazing creates a permanent joint that makes the maintenance difficult. Moreover, due to vehicle vibrations, brazed joints are susceptible to loosening, and eventually fatigue failure. Failure of the joints will dramatically increase the ECR and the chances for sparking, which eventually leads to inoperative battery system. Also, load constraints make it unfeasible to use high contact pressures. Therefore, the use of interfacial electrically conductive materials (IECM) at a moderate contact pressure seems to be a suitable option for the battery assemblies in HEVs and EVs application.
3. Battery Assembly
A battery pack in EVs and HEVs is typically divided into battery modules, and each module contains several battery cells that are connected in parallel and/or series. A polymer lithiumion battery cell (EIG C020, South Korea) is shown in Fig. 3(a). To make the cell connections, brass (c2680 composition) brackets are attached to the battery electrode tabs, see Fig. 3(b). The current-collector bars, shown in Fig. 3(c), are designed to connect battery electrodes via brackets. Copper made (from copper 110) collector bars (provided by Future Vehicle Technologies Inc., Canada) with 3.15 mm thickness were manufactured using water jet cutter, while the brass collector bars (purchased from EIG, South Korea) have a thickness of 1.5 mm. The thick copper collector bars are designed for high-current connections, since they allows more electrical currents and lead to less ohmic resistance and heat generation.
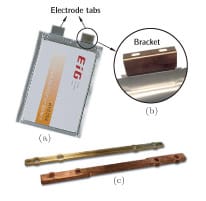
FIGURE 3. (a) A unit cell of EIG C020 Li-ion batteries with bare
electrode tabs. (b) Brass brackets attached to battery electrodes. (c)
Current-collector bars made of copper and brass with different thicknesses
are used to connect electrode brackets using bolts and nuts.
Bolts and nuts are used to assemble the collector bars on the electrode brackets. For convenience, the electrode brackets and collector bars will be referred to as electrodes and collectors, respectively. In Fig. 4, the bolted joint between an electrode and a copper collector is shown. In battery assemblies for EVs and HEVs several hundreds of such joints exist.
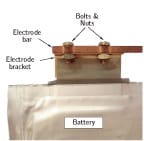
FIGURE 4. Bolts and nuts joint between an electrode bracket and a copper collector bar.
The battery uses Li [NiCoMn ]O2-based cathode and graphite-based anode. The nominal voltage and capacity of the battery are 3.65 V and 20 Ah = 72000 C, with specific energy of 175 Wh·kg-1. The battery weights ab
out 425 g, then the power of the cell is about 73 W. The experimental results on cell potential as a function of cell capacity at different discharge rates, which are reported by the manufacturer, are shown in Fig. 5.
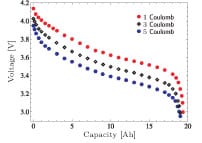
FIGURE 5. Experimental data on discharge curves of the battery for 1 C, 3 C, and 5 C discharge rates.
4. Experimental Studies
An experimental study was conducted to measure ECR at the battery assemblies. For this purpose a testbed was designed and built, and a test procedure was developed. The effects of contact parameters on ECR are investigated. Surface roughness of the electrodes and collectors are measured. Also, the effects of surface out-of-flatness and bolts-and-nuts joint on the contact pressure distribution are qualitatively examined using pressure sensitive film. The following sub-sections provide more details of the conducted experimental studies.
4.1 Surface Roughness Measurement
Surface roughness is a measure of the texture of an engineering surface. Roughness plays a key role in determining how surfaces interact when brought into contact, cf. Fig. 2.
Surface profiles of electrodes and collectors were measured using a stylus profilometer (Mitutoyo SJ-400, Japan). In Fig. 6 a sample two-dimensional surface profile is shown. The plot represents the real surface profile for a copper collector; note the difference in the vertical and horizontal scales. The measurement length is 5 mm and z(x) represents the vertical deviations of a real surface from its mean plane, i.e., z(x) = 0.
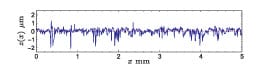
FIGURE 6. Surface profile measurement of a sample copper collector bar.
A widely used parameter to present the roughness of a surface is arithmetic average of the measured profile height deviations, defined by [19]

In actual measurements discrete values of xi, and z(xi) are obtained with 1>i>N, where N is the total number of measurement readings. The values of Ra for electrodes and collectors are calculated from surface measurements, which allow quantitative comparison of the roughness of contact surfaces in the battery assembly.
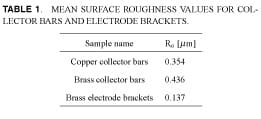
We used eight collectors, four copper and four brass, and also a pair of electrodes to perform the surface measurements. The surface of the collectors was treated by manual polishing and lapping. Surface measurements for a pair of electrodes and collectors were performed at several locations with different directions randomly. The mean measured values (Gaussian distribution) of surface roughness for the collector bars and electrode brackets are listed in Table 1. During surface measurements, it was noted that the roughness was not fully isotropic and has slightly different values in specific directions.
The surface measurements revealed that the brass collectors were rougher than copper ones, and electrodes in general were considerably smoother than the collectors.
4.2 Pressure Distribution in the Contact Area
In addition to microscopic surface irregularities (roughness), macroscopic curvatures (out-of-flatness) are common in engineering surfaces, mostly as a result of manufacturing processes. In Fig. 7 surface profile of a copper collector is depicted. There are holes on the collectors [cf. Fig. 3(c)], and as shown in Fig. 7, an out-of-flatness in the order of 10 /mum can be observed close to the hole. This sample was fabricated by a water jet cutting process. In general, out-of-flatness can be created as a result of a variety of processes such as drilling, cutting, bending, and twisting during different stages of production/assembly procedure.
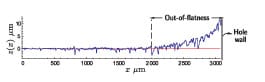
FIGURE 7. Surface profile measurement for a copper collector bar is
shown. Out-of-flatness over a portion of surface near the hole is in the order of 10 µm.
When electrode brackets and collector bars are brought into contact, out-of-flatness leads to nonconforming contact areas at the interface. In the nonconforming regions, pressure distribution is not uniform. In such cases, pressure distribution strongly depends on the position and size of the macroscopic surface out-of- flatness and elastic and plastic properties of the mating surfaces [19].
As shown in Fig. 4, the electrode-collector interface is a bolted joint, which yields an uneven pressure distribution; the pressure has its maximum near the holes. In Fig. 8(a) qualitative contact pressure distribution on a pressure sensitive film (Pressurex, USA), sandwiched between the electrode and the collector, is shown for brass and copper sample collectors. The red (dark) dots/regions indicate the real contact spots. Figure 8(a) clearly shows the non-conformity of a bolted joint. Note that even at a highly tightened joint, a significant portion (white/bright area) of the nominal contact area is not in contact. Using the pressure sensitive film result, which is a twodimensional pressure distribution, one can suggest an approximate one-dimensional pressure distribution, see Fig. 8(b). This approximate pressure distribution can be used to develop a more realistic contact mechanic model for a bolted joint.
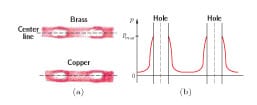
FIGURE 8. (a) Pressure distribution in the contact between electrode
brackets and collector bars is qualitatively shown using pressure sensitive
film. The color intensity is directly related to the amount of pressure.
(b) Schematic presentation of pressure distribution across the centerline
of the contact surface of a bolted joint. Maximum pressure pmax
occurs in the vicinity of holes.
4.3 Electrical Contact Resistance (ECR) Measurement
Figure 9 shows the circuit designed to measure ECR at the battery electrode-collector joints. Instead of an actual battery, we used an DC power supply (GW Instek, GPS-4303, Taiwan) tuned to deliver a constant current I = 1.5 A. Replacing an actual battery with a constant current supplier is consistent with real battery operation condition, as shown in experimentally obtained discharge curves, see Fig. 5. The current supplier was connected to electrodes (brackets), as shown in the diagram. One of the electrodes was connected to ground through a known (shunt) resistance, Rsh = 2.5 O. A current-collector bar was used to bridge the electrode brackets. As a result of electrical current through the collector a voltage drop was established and measured between the electrode brackets. A minor portion of this voltage difference is related to the bulk resistance in the electrodes and the collector, but ECR at their interfaces is the major contribution to this voltage drop.
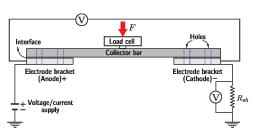
FIGURE 9. Schematic presentation of the circuit designed to measure
electrical contact resistance between the electrode brackets and the
collector bars in a battery (cell) assembly.
The contact between the electrodes and the collector was sustained by either applying a force, F, on the load cell, or using nuts and bolts. The contact area improves as the force F increases or bolts are tightened.
The total resistance corresponding to the mea
sured voltage drop, which is almost equal to contact resistance, reads

where, ΔVe is the measured voltage drop across the electrodes and I is the supplied current. To assure that supplied current is correct, voltage across the shunt resistance, ΔVsh, was measured, then the current evaluated as I = ΔVsh/Rsh.
The actual test apparatus is shown in Fig. 10. In measurements, a collector was aligned over the electrodes, under the applied force which was measured using a load cell [cf. Fig. 9], or was bolted to the electrodes. The thick supporting brackets on the sides of the testbed are used to enforce the structure and prevent bending at higher loads.
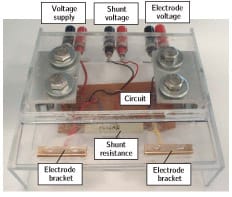
FIGURE 10. The testbed for electrical contact resistance measurements.
The connection terminals are located on the back side.
4.4 Power Loss Evaluation
The measured electrical contact resistance, Rc, and the current drawn from the battery, Ib, are associated with an ohmic loss at the interface

This electrical energy loss appears as heat, generated at the electrode-collector interface. Based on Eq. (4), larger battery currents lead to higher heat generation rates. Accordingly, at large discharge/charge rates, thermal analysis at the electrodes is important.
5. Results and Discussion
Electrical contact resistance at different pressures is measured for both copper and brass collectors, and the corresponding ohmic loss is evaluated. The measurements were performed in two conditions, i) bare or ‘dry’ contact; and ii) ‘wet’ contact, i.e., an interfacial electrically conductive material (IECM) was applied at the interface. Koper-shield joint compound (Thomas & Betts, USA) is employed as IECM, which is a homogenized blend of pure, polished colloidal copper to improve electrical conductivity at electrical joints. It also includes components to lubricate the joints and prevent rust and corrosion.
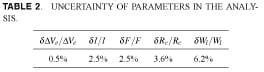
5.1 Uncertainty Analysis
As given by Eq. (3), ΔVe and I are the electrical parameters measured in our experiments. Also, contact load F, and the apparent contact surface Aa, are the relevant quantities which are measured to define the contact pressure.
The total accuracy in our ECR measurements is evaluated according to the accuracy of the employed instruments. The accuracy of voltage and current readings are 0.5% and 2.5%, respectively (Extech 430 multimeter). The accuracy of the load cell is 2.5% (Transducer Techniques LB0-500). The mentioned accuracy values are given with respect to the instruments readings, and not the maximum value of the readings. The error associated to the measurement of contact area is very small, hence it is not included in the analysis.
Since ECR as an explicit function of ΔVe, I, and F is not available, the maximum uncertainty for the ECR measurements can be approximated from [21]

which for the presented study is estimated to be ±3.6%. With regard to Eq. (4), uncertainty in power loss measurements is

that leads to ±6.2%. The uncertainties associated to the measured parameters are listed in Table 2.
5.2 Electrical Contact Resistance Results
Top plots in Fig. (11) show ECR measurements for a copper collector with a total nominal contact area of 364 mm² (on both electrodes). The bottom plots are for the brass collector with a total nominal contact area of 354 mm². The contact pressure was applied by a force over the load cell (contact with uniform pressure). The applied pressure was varied from 0 to around 0.3 MPa. Due to uniqueness of each collector in terms of surface characteristics, experiments with different collectors yield results with slightly different magnitudes. The presented results correspond to the selected collectors and electrodes. See Table 1 for surface roughness of the collectors and electrodes used in the experiments. In order to assure the consistency of measurements, several tests were performed and the values were averaged.
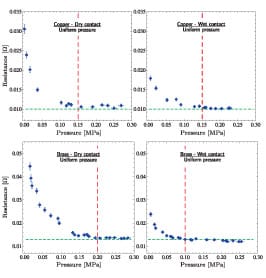
FIGURE 11. Electrical contact resistance measurements at different
pressures for copper (top plots) and brass (bottom plots) collector bars
are shown. Measurements were performed for dry (left) and wet (right)
contact conditions when electrically conductive paste (Koper-shield)
was applied at the contact interface. The error bars represent 3.6% error
in ECR and 2.5% error in pressure measurements.
The results show the dependency of ECR on pressure and contact condition (wet or dry). While at high pressures ECR is a constant, at low contact pressures (loose contacts) it strongly depends on the contact pressure variation and surface treatment. The results confirm that application of IECM effectively decreases ECR. For example, for the copper case, when p < 0.15 MPa, ECR is not a function of pressure and the contact conditions. However, at low pressures, ECR significantly decreases as the load increases. The results for brass show that for p > 0.1 MPa, ECR drops by 50% when the IECM is used. Since roughness of the copper collector is smaller than the brass one (see Table 1), and copper is electrically more conductive than brass, it exhibits lower values of electrical resistance at the interface, as shown in the results.
5.3 Power Loss Due to ECR
To evaluate ohmic losses at the electrodes, we assume discharge current and voltage for the battery cell to be Ib =20 A, and the nominal voltage Vb = 3.65 V, respectively. In reality, values of the operating voltage and current depend on the battery properties, battery management system (BMS), and vary with driving conditions. However, the above assumed values for cell voltage and current are reasonable approximations, since the nominal battery power is recovered Wb=IbVb=73W, corresponding to a discharge time of one hour. Moreover, ECR is only a function of contact pressure and surface characteristics; therefore, the electrical state of the battery in operation does not affect the values of ECR.
Figure (12) shows ohmic losses due to ECR at the electrodecollector interface, measured for copper (top plots) and brass (bottom plots) collectors for uniform pressure, bolted, wet, and dry joints. The pressure is normalized with a reference pressure (p0 = 0.34 MPa for copper and p0 = 0.42 MPa for brass) and power loss percentage is obtained with respect to the battery power output (73 W). The circles in the plots correspond to data for bolted joints, while the diamonds are for uniform pressure contacts as shown in Fig. (9). Results for bolted and uniform pressure contacts are in fair agreement. In order to scale the pressure in the bolted contacts, we measured ECR at the joint for different states of the bolts from loose to tight. The state beyond which ECR becomes independent of pressure was taken as the reference point to map the other states into the pressure.
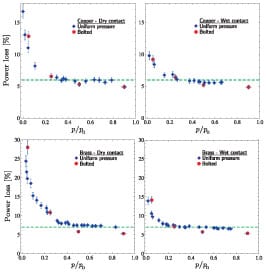
FIGURE 12. Percentage of power loss versus normalized pressure at
the electrode-collector contacts of a single battery with nominal power
of 73 W is shown. The data are obtained for copper (top plots) and
brass (bottom plots) collectors in uniform pressure (diamonds), bolted
(circles), dry (left plots), and wet (right plots) contacts. The error bars
represent 6.2% error in loss and 2.5% error in pressure measurements
The trend for ohmic losses is very similar to that of the electrical contact resistance, since for a given current, energy loss at the contact linearly depends on the ECR only [cf. Eq. (12)]. The results for the copper collector show that in low-pressure contacts (relatively loose joints) energy loss is about 16% and 10% of the battery power, for dry and wet contacts, respectively. Energy losses for the brass collector are larger; 25% and 15% for dry and wet joints. At high-pressure contacts the ECR losses drop to 6-7% of the total battery power output.
6. Conclusions
Electrical contact resistance occurs at the electrode connections of batteries and it forms a significant external loss mechanism in lithium-ion battery assemblies. At the presented work, an experimental study was conducted to show the effects of surface geometry, contact pressure, joint type, material, and interfacial materials on contact resistance; the results of this study can be summarized as:
- Surface geometry (roughness and out-of-flatness) measurements of the contact surfaces showed that manufacturing procedure can result in surface irregularities, e.g., out-of-flatness and uneven roughness distribution. To reduce ECR, surface inspection and roughness reduction using improved polishing processes can be recommended.
- Another possibility to improve the contact is to modify the joint such that a more uniform pressure distribution is achieved. The examined bolted joints, as depicted in Fig. 8(a), leave a portion of the surface with a poor (or no) contact, which leads to higher ECR.
- Although in high pressure contacts, application of interfacial electrically conductive materials (IECM) may not be effective, as shown in Figs. 11 and 12, at low pressure joints IECM can decrease the ECR (and power loss) by 30-50%.
The measured ECR losses at the cell level can be extended over battery modules and packs if the current distribution/ variation for individual battery cells is known. Nonetheless, summation of ECR losses in large collection of batteries can be a significant energy loss.
A poor electrode-collector connection leads to heat generation at the interface. At sever operating conditions, the rate of heat generation at the electrodes due to ECR might be much higher than heat generation rate inside the battery due to electrochemical reaction. Thus, a heat flow can be initiated from the electrodes towards the battery, which can result in a considerable temperature increase and initiate thermal runaway. Excessive battery heating significantly damages battery performance, longevity, and can raise serious safety issues.
To conclude it is worth mentioning that a considerable effort has been devoted to improve the efficiency of batteries by a few percent [22]. These achievements can be simply wasted if battery modules/packs are not carefully assembled, as shown through the presented investigation.
References
- Bradley, T. H., and Frank, A. A., 2009. “Design, demonstrations and sustainability impact assessments for plug-in hybrid electric vehicles”. Renew. Sust. Energy Rev., 13, pp. 115–128.
- Hadjipaschalis, I., Poullikkas, A., and Efthimiou, V., 2009. “Overview of current and future energy storage technologies for electric power applications”. Renew. Sust. Energy Rev., 13, pp. 1513–1522.
- Granovskii, M., Dincer, I., and Rosen, M. A., 2006. “Economic and environmental comparison of conventional, hybrid, electric and hydrogen fuel cell vehicles”. J. Power Sources, 159, p. 1186.
- MacLean, H. L., and Lave, L. B., 2000. “Environmental implications of alternative-fueled automobiles: Air quality and greenhouse gas tradeoffs”. Environ. Sci. Technol, 34, pp. 225–231.
- Nelson, P., Bloom, I., Amine, K., and Henriksen, G., 2002. “Design modeling of lithium-ion battery performance”. J. Power Sources, 110, pp. 437–444.
- Hellgren, J., and Jonasson, E., 2007. “Maximisation of brake energy regeneration in a hybrid electric parallel car”. Int. J. Electric and Hybrid Vehicles, 1, pp. 95–121.
- Scrosati, B., 2000. “Recent advances in lithium ion battery materials”. Electrochim. Acta, 45, p. 2461.
- van Schalkwijk,W. A., and Scrosati, B., 2002. Advances in lithium-ion batteries. Plenum, New York.
- Bitsche, O., and Gutmann, G., 2004. “Systems for hybrid cars”. J. Power Sources, 127, pp. 8–15.
- Wang, C. Y., and Srinivasan, V., 2002. “Computational battery dynamics (CBD)—electrochemical/thermal coupled modeling and multi-scale modeling”. J. Power Sources, 110, pp. 364–376.
- Nelson, P., Dees, D., Amine, K., and Henriksen, G., 2002. “Modeling thermal management of lithium-ion PNGV batteries”. J. Power Sources, 110, pp. 349–356.
- Conte, F. V., 2006. “Battery and battery management for hybrid electric vehicles: a review”. e & i Elektrotechnik und Informationstechnik, 123, pp. 424–431.
- Kim, U. S., Shin, C. B., and Kim, C.-S., 2008. “Effect of electrode configuration on the thermal behavior of a lithium-polymer battery”. J. Power Sources, 180, pp. 909–916.
- Srinivasan, V., and Wang, C. Y., 2003. “Analysis of electrochemical and thermal behavior of li-ion cells”. J. Electrochem. Soc., 150, pp. A98–A106.
- Madhusudana, C. V., 1996. Thermal contact conductance. Springer, New York.
- Holm, R., and Holm, E., 1967. Electric contacts; theory and application. Springer, Berlin.
- Timsit, S., 1998. “Electrical contact resistance: properties of stationary interfaces”. In Conference on Electrical Contacts, 1998., Proceedings of the Forty-fourth, p. 1.
- Cooper,M. G., Mikic, B. B., and Yovanovich, M. M., 1969. “Thermal contact conductance”. Int. J. Heat Mass Transf., 12, pp. 279–300.
- Johnson, K. L., 1987. Contact mechanics. Cambridge University Press.
- Greenwood, J. A., 1966. “Constriction resistance and the real area of contact”. Br. J. Appl. Phys., 17, p. 1621.
- Taylor, J. R., 1997. An introduction to error analysis: The study of uncertainties in physical measurements. University Science Books.
- Blomgren, G. E., 1999. “Electrolytes for advanced batteries”. J. Power Sources, 81-82, pp. 112–118.