Article
Related Links
*+*GENDA E., SUZUKI Y., KASAHARA T., TANAKA Y.
Introduction
The tarsus consists of seven bones which transmit force from leg to forefoot and floor. Each tarsal bone has a unique geometry that enables articulation with the other tarsal bones and connected with each other by many ligaments. In order to study the load transmission mechanism in the foot, these uniquely-shaped articulating surfaces and the structure of ligaments need to be considered. We have attempted to solve this problem using a Discrete Element Analysis technique known as Rigid Body Spring Modeling (RBSM) (1).
Methods
RBSM was a type of finite element analysis originally developed and validated within the field of civil engineering to solve tension crack problems. In this technique, all bony segments are assumed to be rigid bodies, while ligaments and articular cartilage are modeled as distributed tensile or compressive springs. A set of equilibrium equations is formulated between the spring forces and external forces using the minimum energy principle. The loads are applied through the centroids of the rigid bodies, compressing some springs while extending others. Compressive springs carrying tension and tensile springs carrying compression are eliminated from the overall equilibrium equation and the new equations are formulated in an iterative manner until all existing springs bear reasonable values. The pressure distribution is obtained by calculating each spring force from its deformation.
A normal foot of an adult male subject aged 48 in a neutral ankle joint position was scanned using CT at 2 mm intervals. Three dimensional surface models were constructed from these data using original software. Articulating surfaces with distances less than the thickness of the cartilage were assumed to be in contact. Contact surface models were constructed as a matrix of small quadrilateral mesh elements which were equidistant from articulating bone surfaces. Compressive springs were distributed in normal direction on meshed surface at one spring per unit area. The ligaments were modeled as the line segments which resist only to tensile force. The three dimensional attachment points of the ligaments were digitized using two orthogonal projections of the model on the computer screen. The locations and stiffness of the ligaments were obtained from previous reports (2).
The ankle-and-foot joint model consisted of 14 bones from the tibia to the metatarsal bones, 22 contact surfaces, and 59 ligaments (Fig. 1). The calcaneus and five metatarsal bones assumed to be in contact with floor directly. A total load of 320 N was applied through the tibia and fibula to simulate two leg standing. The force transmission ratios in the subtalar and talonavicular joint, the transverse tarsal joint and the midtarsal joint were investigated.
Results
Figure 2 shows the pressure distribution in the entire ankle and foot joint complex. Load transmission ratio in three joints is shown in table 1. In the subtalar joint, 25% of load was transmitted in the anterior articulation, and 75% in the posterior articulation. The force transmission ratio in subtalar joint and talonavicular joint were 62% and 38%, respectively. The foot-floor force was distributed 68% in calcaneus to the floor and 32% through the five metatarsus bones.
Discussion
In this discrete element model, element nodes were considered to be at the centroid of rigid bodies, and consequently the concept of superposition of element nodes could not be applied. However, the use of elements with arbitrary shapes was possible. This concept allowed us to use a more anatomical contact surface geometry. In subtalar joint, our result was fairly consistent with the experimental result using Fuji Prescale (3). This method only require CT data to construct a model, therefore, it has possibility to apply for diseased joint such as congenital deformity, post traumatic disorder and deformity caused by osteoarthritis which are very difficult to perform using experimental methods. However, the results should be carefully examined considering the limitations of this method and further experimental studies will need to be performed in order to achieve complete validation.
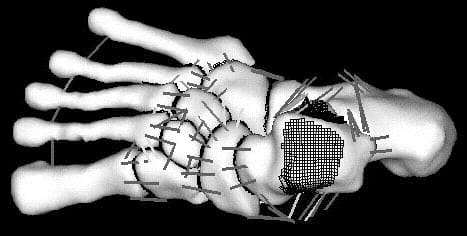
Fig. 1 Upper view of foot model with joint surface mesh and ligament line segments. Tibia and fibula are eliminated.
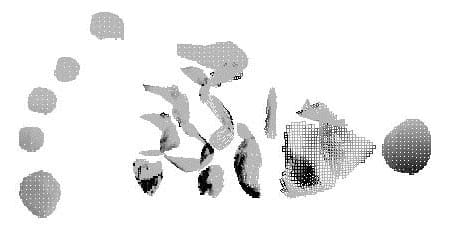
Fig. 2 Stress distribution in ankle/foot/floor contact surfaces
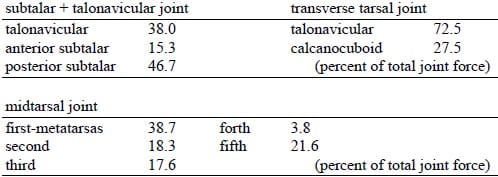
Table 1. force transmission ratio
References
- Kawai, T., and Takeuchi, N.:American Society Civil Engineers, International Conference on Computing in Civil Engineering, New York 1981.
- Attarian DE, et al: Foot Ankle 6(2) : 54-58, 1985.2)
- Chung_Li Wang, et al.:. J. Biomech. vol.28 (3) : 269-279, 1995.